
Remember me


The sample consists of 493 subjects with a mean age of 67.6 years (± 7.9). Women accounted for 50.1%; and 31.5% of the subjects were carriers of at least one ApoE ε4 allele. Our population included both CU subjects (33.5%) and those with cognitive impairment of different aetiologies, being AD the most frequent (41.1%), followed by non-degenerative pathology (13.8%), FTD (9.3%), and other degenerative dementias (2.2%). Of patients clinically diagnosed with AD (n = 203), 118 were MCI and 85 were in the dementia phase. Of 46 patients diagnosed with FTD, 16 were MCI and 30 were in the dementia stage. 49 of 68 patients diagnosed with nondegenerative pathology were MCI and 19 were in the dementia phase. Finally, 11 patients were diagnosed with other degenerative pathologies, 3 were MCI and 8 were in dementia stage.
In the overall sample, 229 subjects (46.5%) were amyloid-positive according to CSF. Of the amyloid-positive subjects, 126 (55.0%) had MCI and 97 (42.4%) were in the dementia phase. The remaining 6 subjects (2.3%) were CU.
CU volunteers were significantly younger than patients (difference = 5.5 years; p-value < 0.001) and there was a higher proportion of women in volunteer group than in patient group (X-squared = 25.3; p-value < 0.001).
We have classified subjects according to their main clinical diagnosis, but it should be noted that some patients are likely to have copathology. Of subjects not diagnosed with AD, 25 were amyloid positive and, of those, 5 were also tau positive. Of these amyloid-positive patients 12 met FTD criteria (3 were A + T +), 8 with non-degenerative pathology (2 were A + T +), and 5 with other degenerative dementias. All other features are shown in Table 1.
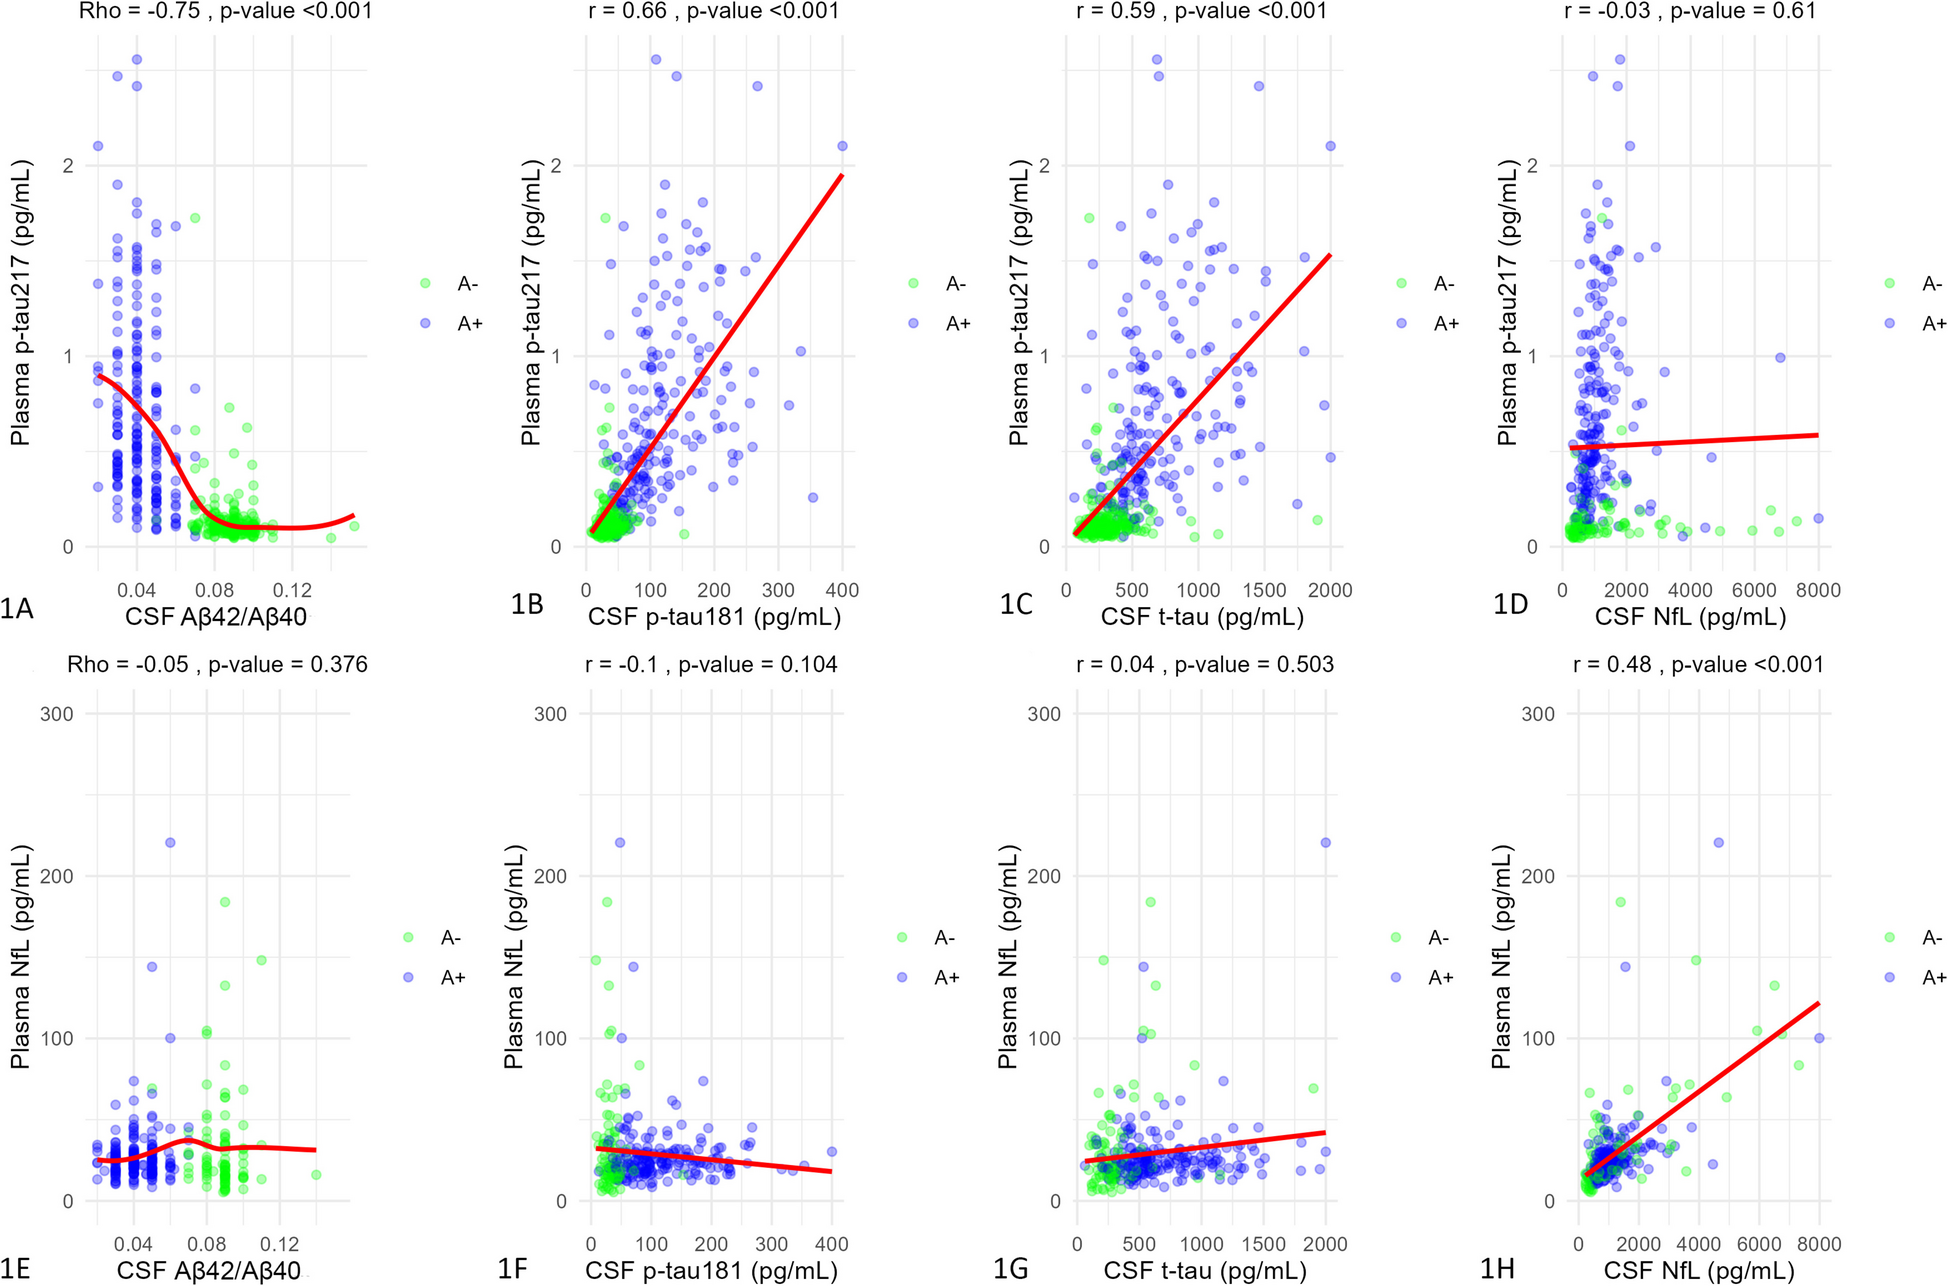
Table 1 Sample descriptionCorrelation between plasma p-tau217 and CSF biomarkersWhen correlating plasma p-tau217 levels with CSF Aβ42/Aβ40 ratio in the overall sample we found a strong and significant correlation (Rho = −0.75 ; p-value < 0.001) (Fig. 1A). The correlation was also significant in both A- (Rho = −0.18 p-value = 0.003) and A + subjects (Rho = −0.31; p-value < 0.001). When we made this correlation in subjects clinically diagnosed with AD, the results were also significant (Rho = −0.22; p-value = 0.004) and remained significant in AD-MCI (Rho = −0.30; p-value = 0.002), but not in AD-dementia group (Rho = −0.04; p-value = 0.75). Correlation between plasma p-tau217 and CSF Aβ42/Aβ40 in subjects with dementias other than AD was also significant (Rho = −0.29; p-value < 0.001).
Fig. 1
Correlations between both plasma p-tau217 and NfL and CSF biomarkers. The plots show correlations between plasma p-tau217 (A-D) and NfL (E-H) and CSF biomarkers. CSF amyloid ratio correlations were measured by Spearman's Rho and the rest by Pearson's correlation coefficient. X-axes corresponds to CSF values (all except amyloid ratio expressed in pg/mL) and Y-axes to plasma values (expressed in pg/ml). Dots represent a pair of values of both variables for each observation. The green ones are those corresponding to amyloid-negative subjects and the blue ones represent amyloid-positive subjects. Red lines are regression lines. Above each plot are the correlation values and their statistical significance. Abbreviations: CSF, cerebrospinal fluid. P-tau, phosphorylated tau. T-tau, total tau. NfL, neurofilament light chain. R, Pearson’s correlation coefficient. p-value, statistical significance. A, amyloid status
In the overall sample, plasma p-tau217 correlated significantly with CSF p-tau181 (r = 0.66; p-value < 0.001) (Fig. 1B) and this correlation was also significant in AD patients (r = 0.39; p-value < 0.001). In AD-MCI patients they correlated significantly (r = 0.41; p-value < 0.001) and also in AD-dementia (r = 0.34; p-value = 0.004). When stratified by amyloid status, the correlation was only significant in A + subjects (r = 0.43; p-value < 0.001).
Plasma p-tau217 in the overall sample correlated significantly with CSF t-tau (r = 0.59; p-value < 0.001) (Fig. 1C). They also correlated in A + subjects (r = 0.40; p-value < 0.001), and in AD patients (r = 0.42; p-value < 0.001). The correlation in AD patients remained significant after stratifying by AD-MCI (r = 0.44; p-value < 0.001) and AD-dementia (r = 0.34; p-value = 0.004).
Plasma p-tau217 was not significantly correlated with CSF NfL in either the overall sample (r = −0.03; p-value = 0.61) (Fig. 1D) neither in non-AD subjects (r = −0.03; p-value = 0.61). However, the correlation was weak but significant in AD patients (r = 0.25; p-value < 0.001) and remained significant only in AD-MCI patients (r = 0.23; p-value = 0.002). Correlations according to different clinical groups as well as correlations between plasma p-tau217/Aβ42 and CSF biomarkers can be found in Supplementary Material 2.
Correlation between plasma NfL and CSF biomarkersPlasma NfL concentrations did not correlate significantly with CSF Aβ42/Aβ40 ratio in the overall sample (Rho = −0.05; p-value = 0.37) (Fig. 1E). We only found a significant correlation in non-AD subjects (Rho = −0.22; p-value = 0.02). The correlation between plasma NfL and CSF p-tau181 was not significant in the overall sample (r = −0.09; p-value = 0.10) (Fig. 1F); nor it was in AD (r = 0.04; p-value = 0.63) or in patients without AD (r = −0.1; p-value = 0.1).
CSF t-tau did not correlate significantly with plasma NfL in the overall sample (r = 0.04; p-value = 0.50) (Fig. 1G). However, it was significant in subjects without AD diagnosis (r = 0.25; p-value = 0.01). When splitting the sample by amyloid status we found a correlation in A + subjects (r = 0.18; p-value = 0.01). In the overall sample, the correlation between plasma and CSF NfL was significant (r = 0.48; p-value < 0.001) (Fig. 1H). In patients diagnosed with AD, the correlation was also significant (r = 0.38; p-value < 0.001), even after stratifying by AD-MCI (r = 0.44; p-value < 0.001) and AD-dementia (r = 0.28; p-value = 0.03). The same happened in non-AD patients (r = 0.47; p-value < 0.001). The correlation was significant in both A- (r = 0.47; p-value < 0.001) and A + (r = 0.55; p-value < 0.001).
Full correlations between plasma NfL and CSF biomarkers (both in the overall sample and in A- and A + subjects) before and after removing plasma NfL outliers, and description of the method used can be found in Supplementary Material 2.
Plasma p-tau217, p-tau217/Aβ42, and NfL values by clinical diagnosisWhen comparing plasma p-tau217 levels according to clinical diagnosis, we found significant overall differences (p-value < 0.001) (Fig. 2A). Therefore, we performed a post-hoc analysis that showed significant differences between AD-MCI and AD-dementia patients (difference = 0.24 pg/ml; p-value < 0.001); AD-MCI and healthy controls (difference = 0.55 pg/ml; p-value < 0.001); AD-dementia and controls (difference = 0.79 pg/ml; p-value < 0.001); AD-MCI and FTD patients (difference = 0.51 pg/ml; p-value < 0.001); AD-dementia and FTD (difference = 0.76 pg/ml; p-value < 0.001); AD-MCI and non-degenerative pathology (difference = 0.52 pg/ml; p-value < 0.001); AD-dementia and non-degenerative pathology group (difference = 0.76 pg/ml; p-value < 0.001); and AD-dementia and other degenerative pathologies (difference = 0.41 pg/ml; p-value = 0.04).
Fig. 2
Plasma p-tau217, p-tau217/Aβ42, and NfL values by clinical diagnosis and cognitive status. Figures show box and whiskers plots of plasma biomarkers by groups. In Figures A, B, and C, X axis represents the different clinical diagnostic groups (AD-MCI, AD-dementia, FTD, other degenerative pathology, non-degenerative pathology, and controls). In Figures C, D, and E, X axis represents different cognitive status (cognitively unimpaired, MCI and dementia). Y axis corresponds to plasma concentrations expressed in pg/ml. Boxes show the interquartile range (the upper boundary is the Q3, and the lower boundary is the Q1). The line inside the box corresponds to the median of the sample and the whiskers represent the maximum (upper) and minimum (lower) values. In first row individual values are shown in different colors and shapes according to clinical diagnosis and cognitive status. Dots represent CU subjects, triangles are MCI patients, and squares show patients with dementia. Dark blue color corresponds to patients with AD-dementia, light blue to AD-MCI patients, purple to controls, green to non-degenerative pathology, and red to other degenerative pathology. In second row, green dots correspond to amyloid-negative subjects and red ones to amyloid-positive subjects. Significant differences are represented with three asterisks between boxes. Healthy volunteers are not included in NfL analysis because plasma NfL was not available for this group. Abbreviations: AD, Alzheimer's Disease. FTD, frontotemporal dementia. P-tau, phosphorylated tau. NfL, neurofilament light chain. CU, cognitively unimpaired. MCI, mild cognitive impairment. A, amyloid group. n, number of participants
Plasma p-tau217/Aβ42 ratio showed overall differences (p-value < 0.001) so we performed a post-hoc analysis. Main differences were found between both AD-MCI and AD-dementia patients and the rest of groups. Thus, AD-MCI patients showed significant differences with FTD patients (difference = 0.023; p-value < 0.001), non-degenerative group (difference = 0.024; p-value < 0.001), other degenerative dementias (difference = 0.019; p-value = 0.001), and with controls (difference = 0.024; p-value < 0.001) (Fig. 2B). AD-dementia patients showed significantly higher values of plasma p-tau217/Aβ42 than FTD patients (difference = 0.037; p-value < 0.001), non-degenerative group (difference = 0.038; p-value < 0.001), other degenerative dementias (difference = 0.028; p-value = 0.001), and with controls (difference = 0.038; p-value < 0.001) (Fig. 2B). The remaining comparisons of plasma p-tau217 and p-tau217/Aβ42 values, including those with overall AD group and after stratifying for AD-MCI and AD-dementia, with effect sizes and its confidence intervals can be found Table 2.
Table 2 Plasma p-tau217 and p-tau217/Aβ42 differences by clinical diagnosisWe analyzed differences in plasma NfL concentrations according to clinical diagnosis and found no overall differences (p-value = 0.051) so no post-hoc analysis was performed (Fig. 2C).
Plasma p-tau217, p-tau217/Aβ42, and NfL values by cognitive statusWe initially correlated plasma p-tau217 levels with GDS scale, and the age-adjusted results were statistically significant (r = 0.41; p-value < 0.001).
When analyzing plasma p-tau217 levels as a function of cognitive status independent of clinical diagnosis, in the overall sample we found significant differences between CU and MCI subjects (difference = 0.35 pg/mL; p-value < 0.001), between CU and dementia subjects (difference = 0.49 pg/mL; p-value < 0.001); and between MCI and dementia patients (difference = 0.13 pg/mL; p-value = 0.01) (Fig. 2D). We also analyzed differences in plasma p-tau217 concentrations between patients with MCI and dementia due to clinically diagnosed AD, and they were significant (difference = 0.24 pg/mL; p-value = 0.002; Cohen's d = 0.4).
Plasma p-tau217/Aβ42 ratio also correlated significantly with GDS scale (r = 0.39; p-value < 0.001). In the overall sample, CU and MCI subjects showed significant differences (0.015; p-value < 0.001), and so did CU and dementia subjects (difference = 0.022; p-value < 0.001), and MCI and dementia groups (difference = 0.007; p-value = 0.003) (Fig. 2E). When analyzing differences in plasma p-tau217/Aβ42 ratio between MCI and patients with dementia due to AD, we found a significant difference of 0.014 (p-value < 0.001; Cohen’s d = 0.63).
Plasma NfL levels correlated significantly with GDS scale values in the overall sample (r = 0.26; p-value < 0.001). When we analyzed differences by cognitive status, CU subjects did not show significantly different levels from those with MCI (difference = 6.04 pg/mL; p-value = 0.95). The difference was also no significant between CU and dementia groups (difference = 33.6 pg/mL; p-value = 0.21). However, the difference in plasma NfL concentrations was significant between MCI and dementia patients (difference = 27.5 pg/mL; p-value < 0.001) (Fig. 2F), even after adjusting for age (difference = 26.43 pg/mL; p-value < 0.001). We have also assessed differences in plasma NfL between subjects with MCI and dementia clinically diagnosed with AD and the results were significant (difference = 6.7 pg/mL; p-value = 0.002) even after adjusting for age (difference = 6.01 pg/mL; p-value = 0.01).
Plasma p-tau217, p-tau217/Aβ42 ratio, and NfL values by amyloid statusIn the overall sample we analyzed the differences in plasma biomarker concentrations according to amyloid status as defined by CSF Aβ42/Aβ40. P-tau217 showed significantly higher levels in A + subjects than in A- (difference = 0.58 pg/mL; p-value < 0.001) and the same was true for p-tau217/Aβ42 (difference = 0.027; p-value < 0.001). However, we found no significant difference in plasma NfL levels (difference = 17.7 pg/mL; p-value = 0.09). Next, we analyzed differences in plasma biomarker concentrations according to amyloid status within each cognitive group. Thus, we compared the concentrations of these biomarkers in subjects with MCI presumably due to AD-type pathology (A +) versus those with MCI of other origin (A-) and did the same in subjects with dementia. Plasma p-tau217 values were significantly different between A- and A + groups in MCI patients (difference = 0.53 pg/mL; p-value < 0.001; Cohen's d = 1.31). The same happened when comparing p-tau217 values between subjects with dementia due to AD compared to those with dementia due to other pathologies (difference = 0.65 pg/mL; p-value < 0.001; Cohen's d = 1.41) (Fig. 2D).
Plasma p-tau217/Aβ42 values were significantly different between A- and A + groups in MCI patients (difference = 0.023; p-value < 0.001; Cohen’s d = 1.40) and in patients with dementia (difference = 0.033; p-value < 0.001; Cohen’s d = 1.57) (Fig. 2E).
Regarding plasma NfL concentrations, in subjects with MCI there were no significant differences between A- and A + groups (difference = 2.7 pg/mL; p-value = 0.13). However, in dementia patients we found significant differences between A- and A + groups (difference = 45.7 pg/mL; p-value = 0.01) (Fig. 2F).
Influence of physiological variables and comorbidities on plasma p-tau217 and p-tau217/ Aβ42 ratioWe have performed multiple regression models to study how eGFR, HT and DM (VRF) affect plasma p-tau217 values. We have adjusted by other relevant variables such as ApoE ε4 status, amyloid status, age and sex. In the overall sample, p-tau217 showed to be influenced by eGFR (standarized β = −0.08; p-value = 0.005), female sex (standarized β = −0.16; p-value = 0.03), and amyloid positivity (standarized β = 0.58; p-value < 0.001). This model had an adjusted R-squared of 0.50.
Plasma p-tau217/Aβ42 ratio was only affected by amyloid positivity with a standarized β of 0.02 (p-value < 0.001). This model had an Adjusted R-squared of 0.51.
Regarding p-tau181, its plasma levels were influenced by eGFR (standarized β = −0.27; p-value < 0.001), female sex (standarized β = −0.21; p-value < 0.001) and amyloid positivity (standarized β = 0.56; p-value < 0.001). The main factors influencing plasma Aβ42/Aβ40 levels were CSF amyloid positivity (standarized β = −0.63; p-value < 0.001) and ApoE4 status (standarized β = −0.12; p-value = 0.01).
Plasma NfL showed to be significantly influenced by eGFR (standarized β = −0.33; p-value = 0.01) and female sex (standarized β = −0.36; p-value = 0.003). Influence of the remaining factors studied on plasma biomarkers can be found in Supplementary Material 3.
Ability of plasma biomarkers to detect amyloid and AD (A + T +) pathologyThen we tested the ability of single plasma biomarkers to detect the biological signature of AD in CSF. Thus, we have studied their ability to detect amyloid pathology (differentiate between A- and A + subjects) and biologically defined Alzheimer pathology (here we differentiate between AD- and AD + subjects being the AD + those A + T +) including no covariates. In the overall sample, plasma p-tau217 showed an AUC of 0.95 to discriminate between A + and A- subjects (95%CI 0.93–0.97) with an optimal cut-off of 0.18 pg/ml (sensitivity = 0.92; specificity = 0.91). To discriminate between AD + and AD- subjects the AUC was 0.95 (95%CI 0.93–0.97) with an optimal cutoff point of 0.25 pg/ml (sensitivity = 0.90; specificity = 0.92).
For comparison, we have also evaluated the diagnostic performance of other plasma biomarkers such as p-tau181, Aβ42/Aβ40 ratio and p-tau217/Aβ42 ratio. P-tau181 discriminated between A + and A- subjects with an AUC of 0.90 (95%CI 0.87–0.93) with an optimal cutoff point of 1.37 pg/ml (sensitivity = 0.87; specificity = 0.80). To differentiate between AD + and AD- subjects the AUC was 0.90 (95%CI 0.87–0.93) with an optimal cutoff point at 1.54 pg/ml (sensitivity = 0.87; specificity = 0.83).
Aβ42/Aβ40 ratio showed an AUC of 0.72 (95%CI 0.67–0.77) to discriminate between A + and A- subjects with an optimal cut-off of 0.08 (sensitivity = 0.86; specificity = 0.56). To differentiate between AD + and AD- subjects, the AUC was 0.71 (95%CI 0.67–0.76) with an optimal cut-off placed in 0.08 (sensitivity = 0.88; specificity = 0.53).
Finally, plasma p-tau217/Aβ42 ratio differentiated between A + and A- subjects with an AUC of 0.97 (95%CI 0.95–0.98) with an optimal cut-off in 0.008 (sensitivity = 0.91; specificity = 0.94). For discriminating between AD + and AD- subjects, AUC was 0.96 (95%CI 0.95–0.98) with an optimal cut-off of 0.009 (sensitivity = 0.94; specificity = 0.92). AUC of p-tau217/Aβ42 ratio was significantly higher than that of p-tau217 alone (Z = −3.46; p-value < 0.001).
All ROC curves for both CSF amyloid and AD pathology can be seen in Fig. 3A and B, respectively. Results of logistic regression models including age, sex, and ApoE ε4 status as predictors, and full information on single biomarkers can be found in Supplementary Material 4. In addition, in an exploratory manner, we have analyzed the diagnostic ability of other combinations of biomarkers. The complete information can be found in Supplementary Table 5.
Fig. 3
Ability of single plasma biomarkers to detect CSF amyloid pathology. ROC curves showing the ability of single plasma biomarkers to detect CSF pathology. A corresponds to amyloid pathology and B to A,D pathology (A+ plus T+). X axis shows 1-specificity, and Y axis corresponds to sensitivity. Red curve corresponds to Aβ42/Aβ40 ratio; the blue one corresponds to p-tau181; green one to p-tau217/Aβ42 ratio; and purple one to p-tau217. Abbreviations: ROC, receiver operating characteristic. A, amyloid. AUC, area under the curve. P-tau, phosphorylated tau. CI, confidence interval. n, number of participants
Comments (0)