
Remember me
In this work, we analyzed data from a prospective, single-center registry study that investigates the influence of imaging and clinical parameters on functional outcomes in patients undergoing mechanical thrombectomy for acute ischemic stroke [12,13,14,15].
The study was approved by the local ethics committee.
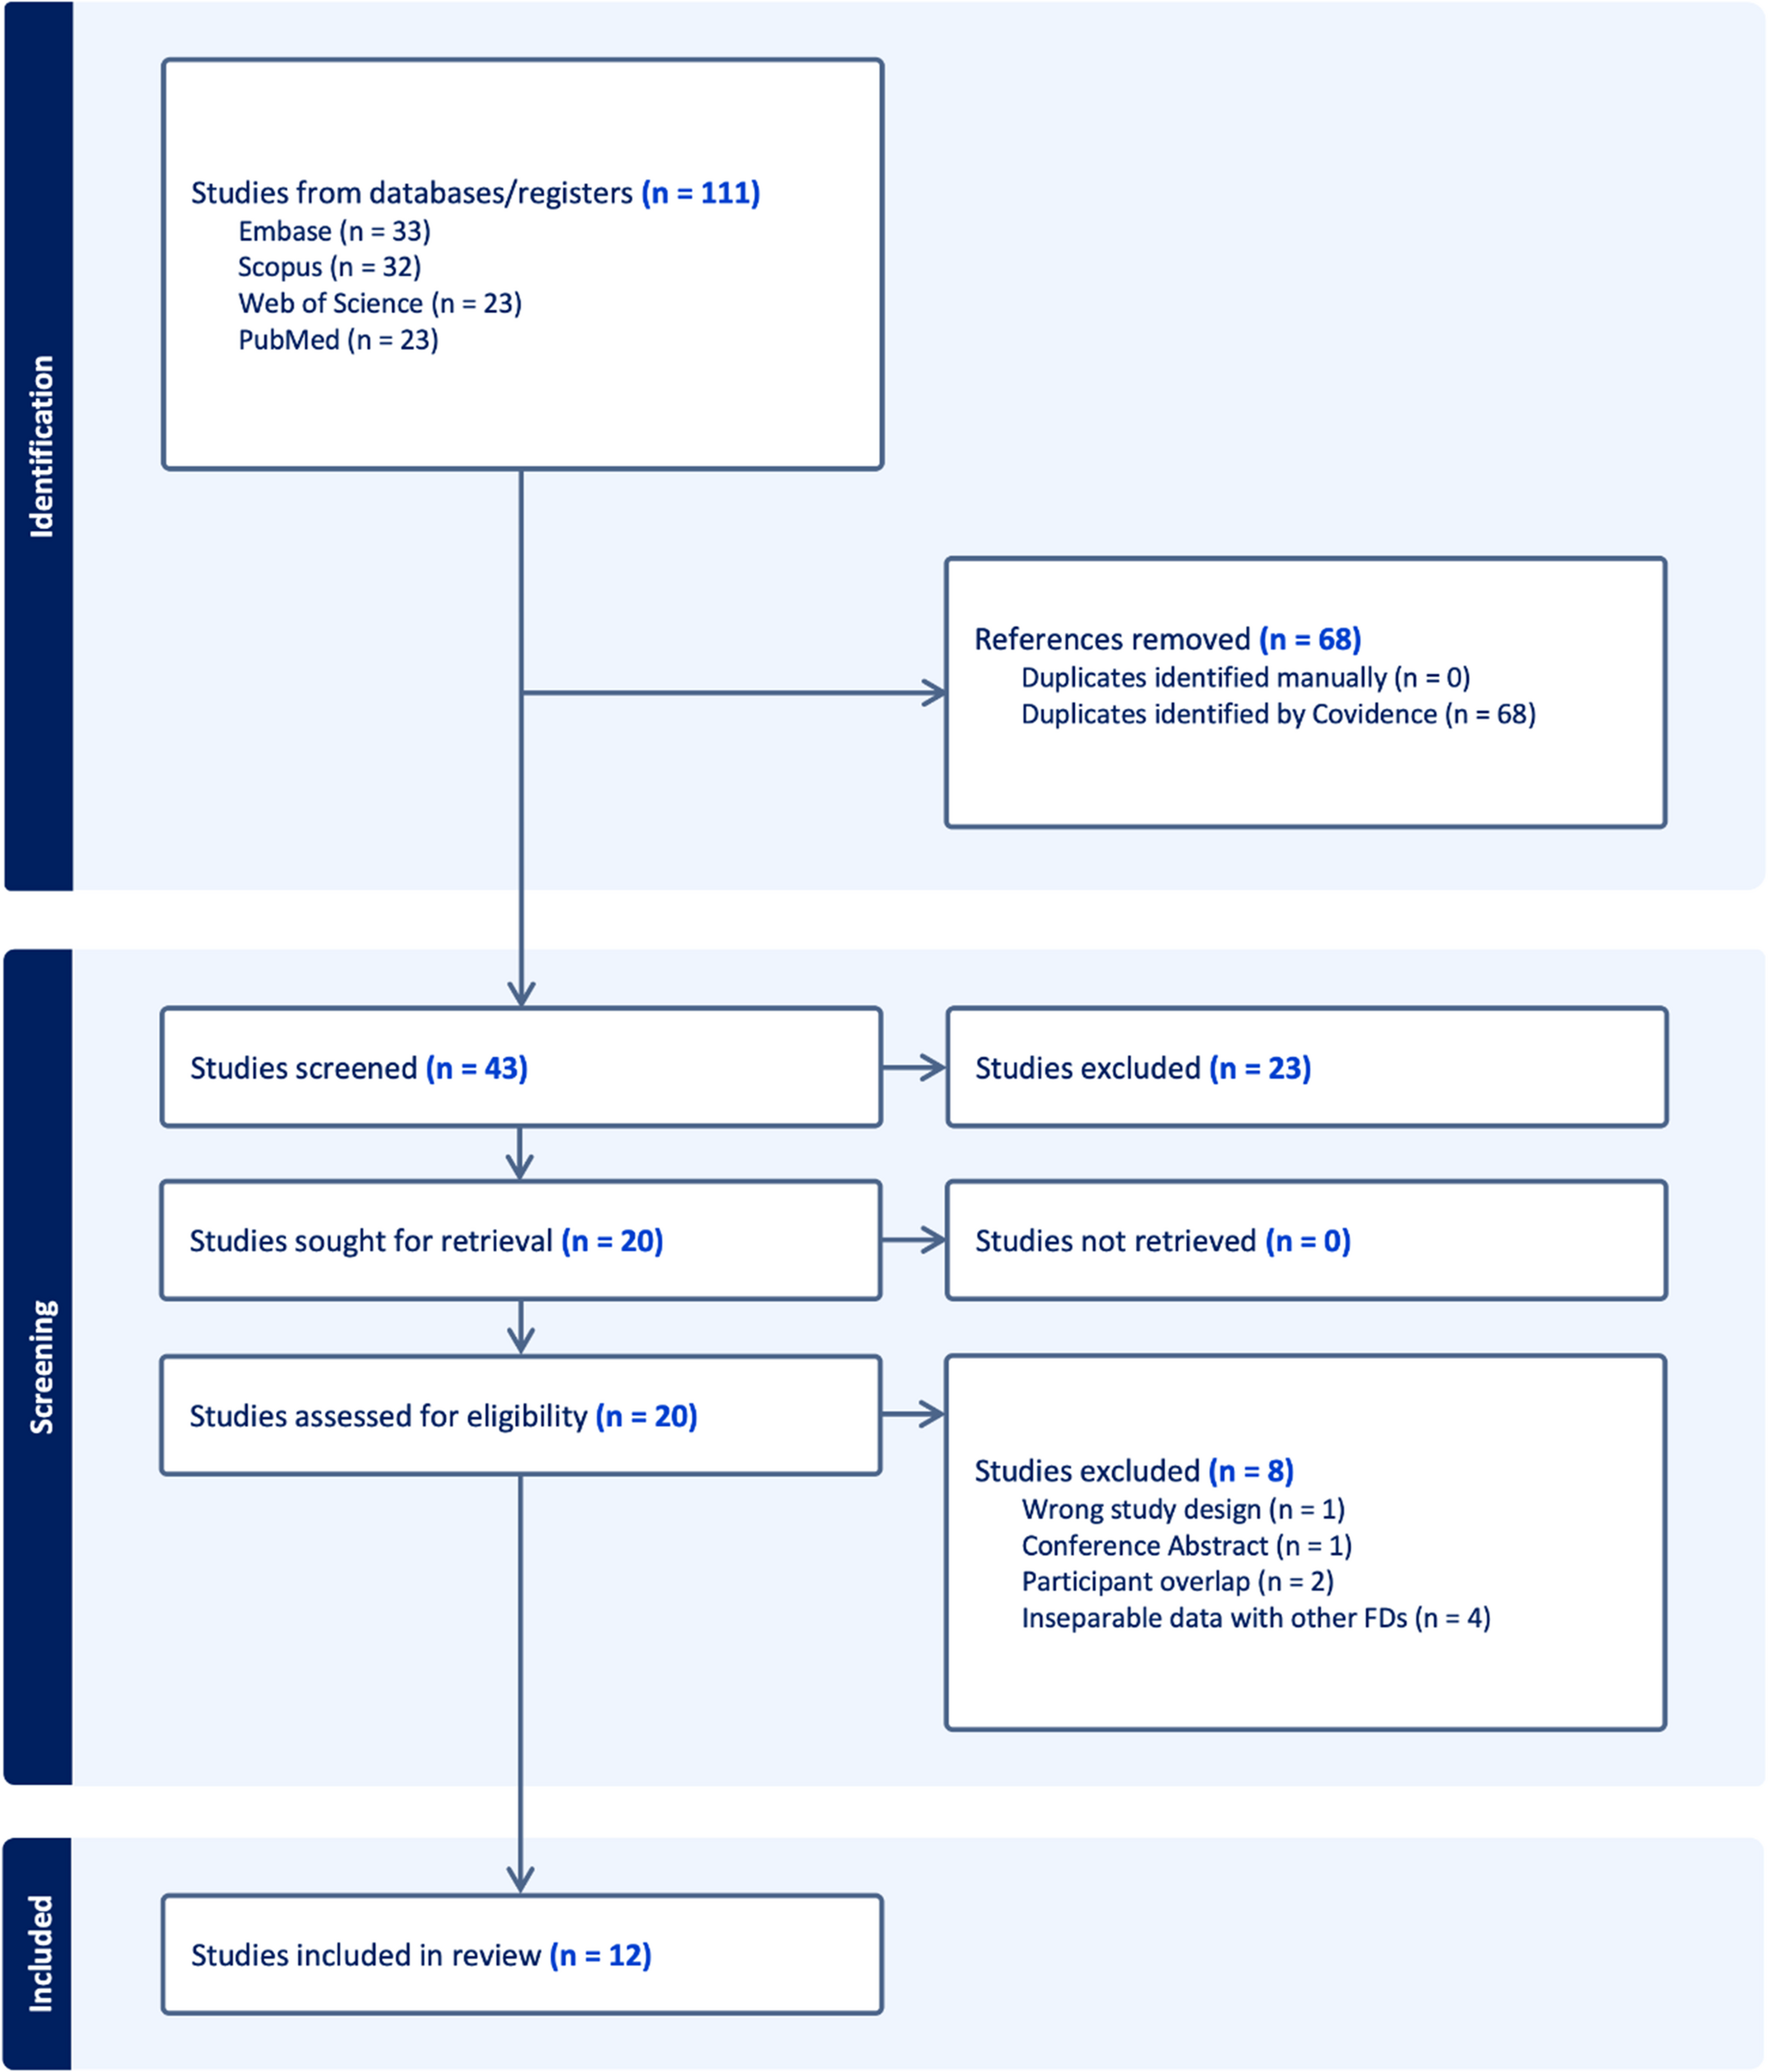
The registry includes cases of mechanical thrombectomy for middle cerebral artery occlusions at our institution between 2016 and 2018, with available outcome data and pre-interventional imaging of the cervical and intracranial arteries. These cases were manually reviewed and screened according to the following exclusion criteria: (1) additional carotid artery occlusion on the affected side, (2) additional vascular dissection on the affected side, (3) initial performance of a Magnetic Resonance Imaging (MRI) instead of CTA, (4) incomplete assessment of the aortic arch on CTA and (5) no immediate endovascular intervention (Fig. 1).
Fig. 1
Study Selection Flowchart
Mechanical thrombectomy was conducted using Stent-Retriever thrombectomy in combination with aspiration catheters. Choice of materials was up to the interventionalist but followed a standard scheme: The local standard for anterior circulation stroke during study period included access via an 80 cm 8 French (F) sheath (Arrow-Flex®, Teleflex, Athlone, Ireland), together with or without an additional 8 F guiding catheter (8 F MPD Vista Brite Tip®, Cordis Corp., Hialeah, FL, USA), a 6 F aspiration catheter (SOFIA™, MicroVention Inc., Aliso Viejo, CA, USA), 0.021 inch microcatheter (NeuroSlider®, Acandis GmbH, Pforzheim, Germany) and 0.014 inch microwire (Synchro®, Stryker corp., Kalamazoo, MI, USA). Thrombectomy was usually performed with Aperio® stent-retrievers (Acandis GmbH, Pforzheim, Germany) using the SAVE technique [16]. In some cases, thrombectomy was performed in SOLUMBRA technique or sole aspiration [17]. Only patients who underwent at least one thrombectomy maneuver or at least one aspiration were included in the study. Patients undergoing either planned stenting or emergently indicated stenting, such as for dissection, were explicitly excluded from the study.
To comprehensively characterize the sample, the following data were collected: presence of any of the previously mentioned exclusion criteria, sex, age, administration of intravenous thrombolysis, the affected hemisphere, and the presence of comorbidities, including diabetes, hypertension, atrial fibrillation, and peripheral arterial vascular disease (pAVD), as well as information on smoking habits.
Procedural data were recorded including specific time points: symptom onset time, intravenous thrombolysis time (if performed), groin puncture time, recanalization time. The following time intervals were calculated: recanalization interval (from groin puncture to successful recanalization), onset to groin puncture interval (from symptom onset to the start of thrombectomy) and onset to recanalization interval (from symptom onset to successful recanalization). Success of recanalization was assessed using the expanded and modified Thrombolysis In Cerebral Infarction (mTICI) scale including mTICI 0, mTICI 1, mTICI 2a, mTICI 2b, mTICI 2c and mTICI 3.
Patient outcomes were assessed using the National Institute of Health Stroke Scale (NIHSS) and the modified Rankin scale (mRS), both at admission and discharge. The mRS was additionally assessed after three months to evaluate follow up outcomes.
Hemorrhagic transformations and complications were collected and categorized in bleeding complications, cerebral edema, groin bleeding, femoral vessel occlusion and arterial dissection. Bleeding complications were classified according to the Heidelberg Bleeding Classification and ECASS Classification (European Cooperative Acute Stroke Study), which is integrated in the Heidelberg classification: class 1a: scattered small petechiae (HI1); class 1b: confluent petechiae (HI2); class 1c: hematoma within infarcted tissue, occupying < 30% (PH1), with no substantive mass effect; class 2: intracerebral hemorrhage within and beyond infarcted brain tissue (PH2); class 3a: parenchymal hematoma remote from infarcted brain tissue; class 3b: intraventricular hemorrhage; class 3c: subarachnoid hemorrhage; class 3d: subdural hemorrhage [18].
Measurement of carotid elongationCarotid artery measurements were performed on the side of the hemisphere affected by middle cerebral artery occlusion. To assess carotid elongation and tortuosity, we proposed an easy-to-assess imaging marker calculated as the ratio between the (centerline) extracranial carotid length (common and extracranial internal carotid artery) and the z-axis length of the scan (carotid elongation ratio; CER). Measurements were performed using the 3D vessel analysis tool implemented in the Sectra IDS7 Picture Archiving and Communication System (PACS) (IDS7/dx version 24.1.13.5511 (x64), Sectra AB, Linköping, Sweden). The length of the extracranial carotid artery (common and extracranial internal carotid artery) was measured from its arterial origin at the aortic arch to the entrance into the carotid canal of the petrous bone at the skull base along the arterial centerline. For the right side, the brachiocephalic trunk was included to the measurement of the carotid artery. In cases where the right carotid artery directly originates from the aortic arch, measurement started from the level of the aortic arch. The measurement was conducted for the entire extracranial carotid artery as described above and, additionally, for the common carotid artery and extracranial internal carotid artery separately. The transition point between common carotid artery and internal carotid artery was positioned at the level of the bifurcation (Fig. 2). The denominator of CER was defined as the Chebyshev distance [19] along the z-axis in the 3-dimensional room, which represents the straight distance parallel to the table and orthogonal to the scanning direction between both measurement points (Fig. 2). Even though the Euclidean distance could also serve as a viable option for this measurement, we chose a table-oriented approach in our methodology rather than a patient-oriented reference in order to enhance the simplicity of assessment without the need for individualized multiplanar reconstructions and, consequently, to improve the reproducibility of the measure.
Carotid artery measurements were performed on the side of the hemisphere affected by middle cerebral artery occlusion. To assess carotid elongation and tortuosity, we proposed an easy-to-assess imaging marker calculated as the ratio between the (centerline) extracranial carotid length (common and extracranial internal carotid artery) and the z-axis length of the scan (carotid elongation ratio; CER). Measurements were performed using the 3D vessel analysis tool implemented in the Sectra IDS7 Picture Archiving and Communication System (PACS) (IDS7/dx version 24.1.13.5511 (x64), Sectra AB, Linköping, Sweden). The length of the extracranial carotid artery (common and extracranial internal carotid artery) was measured from its arterial origin at the aortic arch to the entrance into the carotid canal of the petrous bone at the skull base along the arterial centerline. For the right side, the brachiocephalic trunk was included to the measurement of the carotid artery. In cases where the right carotid artery directly originates from the aortic arch, measurement started from the level of the aortic arch. The measurement was conducted for the entire extracranial carotid artery as described above and, additionally, for the common carotid artery and extracranial internal carotid artery separately. The transition point between common carotid artery and internal carotid artery was positioned at the level of the bifurcation (Fig. 2). The denominator of CER was defined as the Chebyshev distance [19] along the z-axis in the 3-dimensional room, which represents the straight distance parallel to the table and orthogonal to the scanning direction between both measurement points (Fig. 2). Even though the Euclidean distance could also serve as a viable option for this measurement, we chose a table-oriented approach in our methodology rather than a patient-oriented reference in order to enhance the simplicity of assessment without the need for individualized multiplanar reconstructions and, consequently, to improve the reproducibility of the measure.
The carotid elongation ratio was assessed by one author (VI, 3 years of experience), and was verified by another author reviewing all measurements (JC, 11 years of experience). Review focused on ensuring that the measurements were performed in accordance with the definition provided above and executed accurately to the defined measurement points. The raters were blinded to the clinical information.
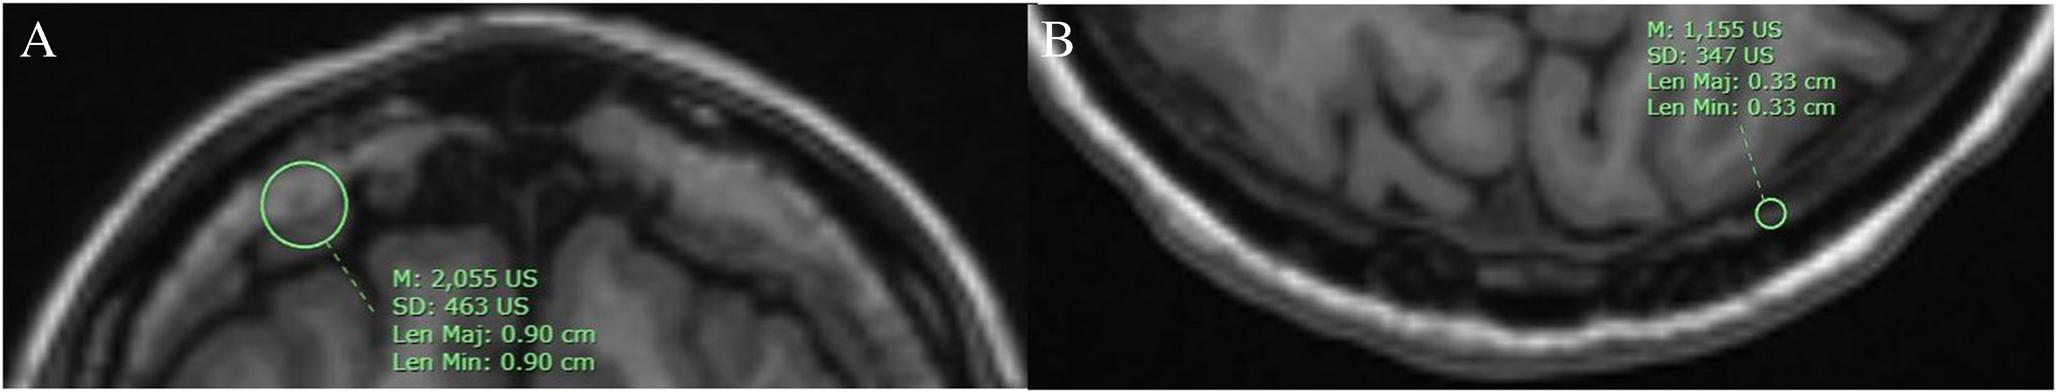
Fig. 2
Measurement of Carotid Elongation Ratio. a. & b.: Carotid artery centerline measurement in 3D reconstruction (a) and vascular analysis view (b) using the 3D vessel analysis tool by Sectra AB [Sectra] IDS7/dx version 24.1.13.5511 (x64). Length of common carotid artery (green, 138 mm) and extracranial internal carotid artery (yellow, 108 mm). The total length of the carotid artery (length of the common carotid artery plus the extracranial internal carotid artery) is 108 mm + 138 mm = 246 mm. c. & d.: Z-axis measurement in lateral computed tomography angiography. Blue marker indicates the access artery’s origin from the aortic arch. Red marker indicates the entry point of the internal carotid artery into the skull base. The white line represents the Z-axis between these markers, measured parallel to the CT table. In this case, the Z-axis measures 171 mm. a. - d.: CER from this example: (138 + 108): 171 = 1.43. A: entry point of internal carotid artery into the skull base; B: bifurcation; C: artery’s origin from the aortic arch
Statistical analysisStatistical analysis was conducted using R statistics (R Core Team, version 4.3.0) [20]. Descriptive statistics were employed to summarize the demographic characteristics and procedural variables. The relationship between CER and the duration of intervention were analyzed using Pearson correlation analyses. Patients in which no reperfusion could be achieved in the endovascular procedure (i.e., mTICI 0) were not considered in the analysis of intervention time. The relationship between CER and patient outcomes as well as recanalization results, (post-) procedural complications and NIHSS at admission, were analyzed with correlation analyses. Additionally, partial correlation was performed between CER and dichotomized outcome controlling for age, sex, diabetes, arterial hypertension, and smoking habits. Group comparisons were performed by using unpaired two-sided Student’s t-test. For group comparisons, recanalization results as measured by the mTICI scale were dichotomized. Successful recanalization was defined as mTICI 2b-3 and poor recanalization as mTICI 0-2a. In a second analysis, a more conservative dichotomization threshold was used, i.e., by considering only mTICI 2c and mTICI 3 as successful recanalization. Another group comparison was performed examining CER between patients with favorable functional outcome (defined as mRS 0–2) and poor outcome (defined as mRS 3–6) at 3 months post-intervention. A binary logistic regression analysis including age, sex, CER, diabetes, arterial hypertension, atrial fibrillation, pAVD, smoking habits, NIHSS at admission, mTICI and intervention duration as features was conducted, considering Nagelkerke’s R2 and testing for multicollinearity.
A significance level of p < 0.05 was used to determine statistical significance for all statistical tests. A correlation level of rho / cor ≤ 0.2 was used to determine a weak correlation, rho / cor > 0.2 and ≤ 0.4 as moderate correlation and rho / cor > 0.4 was used to determine a strong correlation.
Comments (0)