
Remember me

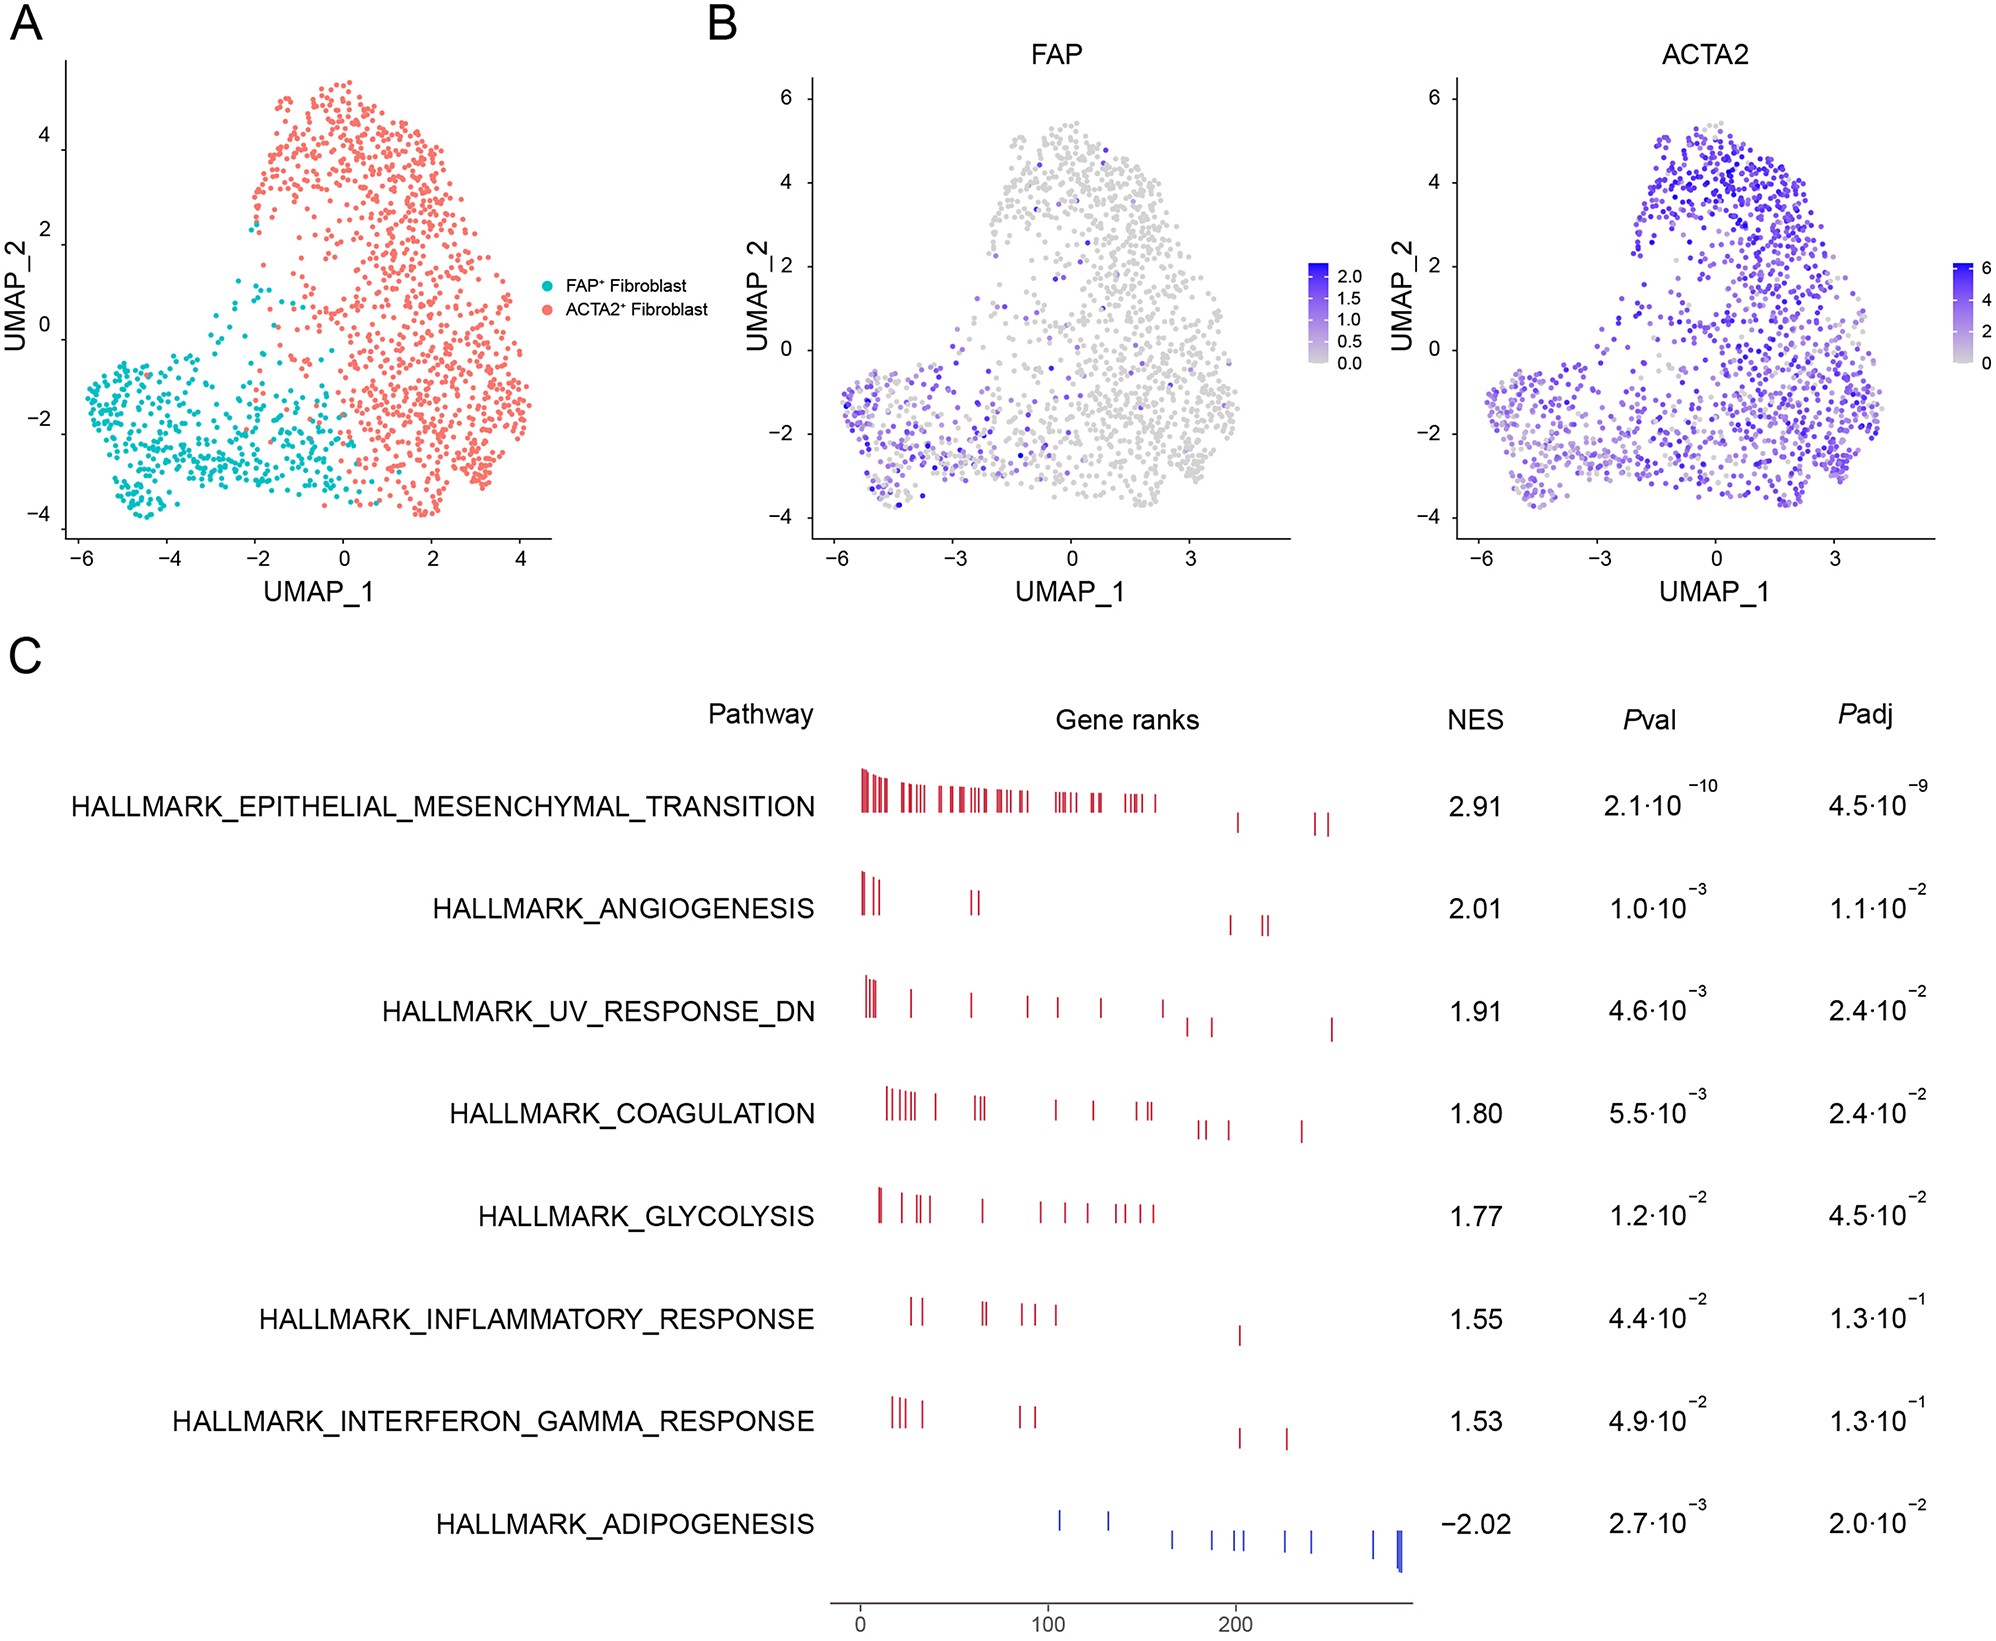
To delineate the subpopulation structure of CAFs in human HCC, we conducted graph-based clustering and unsupervised clustering on a scRNA-seq dataset obtained from a public database [23]. This analysis revealed two distinct CAF types: FAP+ fibroblasts and ACTA2+ fibroblasts (Fig. 1A). ACTA2, which encodes the smooth muscle α-actin (α-SMA), is crucial for forming thin filaments that enable smooth muscle cell contraction. Although both fibroblast subtypes expressed ACTA2, its expression level was notably higher in ACTA2+ fibroblasts. Conversely, fibroblast activation protein (FAP) was exclusively expressed in FAP+ fibroblasts (Fig. 1B).
Fig. 1
scRNA-seq analysis of two CAF cell types in human HCC tissues. (A) UMAP plot displayed CAF subsets in HCC tissue based on the clustering results. (B) UMAP plot showed the expression of FAP and ACTA2 in CAF subsets. (C) Result of GSEA showing enriched gene sets. A positive Normalized Enrichment Score (NES) value indicates enrichment in the FAP+ fibroblast phenotype, and a negative NES indicates enrichment in the ACTA2+ fibroblast phenotype
To further explore the heterogeneity between FAP+ fibroblasts and ACTA2+ fibroblasts, we employed GSEA based on the Hallmark database. The GSEA of differentially expressed genes between FAP+ fibroblasts and ACTA2+ fibroblasts revealed that 7 gene sets were significantly enriched in FAP+ fibroblast and one gene set was significantly enriched in ACTA2+ fibroblast. The Epithelial-Mesenchymal Transition (EMT) pathway is significantly enriched in FAP+ fibroblasts, suggesting that these cells may play a crucial role in tumor progression by promoting cancer cell invasion and metastasis. We also observed upregulation of angiogenesis-related pathways, implying their potential to enhance tumor growth by supporting the formation of new blood vessels while the interferon-gamma response pathway shows lower significance, but it may still contribute to immune regulation. Additionally, on the other hand, ACTA2+ fibroblasts are significantly enriched in the adipogenesis pathway, suggesting a potential role in metabolic regulation (Fig. 1C).
Expression and localization of FAP and α-SMA in HCC tissues and normal hepatocellular tissuesWe conducted mIHC staining on both HCC tissues and normal hepatocellular tissues to delineate the spatial distribution of two CAF subsets: CK−FAP+ cells (indicating iCAF cells) and CK−α-SMA+ cells (indicating myCAF cells) (Fig. 2A and D). mIHC staining results revealed that the elevated frequency of CK−FAP+ cells was observed in HCC tissues compared to normal counterparts (P < 0.01, Fig. 2B). In contrast, the frequency of CK−α-SMA+ cells showed a decrease within cancerous tissues (P < 0.0001, Fig. 2E).
Fig. 2
The proportions of myCAF and iCAF cells are associated with the prognosis of HCC patients (A) Staining of iCAF cells with mIHC and single-color images in human HCC TMA. DAPI: bright blue; CK: dark green; FAP: red. the upper panel: normal hepatocellular tissue; the lower panel: HCC tissue. (B) Kaplan-Meier survival analysis of the percentage of CK-FAP+ cells in HCC patients. (C) Comparison of the percentage of CK-FAP+ cells between normal and tumor tissues in HCC. (D) Staining of myCAFs cells with mIHC and single-color images in human HCC TMA. DAPI: bright blue; CK: dark green; α-SMA: sky-blue. the upper panel: normal hepatocellular tissue; the lower panel: HCC tissue. (E) Kaplan-Meier survival analysis of the percentage of CK-α-SMA+ cells in HCC patients. (F) Comparison of the percentage of CK-α-SMA+ cells between normal and tumor tissues in HCC
Furthermore, survival analysis was also performed to investigate the association between the percentage of iCAFs and myCAFs and patients’ survival in HCC, respectively. Survival analysis exhibited that though the higher frequency of iCAFs in tumor tissues was not significantly associated with patients’ outcomes (HR = 1.167, 95% CI: 0.694–1.961, P = 0.556, Fig. 2C), the presence of myCAFs was positively correlated with improved patient prognosis (HR = 0.387, 95% CI: 0.119–1.254, P = 0.013, Fig. 2F), suggesting that myCAFs might exert inhibitory effects on tumor growth. Additionally, we found that the frequencies of iCAFs and myCAFs were significantly associated with the patient’s pathological stage (P = 0.007 and P = 0.011, respectively, Table 1).
Table 1 The correlation between CK−FAP+ cells and CK−α-SMA+ cells in tumor and clinical features of patients with HCCThe production of TGF-β by tumor cells and its association with adverse prognosisTo comprehensively explore the cellular microenvironment of HCC, graph-based UMAP was employed to identify the main cell types, revealing a total of six clusters annotated with canonical marker genes representing T/NK cells, myeloid cells, endothelial cells, hepatocytes, fibroblasts, and B cells through the scRNA-seq data [23] (Fig. 3A). According to reports, TGF-β has been widely recognized for its fibrogenic effects, considering as a primary mediator in liver through SMAD and non-SMAD signaling pathways [24]. In this study, we examined the expression of TGF-β receptors (TGFBR1 and TGFBR2) (Fig. 3B) and TGF-β subtypes (TGFB1, TGFB2, and TGFB3) (Fig. 3C) within these cell clusters. TGFB1, crucial for cellular proliferation, growth and immune regulation, was found to be widely expressed across various cell types. To comprehensively characterize TGFB and TGFBR in HCC, we investigated their expression and distribution in various tissue compartments, including normal tissues, lymph nodes, tumors, and portal vein tumor thrombi (PVTT) of HCC patients. The analysis indicated that TGFB was predominantly expressed in T/NK cells and fibroblasts within tumor tissues and PVTT, while TGFBR was primarily expressed on fibroblasts, endothelial cells, and myeloid cells (Fig. 3D). These findings suggest a complex and cell-type-specific role of TGF-β signaling in the HCC tumor microenvironment.
Fig. 3
Increased TGF-β expression in tumor tissues is associated with the worse prognosis of HCC patients. (A) UMAP plot of six cell clusters in HCC tissues. Cells from different clusters are marked by colors. (B) Featureplot showed the expression of TGFBR1 and TGFBR2 in (A) cell clusters. (C) Featureplot showed the expression of TGFB1, TGFB2 and TGFB3 in (A) cell clusters. (D) Dotplot showed the expression percentages and average expression levels of TGFB and TGFBR in tumor tissue, PVTT, normal tissue, and lymphatic tissue in six cell clusters. The dot size reflects the percentage of gene expression, while the dot color signifies the average expression level of the gene. Red denotes high expression, whereas blue represents low expression. (E) mIHC and single-color images were obtained from HCC TMA, staining CK+TGF-β+ cells. DAPI: bright blue, CK: dark green, TGF-β: orange. the upper panel: normal hepatocellular tissue; the lower panel: HCC tissue. (F) A higher proportion of CK+ TGF-β+ cells in tumors predicts worse OS rates in HCC patients
Subsequently, mIHC was performed to discern the expression of TGF-β produced by tumor cells (CK+ cells), Tregs (CK−CD4+Foxp3+TGF-β+ cells), and CD4+T cells (CK−CD4+Foxp3−TGF-β+ cells) in HCC tissues relative to normal hepatocellular tissues (Fig. 3E, Supplemental Fig. 1A and 1B). Survival analysis revealed that those HCC patients with a higher proportion of CK+TGF-β+ cells exhibited worse overall survival (OS) than those with a lower percentage of CK+TGF-β+ cells (HR = 1.776, 95% CI: 0.920–3.428, P = 0.040, Fig. 3F). Conversely, we found that the patients with a higher frequency of TGF-β+Tregs had a better prognosis (HR = 0.533, 95% CI: 0.290–0.981, P = 0.017, Supplemental Fig. 1C). This highlights the potential protective role of TGF-β+ Tregs in the tumor microenvironment, possibly through their immunoregulatory functions. Similarly, the prognosis of patients with a higher frequency of TGF-β+CD4+T cells also tended to be better than those with a higher frequency of TGF-β+CD4+T cells, which suggests that TGF-β+CD4+T cells may contribute to a favorable immune response in HCC, although further investigation is required to fully understand the mechanisms at play (HR = 0.574, 95% CI: 0.307–1.071, P = 0.041, Supplemental Fig. 1D).
Furthermore, we examined the relationship between CK+TGF-β+ cell, TGF-β+Tregs, TGF-β+CD4+T cells and various clinical feature in HCC patients. We observed that the frequencies of CK+TGF-β+ cells were significantly associated with the patient’s TNM stage and T stage, indicating the presence of CK+TGF-β+ cells may be linked to more advanced stages of HCC, further supporting their role in tumor progression (P = 0.024, P = 0.024, respectively, Table 2). Additionally, we found that the ratio of TGF-β+CD4+T cells was significantly associated with gender (P = 0.019, Supplemental Table 1).
Table 2 The correlation between CK+TGF-β+ cells in tumors and clinical features of patients with HCCTGF-β’s contribution to the initiation and progression of HCCTo probe the role of TGF-β in the onset and advancement of HCC, we stratified the hepatocyte cluster into two groups based on TGF-β expression: TGF-βhigh and TGF-βlow. Subsequently, we performed GSEA analysis using the REACTOME database to uncover the biological processes associated with TGF-β signaling. In the TGF-βhigh group, we identified three significantly enriched categories: “cellular responses to stimuli”, “cellular responses to heat stress” and “infectious disease” (Fig. 4A). These findings suggest that TGF-βhigh hepatocytes are likely involved in cellular stress responses and immune-related pathways, which are crucial for modulating the tumor microenvironment in HCC. Further analysis using Gene Ontology (GO) from the GSEA results revealed that the TGF-βhigh group exhibited significant enrichment in several key functional modules, such as “post transcriptional regulation of gene expression”, “negative regulation of RNA biosynthetic process” and “negative regulation of gene expression” (Fig. 4B). These processes are essential for fine-tuning gene expression and maintaining cellular homeostasis, suggesting that TGF-β may play a critical role in regulating transcriptional and translational events within the liver tumor cells.
Fig. 4
TGF-β participates in the regulation of immunomodulation and other processes. (A) Gene Set Enrichment Analysis showing pathways enriched with TGF-βhigh and TGF-βlow group in the reactome gene set. (B) GSEA showing pathways enriched with TGF-βhigh and TGF-βlow groups in the GO gene set. A positive NES value indicates enrichment in the TGF-βhigh group, and a negative NES indicates enrichment in the TGF-βlow group
In contrast, the TGF-βlow group showed enrichment in pathways associated with metabolism, incuding “metabolism of lipids”, “biological oxidation”, “small molecule metabolic processes”, and “organic acid metabolism”, implying that in the absence of high TGF-β signaling, hepatocytes may prioritize metabolic processes, which could be relevant for maintaining cellular energy balance and supporting tumor growth (Fig. 4). Furthermore, pathways such as “regulation of insulin-like growth factor transport” and “hematopoiesis” were also found to be enriched, indicating a potential role of TGF-β in cell function within the tumor (Fig. 4).
Overall, our findings suggested that TGF-β was potentially involved in regulating cellular processes, signal transduction, and immune system responses within the context of HCC. The differential regulation of TGF-β signaling likely contributes to the complex pathogenesis of HCC, suggesting that TGF-β signaling could be a critical modulator of tumor progression, thus contributing to valuable insights into the molecular mechanisms driving the pathogenesis of HCC.
Regulatory network between hepatocytes and fibroblastsTo further investigate the associations among TGF-β+CK+ cells, TGF-β+Tregs, TGF-β+CD4+T cells, iCAFs and myCAFs, we conducted a detailed correlation analysis. These analysis aimed to investigate the influence of TGF-β, which is secreted by tumor cells, Treg cells, and CD4+T cells, on both iCAF and myCAF populations in HCC. The results revealed a positive correlation between TGF-β+ tumor cells and both iCAF and myCAF (R = 0.32, P = 0.0029; R = 0.27, P = 0.012, respectively, Fig. 5A and B). Additionally, TGF-β+ CD4+T cells showed a positive correlation with iCAF (R = 0.51, P < 0.0001, Supplemental Fig. 2A), while no such correlation was observed with myCAFs. Interestingly, TGF-β+Tregs did not show a significant correlation with either iCAFs or myCAFs. These findings suggest that TGF-β, particularly produced by tumor cells, plays a crucial role in modulating the progression of HCC by influencing the behavior of both iCAF and myCAF populations.
Fig. 5
Cell-cell communication network in HCC TME. (A) Scatterplot showed the correlation between iCAFs and tumor cells producing TGF-β. (B) Scatterplot showed the correlation between myCAFs and tumor cells producing TGF-β. (C) Dotplot of ligand-receptor interactions between iCAFs and hepatocytes in HCC. According to the expression of TGFB1, hepatocytes were divided into the TGFB1high group and the TGFB1low group. (D) Dotplot of ligand-receptor interactions between myCAFs and hepatocytes in HCC. According to the expression of TGFB1, hepatocytes were divided into the TGFB1high group and the TGFB1low group
To gain deeper insights into the cell-cell interactions in the TME, CellphoneDB was employed to further explore the cell-cell interaction network between hepatocytes and fibroblasts identified in our study in tumor tissues. Our analysis revealed that TGF-βhigh hepatocytes interact with CAFs by binding to specific receptors through molecules such as JAG1, EDN1, and NGF. These interactions likely contribute to crucial processes such as vascular development, immune modulation, and cellular signaling. Furthermore, hepatocytes produce VEGF isoforms, including VEGFA and VEGFB, which bind to VEGF receptors on CAFs to promote angiogenesis, a key process in tumor growth and metastasis (Fig. 5C and D). Additionally, our results indicated that iCAFs express higher levels of CXCL12, which interacts with receptors like CXCR4 and DPP4, suggesting a potential role in tumor invasion, metastasis, and treatment resistance (Fig. 5C). These findings highlight the complex network of signaling pathways between hepatocytes and fibroblasts, which may significantly impact the progression and therapeutic resistance of HCC.
Multivariate cox regression analysis of clinical featuresKaplan-Meier survival analysis on clinical data in HCC patients revealed that tumor size, particularly the maximum diameter, was associated with a poorer prognosis (HR = 2.321, 95% CI:1.297–4.151, P = 0.019, Supplemental Fig. 3C). TNM stage and T stage were also significant factors (HR = 2.491, 95% CI:1.526–4.556, P = 0.0001; HR = 2.491, 95% CI:1.526–4.556, P = 0.0001, respectively, Supplemental Fig. 3D to 3E), with patients diagnosed at later stages exhibiting worse survival rates. Following our multivariate Cox regression analysis, a number of pivotal factors significantly impacting patient survival rates were revealed. The outcomes affirmed that T stage emerged as a crucial determinant (HR = 2.222, 95% CI:1.072–4.609, P = 0.032, Fig. 6), signifying that patients diagnosed at earlier stages exhibited more favorable prognoses. Furthermore, the increase in myCAF cells exhibited a positive correlation with enhanced survival rates (HR = 0.307, 95% CI:0.118–0.798, P = 0.015, Fig. 6). These findings shed light on critical variables influencing patient survival, encompassing the CAF ratio, tumor size, and stage factors. This insight offered clinicians valuable guidance for tailoring treatments for HCC patients.
Fig. 6
Multivariate Cox model analysis of clinical parameters and different cell subsets. Forest plot showed results of multivariate Cox model analysis among clinical data and percentages of CAF subsets, CK+TGF-β+ cells, TGF-β+Treg cells and TGF-β+CD4+T cells in HCC patients
Comments (0)