
Remember me
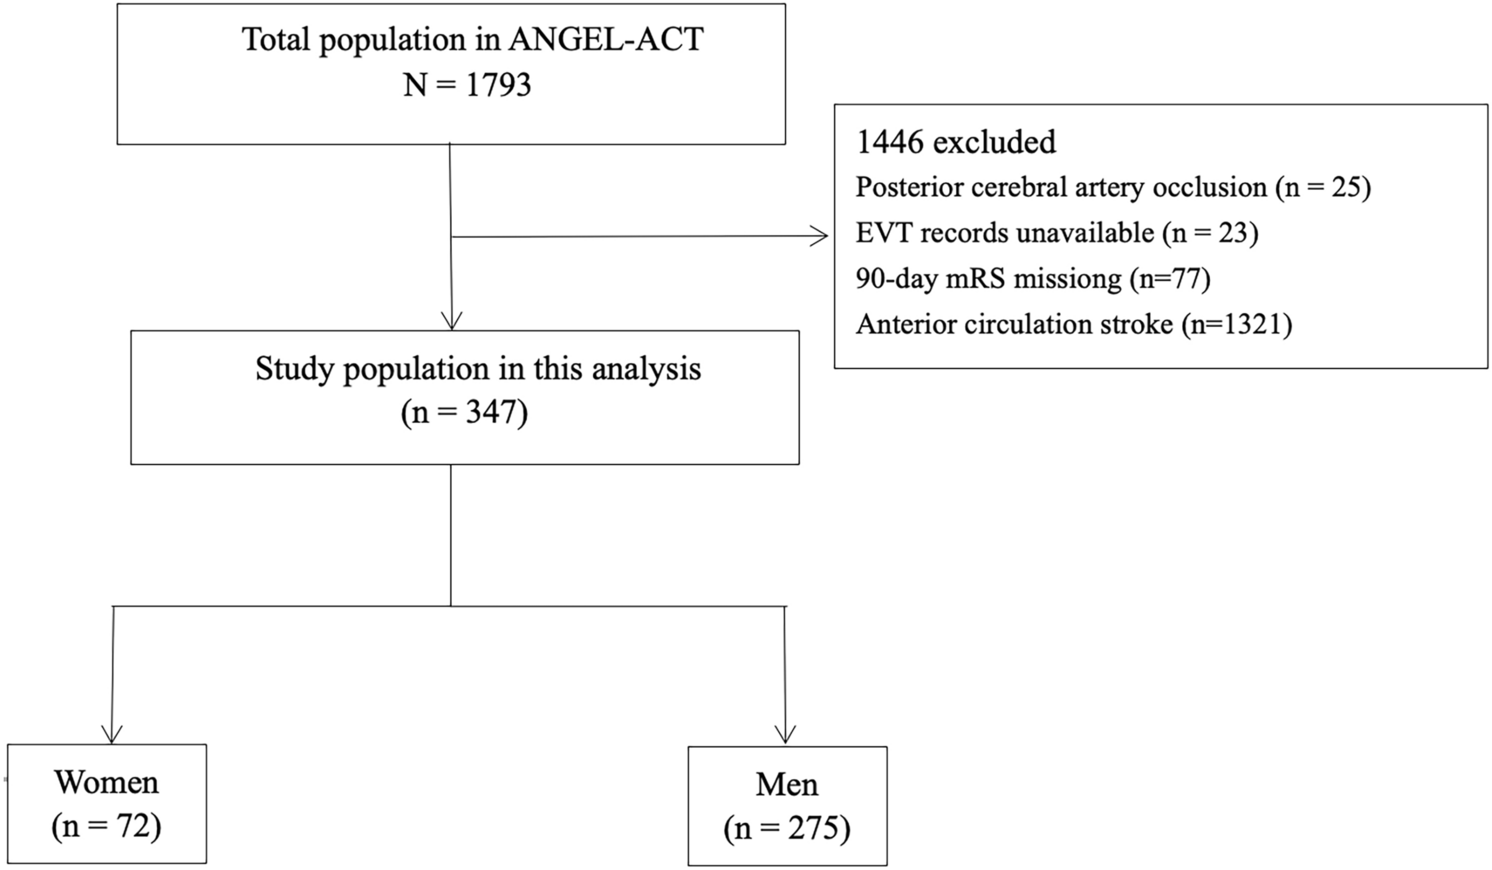

We retrospectively reviewed patients diagnosed with AE in Beijing Tiantan Hospital between Match 2019 and Match 2022 (Fig. 1). The inclusion criteria were as follows: Age, 18–80 years old; positive antibodies in serum and/or cerebrospinal fluid (CSF) [1]; 18F-FDG-PET or ASL MRI scans; and follow-up duration > 12 months (unless the patient died from AE). The exclusion criteria were as follows: structural abnormalities in conventional MRI; seizures or subclinical seizures within 2 h before and after the PET examination; FDG-PET images with insufficient glucose uptake; FDG-PET images and ASL MRI with motion artifacts; and any missing data. We excluded patients with MRI lesions to avoid the impact of structural abnormalities on brain metabolism. Furthermore, in daily clinical practice, AE is often misdiagnosed as primary psychosis when MRI results are negative [17]. All patients were followed-up after at least 1 year from symptom onset and classified into two groups based on the absence or presence of psychiatric symptoms (patients with a good psychiatric prognosis and patients with a poor psychiatric prognosis).
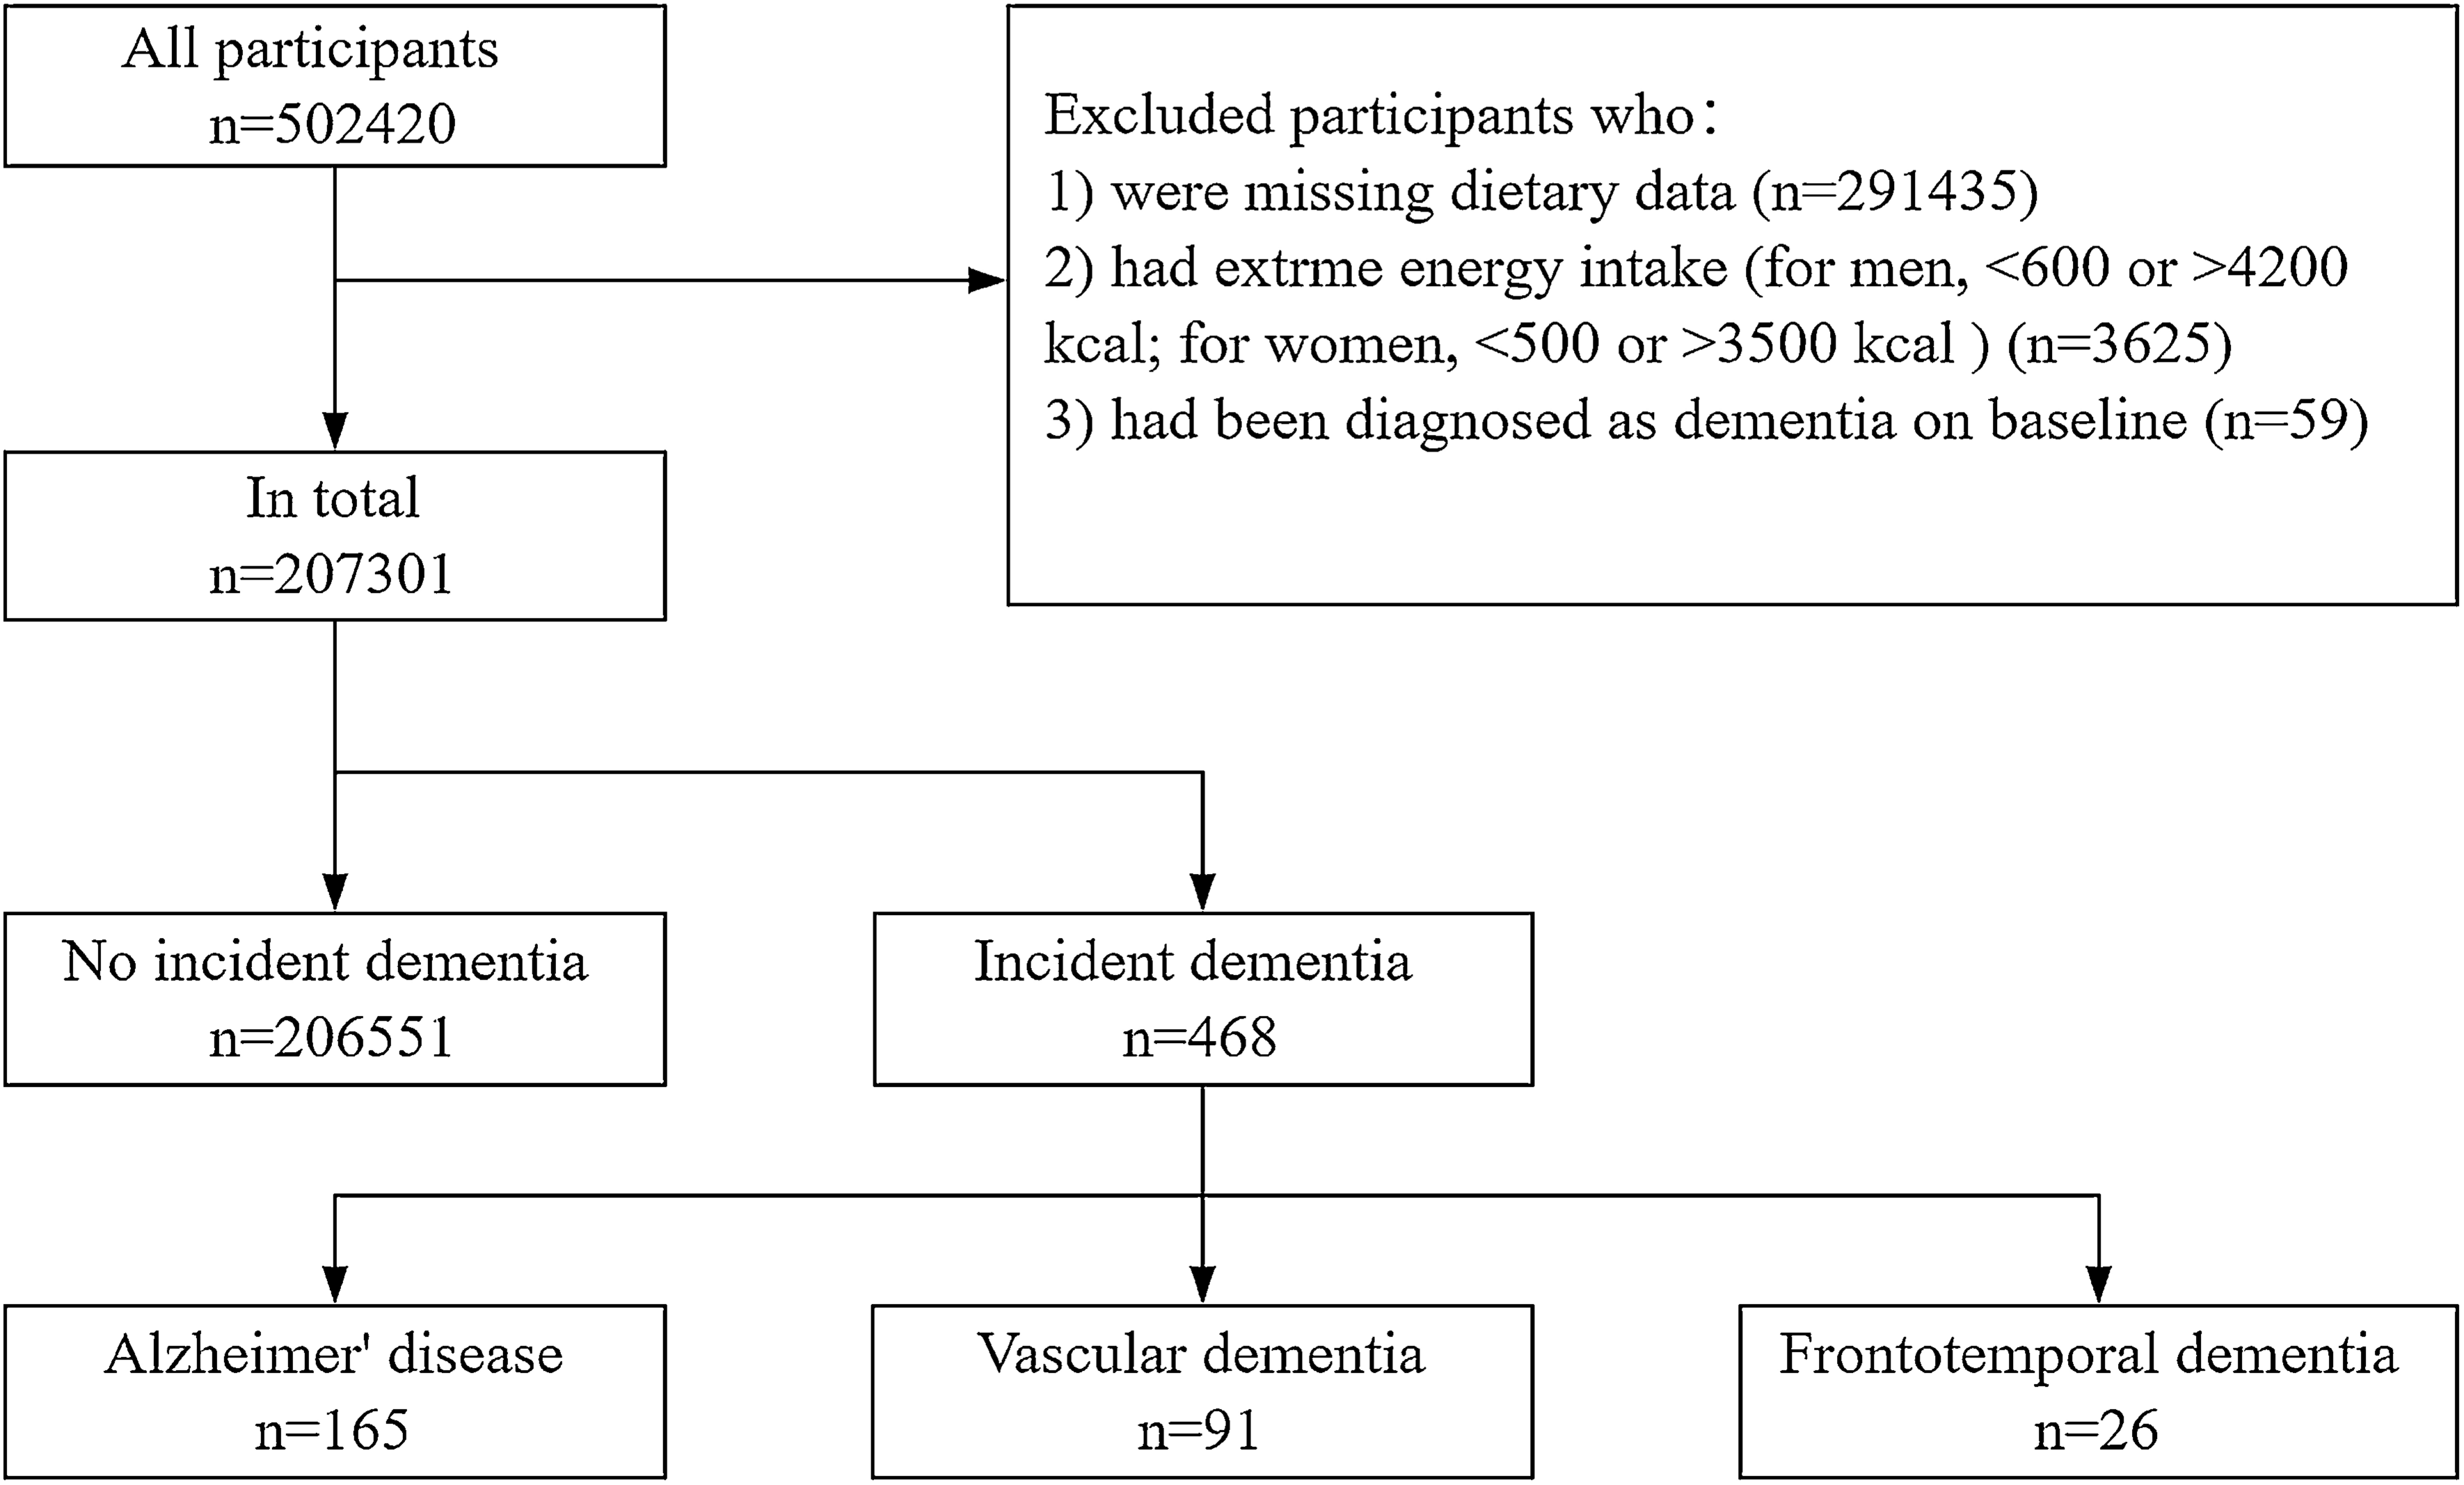
Fig. 1
Flowchart of participants selection. FDG-PET fluorodeoxyglucose positron emission tomography, ASL arterial spin labeling, HC healthy controls, AE autoimmune encephalitis, AE-PS autoimmune encephalitis with psychiatric symptoms, AE-WPS autoimmune encephalitis without psychiatric symptoms
Healthy controlsA group of 39 healthy, age- and sex-matched participants were enrolled from the FDG-PET database of Beijing Tiantan Hospital. Ten of them were selected as healthy controls for ASL MRI analysis. The healthy control group had no history of neuropsychiatric disease, including, but not limited to, underlying brain injury, stroke, brain tumors, dementia, Parkinsonism, ataxia, epilepsy, and multiple sclerosis.
18F-FDG-PET and ASL MRIPET images were acquired using a PET/CT scanner (Elite Discovery, GE HealthCare, USA) with a matrix size of 192 × 192 and a slice thickness of 3.27 mm. Patients fasted for at least 6 h and their serum glucose levels were maintained below 8 mmol/L. Patients were administered an intravenous injection of 310 MBq/70 kg of body weight of 18F-FDG. PET data reconstruction was performed using the ordered subset expectation maximization (OSEM) algorithm.
ASL scans were acquired using the 3D pseudo-continuous arterial spin labeling technique on a 3 T Siemens Magnetom Prisma MRI scanner (Siemens Healthineers, Germany) with a 64-channel head coil. No contrast agents were used, and patients were required to be stable during scanning. The scanning parameters were as follows: repetition time (TR) = 4705 ms; echo time (TE) = 11.2 ms; field of view (FOV) = 128 × 128 mm; number of excitations (NEX) = 1; 30 × 4.0 mm axial sections with whole brain coverage; scan duration, 6 min and 14 s.
Image analysisAfter the acquisition of 18F-FDG-PET and ASL images, all data were processed using MATLAB 2019b software with statistical parametric mapping 12 (SPM12) software. The cingulate gyrus, including the anterior cingulate cortex (ACC), the midcingulate cortex (MCC), and the posterior cingulate cortex (PCC), was selected as ROI based on the Montreal Neurological Institute (MNI) template, which was subsequently transformed into masks.
PET data preprocessing steps were as follows: first, the PET images were spatially normalized into MNI atlas anatomical space following a 12-parameter affine transformation and nonlinear transformations. This yielded images of 2 mm × 2 mm × 2 mm voxels. Next, to enhance the signal-to-noise ratio, the default SPM smoothing was applied using an 8-mm Gaussian kernel. Finally, the ratio of the standardized uptake value (SUVR) was calculated from the voxel size-weighted median FDG uptake within selected ROIs, normalized to the cerebellum.
After conducting preliminary analyses on FDG-PET data, we focused on ASL data for subsequent analyses. The relative cerebral blood flow (rCBF) values of all selected ROIs were calculated from the CBF map of ASL, which represents the ratio of ROI to the cerebellum. To identify the metabolism and perfusion changes in the cingulate cortex, statistical analyses were performed with a one-way analysis of variance (one-way ANOVA) to compare patients and the control group, followed by Tukey’s multiple comparisons test. SUVR data were compared between groups of different psychiatric prognoses using a t test, while the rCBF was not analyzed because of the small sample size.
Statistical analysisIn this study, we employed several methods for data analysis. Continuous variables are reported as the median (interquartile range; IQR). Categorical variables are presented as frequencies with corresponding percentages. We compared groups (patients with psychiatric symptoms and patients without psychiatric symptoms) using a t test for continuous variables that were normally distributed (calculated with the Shapiro–Wilk test), Mann–Whitney U tests for non-parametric data, and c2 tests or Fisher’s exact tests for categorical variables. The differences in metabolism and perfusion among the three groups were analyzed using one-way ANOVA and the Tukey test for multiple comparisons. Clinical variables were comprehensively collected for possible inclusion in the risk model of psychiatric prognosis. We used binary logistic regression to assess independent risk factors associated with AE with a long-term poor psychiatric prognosis. Then all variables with p < 0.2 in the univariate analysis were included in the multivariable logistic regression model. Subsequently, the likelihood ratio test was used in a backward elimination process (p < 0.05 to retain, p > 0.1 to remove) to select the final set of independent risk factors for inclusion in the model. The odds ratio (OR) with a 95% confidence interval (CI) was presented for the logistic regression model. A two-sided p < 0.05 was considered to indicate statistical significance. SPSS 22.0 software package (IBM Corp., Armonk, New York, USA) and Prism 8 (GraphPad Software, CA, USA) were used for statistical analyses.
Comments (0)