
Remember me

In this study, we hypothesized that imVR rehabilitation for patients with subacute stroke would augment UE motor recovery compared to conventional therapy and that this improvement would correlate with brain neurophysiological change. To assess these hypotheses, we enrolled 40 patients in a single-blind, parallel-group, and randomized trial, during which resting-state functional MRI (RS-fMRI) was used to investigate neuroplasticity resulting from rehabilitation [17] and the relationship between changes in brain functional connectivity and recovery of UE motor performance was explored afterward.
Ethical procedureThis study was performed at the Second Affiliated Hospital and Yuying Children’s Hospital of Wenzhou Medical University, China from March 2017 to July 2021. The study was approved by the Institutional Review Board of the Hospital (No. 2017LCKY-09) and all participants provided written informed consent. The clinical trial was registered at ClinicalTrials.gov (NCT03086889) and its original study protocol has been published in [18].
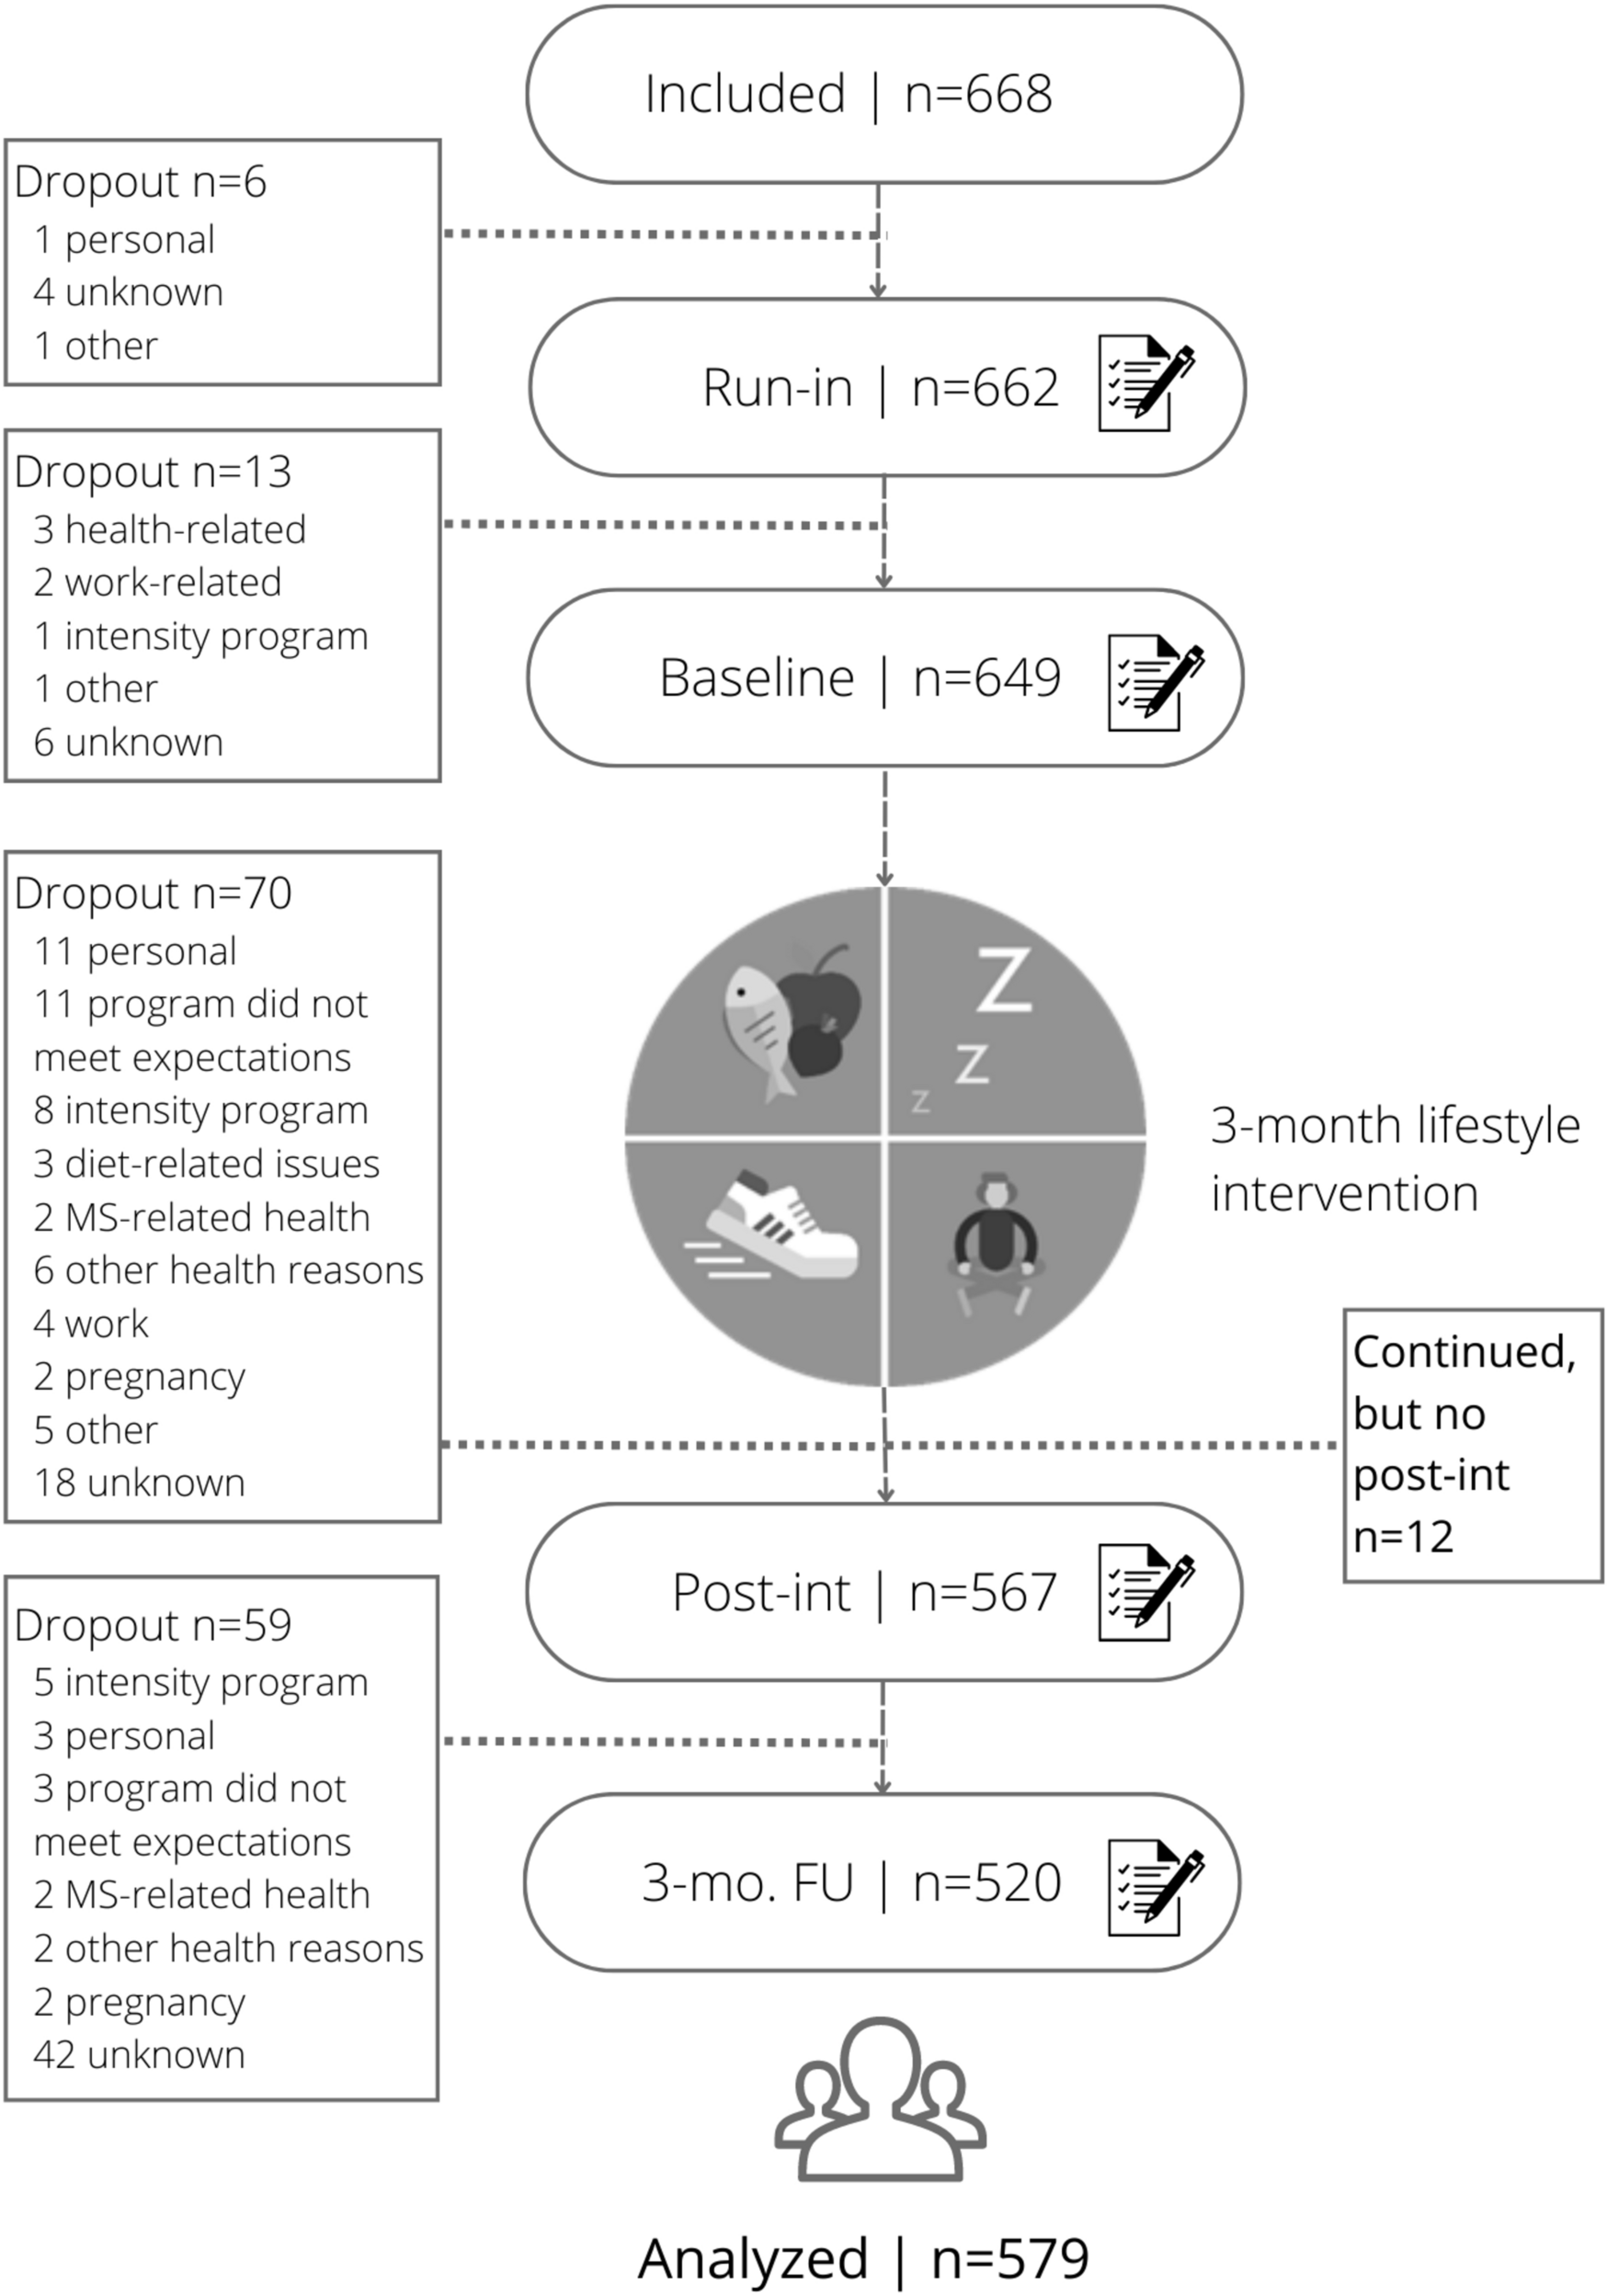
Subject enrollment and allocationAs shown in Fig. 1, 85 stroke patients with subcortical lesions in their subacute stage were screened, and 40 subjects were enrolled. The enrolled subjects were randomly evenly allocated into a new rehabilitation treatment with an imVR system (imVR group) or a conventional treatment program (Control group). Each subject was randomly assigned a code based on computer-generated, permuted block randomization with a block size of 4. Because of the nature of the intervention, subjects and therapists could not be blinded to the allocated treatment. These therapists did not participate in assessments of the outcomes. Demographic and baseline clinical characteristics and the largest area of lesion of both groups are summarized in Table 1 and marked by a yellow arrow in Supplementary Fig. 1.
Fig. 1
CONSORT diagram of study enrollment. imVR immersive virtual reality, ITT intention to treat, PP per-protocol
Table 1 Demographic and baseline clinical characteristics of enrolled 40 subjectsInclusion and exclusion criteriaThe inclusion criteria were as follows: to be eligible, subjects must (1) be over 30 but less than 85 years old; (2) have had their first stroke within the past month; (3) be in the subacute stage with a subcortical lesion location including the basal ganglia, internal capsule, corona radiata or brainstem; and (4) have a starting upper-limb function of Brunnstrom stage II–IV. The exclusion criteria were as follows: (1) history of transient ischemic attack (TIA); (2) failure of critical organs, such as heart, lung, liver, and kidney; (3) previous history of brain neurosurgery or epilepsy; (4) severe cognitive impairments or aphasia (incapable of understanding the instructions given by therapists); (5) not suitable for an MRI scan; and (6) enrollment in another clinical trial involving physical therapy or an investigational drug.
Intervention designSubjects received assessments at three-time points: immediately after randomization (baseline, week 0), immediately following the conclusion of the randomized rehabilitation program (post-intervention, week 3), and follow-up 12 weeks after concluding the rehabilitation program (follow-up, week 15). The assessments include MRI scans and evaluations performed by assessors who were blinded to group allocation in the whole study and with at least 2-years of experience in physical therapy.
Subjects in the Control received a 60-min conventional rehabilitation program per day. Conventional rehabilitation was designed with similar intensity and complexity to simulate the skills required in the immersive VR group. This conventional rehabilitation program consists of physical and occupational therapy, including grips and selective finger movements, gross movement, strength training, stretching, and training in activities of daily life. In contrast, subjects in the imVR received the first 30 min of conventional rehabilitation, and in the second 30 min, the rehabilitation was performed in imVR systems. The details of the imVR systems were introduced in [18]. Subjects in the imVR group were required to complete 6 programs (Supplementary Fig. 4): frying dumplings and noodles by controlling a wok handle in a virtual kitchen; popping balloons by controlling a sword in a virtual fencing hall; punching dolls by controlling a big fist in a virtual boxing arena; playing basketball in a virtual court, in which the ball is shot by a controller and the height and distance is varied over time; collecting eggs into a virtual basket by a controller; and tidying up a desk and moving objects to a designated position in a virtual office. All subjects received rehabilitation training 5 days per week over 3 weeks.
In the early stages of rehabilitation, due to the poor function of the hemiplegic side upper limb, subjects had to complete the imVR programs with the help of the limb on the unaffected side. With the recovery of the hemiplegic side upper limb function, the subjects independently completed the 6 games with only their limb on the hemiplegic side.
OutcomesThe upper extremity portion of the Fugl-Meyer assessment (FMA-UE) [20] and the Barthel Index (BI) [21] were the primary and secondary outcome measures for this trial, respectively. The FMA-UE, which measures arm movement ability across several domains (motor function, balance, sensation, range of motion, and pain), is a standard clinical tool for evaluating changes in motor impairment after stroke. The BI measures activities of daily living (ADL), consisting of feeding, grooming, bathing, bowel control, chair transfer, bladder control, toileting, dressing, ambulation, and stair climbing. RS-fMRI was an additional outcome measure. Degree, a derivative parameter derived from brain functional connectivity (FC), was used to assess neurobiological correlates of imVR-based rehabilitation and to relate changes in brain activity to motor recovery.
MRI data acquisitionAll subjects were scanned on a 3.0 T GE-Discovery 750 scanner with the following parameters: for anatomical T1-MRI data: TR/TE = 7.7/3.4 ms, flip angle = 12°, FOV = 256 × 256 mm2, resolution = 256 × 256, number of slices = 176, isometric voxel size = 1 × 1 × 1 mm3; for fMRI data: TE/TR = 30/2500 ms with interleaved ordering, voxel size = 3.4375 × 3.4375 × 3.5 mm3, in-plane resolution = 64 × 64, number of volumes = 230, and flip angle = 90°.
RS-fMRI data quality control, preprocessing, and registrationMean framewise displacement (mFD) of each RS-fMRI data set, calculated as the sum of mean displacement along 6 dimensions, indicating the extent of head motion over the duration of the scan, was used as a metric for quality control of RS-fMRI data and a covariate in the further statistical analysis.
A similar preprocessing pipeline to [22] was applied to all RS-fMRI data. Briefly: removal of the first four volumes (10 s) for magnetic field stabilization; motion correction; slice-time correction; intensity normalization; high-pass temporal filtering (0.008 Hz) for correcting low-frequency signal drift; nuisance regression of 6 motion vectors, signal-averaged overall voxels of the eroded white matter and ventricle regions, and global signal of the whole brain; motion-volume censoring by detecting volumes with an FD larger than 0.5 mm, Derivative Variance Root mean Square after Z normalization larger than 2.3, and standard deviation after Z normalization larger than 2.3, and scrubbing above detected (volume = i) and adjacent four volumes (i − 2, i − 1, i + 1, i + 2) [23, 24]; band-pass filtering (0.008–0.1 Hz) by applying a 4th-order Butterworth filter.
All pre-processed RS-fMRI data were registered to the MNI152 template using a two-step procedure, in which the mean of preprocessed fMRI data was registered with a 7-degree-of-freedom affine transformation to its corresponding T1 brain (FLIRT); transformation parameters were computed by nonlinearly registering individual T1 brain to the MNI152 template (FNIRT). Combining the two transformations by multiplying the matrices yielded transformation parameters to normalize the pre-processed fMRI data to the standard space. All the final registered images were manually examined.
After the registration, for those subjects who had left-sided lesions, the registered images were flipped from left to right along the midsagittal line. In the end, the right side corresponded to the ipsilesional hemisphere.
Resting-state functional connectivity networkFor each subject, their RS brain functional connectivity networks (FCN) across gray matter were generated. First, the blood oxygenation level-dependent (BOLD) signal was extracted from each gray matter voxel in the preprocessed and registered RS-fMRI data. Following this, we calculated voxel-based pairwise Pearson correlation coefficients of BOLD signals to construct a correlation matrix, which was then Fisher’s z transformed. To normalize the variation of the strength of brain FCN across individuals, a link density—the percentage of links with respect to the maximum number of possible links—was predetermined, corresponding to a correlation threshold [25, 26]. In our study, 10% link density was applied. Consequently, an indirectly connected brain FCN was generated after the correlation matrix was binarized by the subject-dependent threshold to create an adjacency matrix.
Degree comparison and associations between changes in degree and motor recoveryDerived from the brain FCN, one of brain network topological measurements, degree—a measure of network hubness [27], was used to investigate the effect of imVR rehabilitation training on brain FCN. For each voxel on the gray matter, its degree equals the number of links to the other gray matter voxels except those within two adjacent voxels to mitigate the effects of motion [28, 29]. This voxel-wise degree indicates the relative strength of local neural activity within a subject’s brain FCN.
To compare degree maps between the imVR and the Control groups, we used a general linear model (GLM) with the degree at post-intervention and at follow-up, respectively, as the dependent variable, the two groups as the independent variable, baseline degree, age, sex, side of brain lesion, time since stroke, hypertension, diabetes, and mFD as confounds; family-wise cluster correction (t > 3.5, P < 0.01) [30] was applied afterward.
For each statistically significant cluster between the imVR and the Control, we compared the average degree count extracted from the cluster and correlated changes in the average degree with the recovery of UE motor performance.
Network reorganizationAfter identifying brain clusters that statistically significantly differed between the imVR and the Control groups, we explored to which regions these significant clusters connected and if these connected regions were also statistically significantly different (reorganized) between groups. The analysis was run in network (module) space, spanned by 333 cortical parcels defined in [31] and 16 in-house-defined subcortical regions (total 349 regions), from which 13 functional networks are constructed: visual, auditory, default-mode, cingulo-opercular task control, fronto-parietal task control, sensory/somatomotor mouth, sensory/somatomotor hand, dorsal attention, ventral attention, subcortex, salience, cinguloparietal, retrosplenial temporal [31]. For each subject, the status of functional connectivity between each significant cluster and the 349 parcels (regions) was set to as “connected” if their correlation coefficients were greater than the subject-dependent threshold (expounded in Resting-state functional connectivity network) or “disconnected” if less, generating a vector of 349 connection status. Chi-squared test was independently applied to each parcel to determine if there existed a statistically significant difference in connection status between the imVR and the Control groups (P < 0.05). The results were reported in circular plots.
Statistical and data analysesIn our previous sample size calculation [18], we estimated that 30 subjects per group would be sufficient to assess the effectiveness of the imVR training given a two-tailed comparison and set the type I error rate at 0.05 with 80% power and effect size of 0.75. In our protocol, one interim analysis was planned after 60% of subjects completed the post-intervention. If the P value corresponding to the effectiveness of the imVR (FMA-UE) was less than 0.025, the trial would be terminated earlier. We had the interim analysis when the number of subjects per group reached 20 and found the P value is 0.019 (Table 2) so the recruitment stopped earlier.
Table 2 Outcomes at Baseline, Post-intervention, and Follow-up by GroupsBoth intention-to-treat (ITT) and per-protocol (PP) analyses were performed to assess the effectiveness of the trial. The ITT analysis was conducted with all randomly assigned participants included in the analysis, applying the Markov Chain Monte Carlo method with linear regression (only FMA-UEs or BIs as predictors in the model) for the imputation of any missing value (20 subjects in imVR vs. 20 subjects in Control). The PP analysis included participants who had at least a 2-week long intervention (18 vs. 18 post-intervention and 14 vs. 14 follow-up).
This randomized controlled trial is a two-group independent design examining the effects of imVR on the rehabilitation of patients with subacute stroke and the assessments were repeated three times. We were interested in the change of outcomes (i.e., recovery) between the two groups. So, for both the FMA-UE/BI, a one-way analysis of covariance (ANCOVA) model was used, with the FMA-UE/BI at post-intervention or at follow-up, respectively, as the dependent variable, the two groups as the independent variable, baseline FMA-UE/BI, age, sex, site, time since onset, hypertension and diabetes as covariates. P < 0.05 was statistically significant.
To investigate the effects of imVR on brain activity both at post-intervention and the follow-up, for each time point the GLM model was applied with a degree as the dependent variable, two groups as the independent variable, base-line degree, age, sex, site, time since onset, hypertension, diabetes, and log(mFD) as covariates; cluster-correction was performed afterward (t > 3.5, P < 0.01) [30].
Pearson correlations were performed to examine how mean degree, extracted from the significant cluster, tracks with changes of outcomes (FMA-UE or BI) using (1) post-intervention and baseline and (2) follow-up and baseline, respectively. P < 0.05 was statistically significant.
Independent t tests and Mann–Whitney U tests were employed to compare outcomes that did and did not meet residual normality assumptions, respectively, between the two groups. The Chi-square test was used to compare categorical outcomes.
A mixed effects model was used to assess the significance of difference in brain motion during scanning, represented by log(mFD), across three assessments between the imVR and the Control groups. P < 0.05 was statistically significant.
Comments (0)