
Remember me
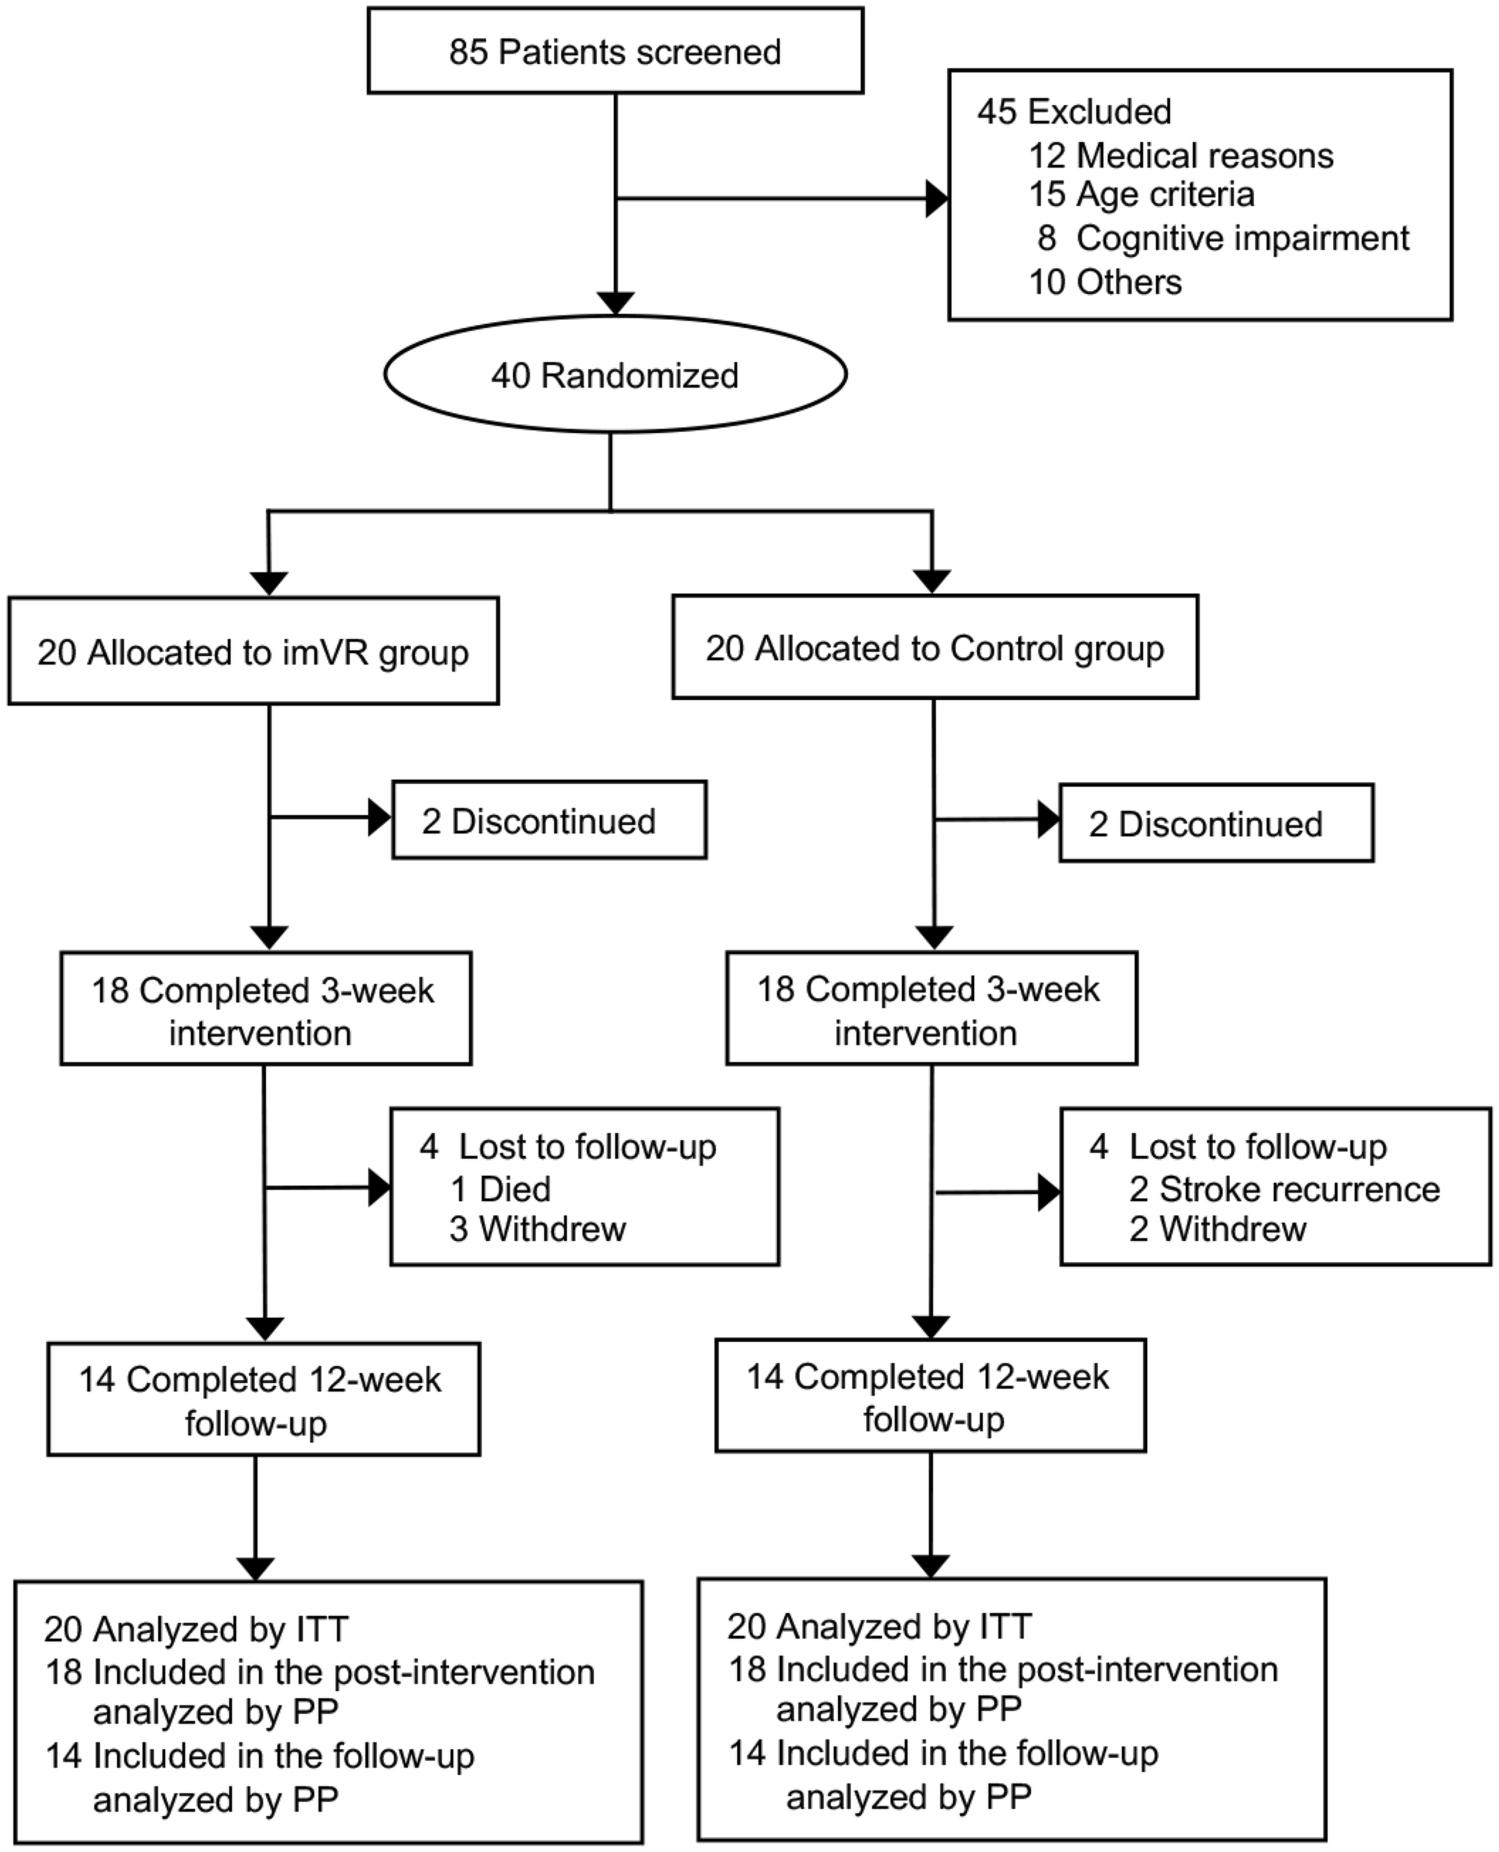
In total, 17 patients with genetically confirmed CMT1A were recruited (6 males, 11 females). The mean age at assessment was 55.8 ± 2.8 years with mean BMI being 25.8 ± 1.1. The CMT neuropathy score was 18.1 ± 1.6 (range 8–30), indicating the presence of moderately severe neuropathy, with accompanying mild–moderate muscle weakness, moderate sensory loss, and imbalance (Table 2).
Table 2 Clinical features and tremor findingsUpper limb tremorPostural and kinetic upper limb tremor was clinically evident in 65% of CMT1A patients, rated as mild as per the TETRAS score (range 3–16). Moderate-severe tremor was seen in 18% (TETRAS score range 31–34), which included tremor intruding into rest, although no patient had features of Parkinson’s disease. Quality of life was reduced in those with tremor as indicated by a significantly higher QUEST Summary Index (QSITremor 9 (7–30), QSINoTremor 1 (0–5), P = 0.018).
In the upper limbs, a postural tremor of 9 Hz was observed in the deltoid, arm, and forearm regions, while the distal segments (abductor pollicis brevis muscle and index finger accelerometer) showed a peak at 6 Hz (Table 2, Supplementary Fig. 1a). The index finger peak frequency was significantly lower than the deltoid (P = 0.012) and arm (P = 0.011) regions (Supplementary Fig. 1c). Action tremor recorded from the index finger exhibited comparable peak frequencies to the postural tremor (Index fingerPosture 6.7 ± 0.5 Hz, Index fingerAction 6.3 ± 0.6 Hz, P = 0.783). When present, rest tremor frequency recorded at the index finger was 5.6 ± 0.4 Hz, comparable to index finger frequencies in posture and action (P = 0.789). There was no significant change in the tremor frequency with limb loading (Table 3). Additionally, peak spectral frequencies in the first and second half of the tremor recordings were comparable, arguing against an impact of limb fatigue (Table 3).
Table 3 Tremor characteristicsComparing CMT1A patients with and without tremor, there were no significant differences in clinical features including CMT neuropathy score and MRC sum score (Table 3) implying complex interactions between neuropathy findings and tremor generation not captured by these clinical scales. Linear regression modelling disclosed a significant correlation between peak frequency recorded in the forearm region and median nerve motor conduction velocity (beta = − 0.34, P = 0.021, average median conduction velocity 27.0 ± 2.9 m/s, range 11.4–42.5 m/s). The index finger accelerometry was also significantly correlated with median nerve velocity (beta = − 0.14, P = 0.004) and ulnar nerve F-wave latency (beta = 0.10, P = 0.017), suggesting that tremor frequency is associated with peripheral nerve conduction delay.
Tremor stability indexThe tremor stability index was elevated in the “arms outstretched” and “nose-targeting” positions. The TSI was significantly higher in CMT1A patients when compared to ET (CMTArms Out 2.1 ± 0.2, ETArms Out 1.4 ± 0.2, P = 0.007; CMTNose 1.8 ± 0.2, ETNose 1.1 ± 0.2, P = 0.010, Fig. 1), but comparable to a recently published cohort with CIDP [10] (Arms Out 2.3 ± 0.1, P = 0.312, Nose 2.0 ± 0.2, P = 0.578).
Fig. 1
Tremor stability index. The tremor stability index was significantly higher in CMT1A patients in comparison to Essential Tremor patients in the arms outstretched and nose targeting positions
Lower limb tremorLower limb tremor was clinically evident in 35% of CMT1A patients with legs outstretched (Supplementary Fig. 1b). Subclinical orthostatic tremor was also observed in 35% of patients, and 12% of the cohort were found to have both postural and orthostatic lower limb tremor. Lower limb tremor was of lower frequency than upper limb tremor (Table 2), and there was no change in frequencies along the length of the lower limb (P = 0.135, Supplementary Fig. 1d, e). As in the upper limb, there was no difference between the first and second periods of tremor recordings (Table 2), arguing against a significant effect of fatigue.
A significant reduction in the Berg Balance Scale was evident in CMT1A patients that had a lower limb tremor (Tremor: 31.5 (16.5–46.5), No Tremor: 53 (49–55.5), P = 0.030, Table 3), while other demographic and clinical features were comparable (Table 3). Of relevance, MRC sum score, ankle power, and vibration sense were not significantly different between those with and without tremor (Table 3). Notably, lower limb nerve conduction studies were very reduced or absent in all but one patient with tremor, and all but two patients without tremor, which limited meaningful statistical analysis.
BalanceThe sway path and area were significantly elevated in CMT1A patients when assessed in the ‘eyes closed’ position (Fig. 2a), indicating a reliance on the visual system to maintain balance. The sway path was significantly correlated with the 10-m walk time (R = 0.54, P = 0.045) and the Berg Balance Score (BBS) (R = − 0.58, P = 0.030).
Fig. 2
Posturography findings. Panel A: The sway path and sway area were significantly higher in the eyes closed conditions. Panel B: The CMT neuropathy scale and NIS-LL scales were both higher, indicating more severe neuropathy, in those with ‘poor’ balance. Panel C: A representative Fast Fourier Transform of the force applied through the platform in the vertical axis, demonstrating a peak around 16 Hz, which was only evident in those with ‘good’ balance. Panel D: Those with a high frequency peak as in Panel C had significantly higher Berg Balance Scale scores. N Newtons; Hz Hertz. mm millimeters; cm centimeters; * = P < 0.05; ** = P < 0.01, ***P < 0.001
In CMT1A patients exhibiting ‘poor’ balance (BBS ≤ 42), the ankle power score was significantly reduced (‘good’ balance 20 (16–20), ‘poor’ balance 9 (4–15), P = 0.014). Further, the degree of neuropathy was more severe, as measured by clinical scales, in those with ‘poor’ balance (Fig. 2b).
The presence of postural lower limb tremor was associated with greater difficulty in completing the balance conditions. None of the patients with postural lower limb tremor could complete tandem stance while 75% of those without tremor could complete all conditions (P = 0.009). Multiple regression analysis found that the presence of lower limb postural tremor significantly associated with fewer balance conditions being completed (β = − 2.20, SE = 0.90, t = − 2.44, p = 0.031) independent of other variables.
In contrast, orthostatic tremor was more common in patients exhibiting ‘good’ balance (45%) than in ‘poor’ balance (17%), although this difference did not reach statistical significance (P = 0.235). Surprisingly, there were no significant differences in the sway path or sway area between patients with and without lower limb tremor (Supplementary Table 1).
The mean peak frequency of sway was 0.85 ± 0.1 Hz, similar to previously reported healthy controls [33], and did not differ between patients with and without lower limb tremor (Supplementary Table 1) nor in those with ‘good’ and ‘poor’ balance. The force exerted in the vertical plane was 4.3 ± 0.3 Hz across all conditions, similar to acquired demyelinating neuropathies [18]. Interestingly, a high frequency peak was observed in the vertical plane in 35% of patients, with median frequency of 17.1 Hz (15.8–17.4) (Fig. 2c), only evident in CMT1A patients with ‘good’ balance and none of the patients with ‘poor’ balance. The Berg Balance Scale was also significantly higher in those with a high frequency peak on posturography in comparison to those without a high frequency peak (Fig. 2d).
Comments (0)