
Remember me

An economic evaluation was conducted using a hybrid model structure consisting of (1) a decision tree to map the clinical diagnostic and treatment pathway, consisting of the proportion of patients with local, regional, distant, or no disease; PSA ≤ 1.0 or > 1.0; and testing accuracy of the imaging modalities; and (2) a Markov model to predict the long-term outcomes of disease progression associated with the different treatment decisions (Fig. 1). The analysis was conducted from a US payer’s perspective over a lifetime horizon; the population reflects a mix of commercial and Medicare payers. Two time points were considered: initial diagnosis and BCR. Separate sets of inputs for the distribution of PSA levels (> 1.0 vs ≤ 1.0) and disease states (e.g., local, regional) were obtained for each time point, which in turn affected the detection rates (i.e., inputs corresponded to PSA levels) and treatment effectiveness (i.e., inputs corresponded to transitions between disease states) at each time point (Tables 1, 2, 3). This is in accordance with findings that sensitivity and specificity differ between PSA levels, disease states, and time points [19]. The use of piflufolastat F 18 among patients for the initial staging and diagnosis of prostate cancer, as well as the detection and staging of recurrent prostate cancer, was modeled. The imaging modalities compared with piflufolastat F 18 were fluciclovine F 18, PSMA 11, and SOC imaging (MRI, bone scan, and CT [equally weighted]). A half-cycle correction was applied in the model to the proportions of patients in each disease state; costs and utilities were applied to these adjusted proportions and did not have a separate half-cycle correction.
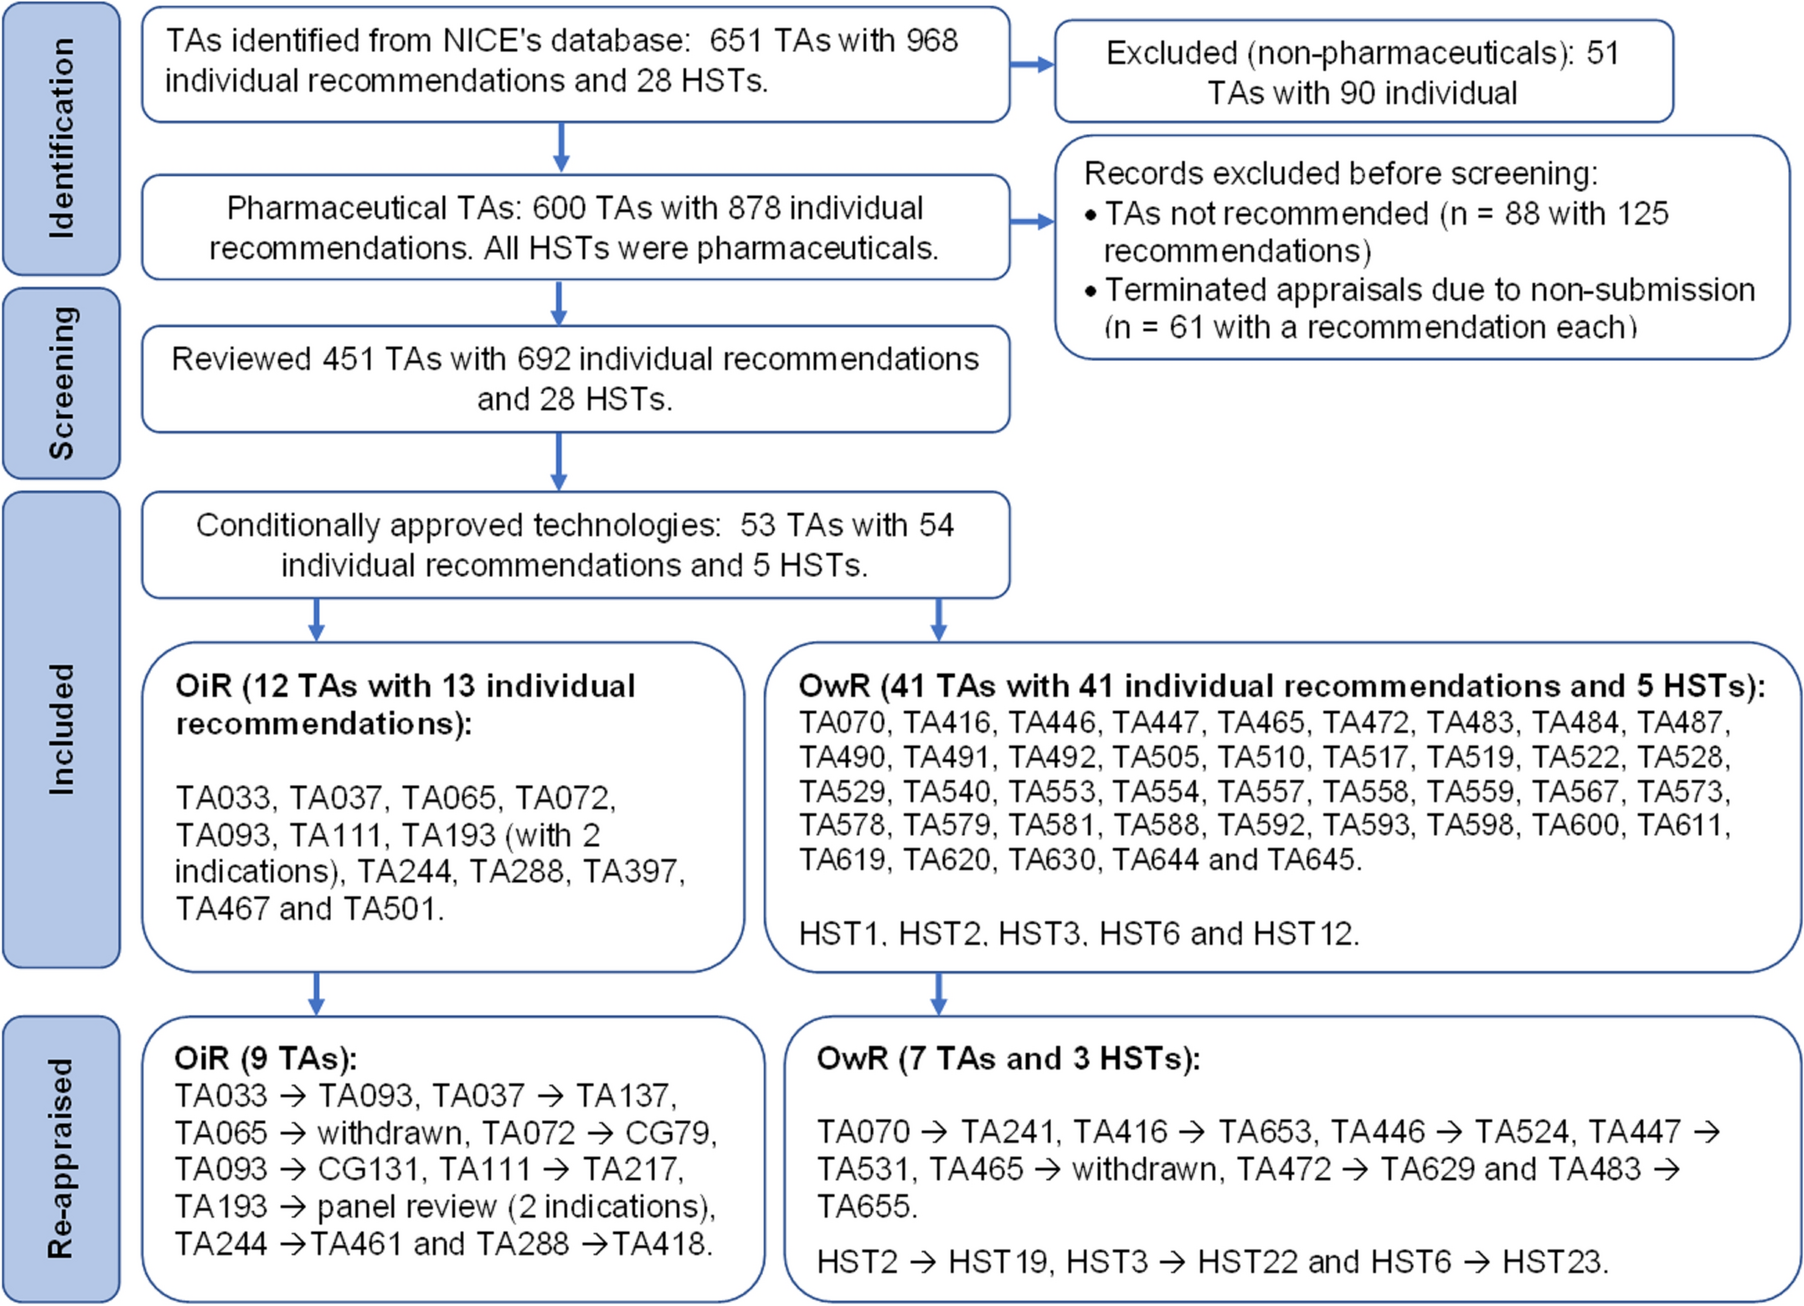
Fig. 1
Model schema. FN false negative, FP false positive, PSA prostate-specific antigen, TN true negative, TP true positive
Table 1 Key model inputs in the decision tree for the base case and PSATable 2 Key model inputs in the Markov model for the base case and probabilistic sensitivity analysisTable 3 Test performance inputs in populations with different PSA levels2.2 Decision TreeThe decision tree captured the diagnostic pathway and was first separated by true disease status, including local, regional, distant, or no prostate cancer (Fig. 1a). Within each disease status, patients were stratified by PSA level ≤ or > 1.0 due to different imaging test performance in these groups. Alternative diagnostic outcomes were assigned probabilities based on true disease status. For example, if the true disease status was local prostate cancer, the decision tree predicted the number of individuals who would be correctly confirmed as having local prostate cancer (true positive) or incorrectly found to have no prostate cancer (false negative). In contrast, if the true disease status was no prostate cancer, the decision tree predicted the number of individuals who would be correctly confirmed as having no prostate cancer (true negative) or incorrectly found to have prostate cancer (false positive). Patients with each type of diagnosis were assigned to different treatment strategies. In particular, patients with a false negative or a false positive were treated for a 12-month period according to the disease state they were falsely assumed to be in (e.g., false-negative patients with distant disease were treated as if they had regional disease; false negative patients with regional disease were treated as if they had local disease, and false negative patients with local disease were treated as if they had no disease), after which they received treatment appropriate to their true disease state without incurring additional diagnostic costs.
2.3 Markov ModelThe Markov model tracked the transition of patients with the assigned treatment strategies based on their diagnosis, and simulated patients’ progression through various states of prostate cancer until death. Patients were categorized into and transitioned through the following health states: no prostate cancer (only for recurrence diagnosis), local, regional, and distant prostate cancer. The transitions were modeled over monthly cycles, and healthcare costs and outcomes of prostate cancer management are accumulated over a lifetime horizon. All-cause and prostate cancer-specific mortality was also modeled. After a patient had been diagnosed with prostate cancer, they would be treated with a designated therapy based on the decision tree which would impact their progression through the model from their initial health state. Transition probabilities across states were dependent upon the diagnostic pathways and the resulting treatment decisions made at the end of the decision tree.
2.4 Key AssumptionsSeveral key assumptions were included in the model. First, the distribution of health states and the distribution of PSA level by disease localization did not change by diagnostic method used. Second, test performance (sensitivity and specificity) was assumed not to vary by disease localization. Patients with more than one localization (e.g., lymph node-positive [N1M1]) were classified as the more severe case. Third, patients were assigned treatment based on test results. For true positives and true negatives, costs and QALYs were applied as appropriate. For false negatives (only for patients with actual disease), the costs for the lower stage of diagnosis and QALYs for no treatment at the current stage were applied. This assumed the patient was under-staged, so costs were applied but the QALYs reflected the worst case. For false positives (only for patients without disease), costs for the treatment of local disease were applied and QALYs for no disease were applied. This assumed that patients received unnecessary treatment costs and no benefit from treatment. Fourth, an incorrect diagnosis period of 12 months was assumed. Fifth, skipping states was not permitted in the Markov model (e.g., no path from local to distant), as data were not available to model these transitions. Sixth, as a simplifying assumption, BCR could only occur once in the model. Likewise, retesting following an incorrect diagnosis was not modeled (see Sect. 2.2). Lastly, prostate cancer-associated death could only be reached from the distant disease state.
2.5 Key Model InputsModel inputs were obtained through a targeted literature review using PubMed. Search terms included ‘prostate cancer’ for prostate cancer-specific inputs; the various terms for the specific radiotracers for testing accuracy inputs (e.g., for PSMA 11, including both ‘gallium68-PSMA-11’ and ‘68Ga-PSMA-11’); and ‘price,’ ‘cost,’ ‘utility,’ and ‘quality of life’ for cost and utility inputs, respectively. For clinical parameters, standalone studies, particularly randomized clinical trials, with higher sample sizes were preferred. For healthcare costs, US claims-based studies were preferred. For utilities, studies in a US setting, which provided a more complete set of utilities, were preferred.
2.5.1 Clinical ParametersIn the decision tree, clinical parameters included test performance stratified by PSA, disease state distribution, PSA distribution, and treatment assigned, as informed by clinical trials (see inputs listed in Table 1). Disease state distribution and PSA distribution probabilities were based on clinical study reports from the OSPREY and CONDOR clinical trials for piflufolastat F 18, which reported the PSA levels at baseline for each cohort [20, 21]. Inputs for treatment assignments at initial diagnosis were based on expert opinion—proportions were elicited during targeted one-on-one interviews with clinicians (see Acknowledgements). Treatment assignment at recurrence diagnosis was based on inputs for an economic model of fluciclovine F 18 for the staging of recurrent prostate cancer in the US, which retrospectively analyzed treatment plans for patients from the LOCATE (Localizing Occult prostate Cancer metastases with Advanced imaging TEchniques) trial (ClinicalTrials.gov identifier: NCT02680041), an open-label, multicenter interventional trial for patients with BCR [22, 23].
In the Markov model, clinical parameters included transition (i.e., progression) probabilities, adverse event (AE) probabilities, and treatment efficacy, including the probability of cure at initial diagnosis (see inputs listed in Table 2). State transition probabilities were based on inputs for a microsimulation and a Markov model that each modeled the progression of prostate cancer, validated against data from the European Randomized Study of Screening for Prostate Cancer (ERSPC) and Surveillance Epidemiology End Results (SEER) data, respectively [24,25,26,27,28]. Probabilities of erectile dysfunction in radiation therapy, prostatectomy, and radiation therapy + androgen deprivation therapy (ADT), along with the probability of urinary incontinence in prostatectomy, were based on a cost-utility analysis of treatments for localized prostate cancer from a US payer perspective [29]. Probabilities of erectile function in ADT and cryotherapy were based on meta-analyses for these two respective treatments, while the probability of urinary incontinence in cryotherapy was based on a population-based study of men diagnosed with localized prostate cancer in a SEER-Medicare-linked database [30,31,32]. The treatment effectiveness of radiation therapy and radiation therapy + ADT was based on a retrospective cohort analysis of men undergoing prostatectomy who received salvage treatment with either radiation therapy alone or radiation therapy + ADT [33]. Treatment effectiveness of ADT and cryotherapy was based on a propensity score-matched analysis of men with prostate cancer treated with either ADT or cryotherapy [34]. The treatment effectiveness of prostatectomy was based on a multi-center study of men with radiation-recurrent prostate cancer treated with salvage radical prostatectomy [35]. Probabilities of cure at initial diagnosis, and of recurrence from cure of initial disease, were based on expert opinion, and elicited from one-on-one interviews with clinicians (see Acknowledgements).
The model inputs for diagnostic test performance (i.e., sensitivity and specificity) by PSA level (i.e., ≤ 1.0 or > 1.0) are detailed in Table 3. The sensitivities and specificities of piflufolastat F 18 were based on clinical study reports from the OSPREY clinical trial [20]. The sensitivities of fluciclovine F 18 were based on results from the FALCON trial of fluciclovine F 18 in men with BCR, while the specificities were based on results from the BED-001 study of patients who received at least one injection of fluciclovine F 18 for the detection of BCR [36, 37]. The sensitivities of PSMA 11 and CT were based on a retrospective single-site clinical audit comparing gallium68-PSMA PET/CT and standard CT imaging in patients with a rising PSA after definitive treatment for prostate cancer [38]. The sensitivities of SPECT were based on a single-center retrospective study comparing SPECT and F 18-choline PET/CT imaging in prostate cancer patients initially referred for F 18-choline PET/CT [39]. The specificities of PSMA 11 and MRI for PSA > 1.0 were based on a study that compared gallium68-PSMA-617 PET/CT and MRI in patients with suspected prostate cancer [40]. The sensitivity of MRI for PSA ≤ 1.0 was assumed to be the same as CT, while for PSA > 1.0 it was assumed to be + 5% above CT. The specificities of PSMA 11, MRI, SPECT, and CT for PSA ≤ 1.0 were assumed to be the same as fluciclovine F 18.
2.5.2 Healthcare CostsHealthcare cost categories included diagnostic strategies, prostate cancer treatment, and AE management (Tables 1 and 2). Costs per procedure for all imaging modalities (i.e., piflufolastat F 18, fluciclovine F 18, PSMA 11, MRI, SPECT, and CT) were based on Centers for Medicare & Medicaid Services (CMS) physician fee schedules and Average Wholesale Price Micromedex RED BOOK [41, 42]. Treatment costs for prostate cancer were based on inputs for an economic model of fluciclovine F 18 for the staging of recurrent prostate cancer in the US, which used claims from the Limited Data Set (LDS) comprised of a random sample of all Medicare claims that have fee-for-service coverage [22, 43]. AE costs for erectile dysfunction and urinary incontinence were based on a cost-utility analysis of treatments for localized prostate cancer from a US payer perspective [29]. Medical costs arising from healthcare resource utilization were based on claims studies using the Truven Health Analytics MarketScan® Commercial Claims and Encounters and Truven Health Analytics MarketScan® Medicare Supplemental and Coordination of Benefits database; along with the Premier Healthcare Database, a US hospital-based, all-payer database [44, 45]. All costs were reported in 2021 US dollars (USD) and discounted at 3% annually, in accordance with guidance for US-based studies [46]. Where required, the US Bureau of Labor Statistics Consumer Price Index for medical care services was used to inflate costs to 2021 values [47].
2.5.3 QALYsIn the estimation of QALYs, utilities were considered at each Markov model state; disutility related to AEs was also considered. The utility of having no disease was based on a study of US population norms elicited with the EQ-5D-5L, in which the median utility for subjects aged 65–74 years was 0.90, which overlaps with the median age of prostate cancer diagnosis, 67 years [48, 49]. Utilities for local, regional, and distant disease were based on values ascertained from a subject pool of men in the US aged 60 and older (52% having been diagnosed with prostate cancer), using a computer-based utility assessment program designed to elicit utility values for health states related to prostate cancer using a standard gamble task [50]. Utilities for erectile dysfunction and urinary incontinence were based on a cost-utility analysis of treatments for localized prostate cancer from a US payer perspective, which sourced utility values from the Tufts Medical Center Cost-Effectiveness Analysis Registry (CEAR) and validated them with an expert panel [29, 51]. The utility of death, either prostate cancer-related or by other causes, was assumed to be zero. An annual discount rate of 3% was applied, in accordance with guidance for US-based studies [46].
2.6 AnalysesThe outcomes of total healthcare costs, life-years (LY), and QALYs associated with each of the alternative imaging strategies were assessed. The incremental cost-effectiveness ratio (ICER) was calculated using the cost difference between two strategies, divided by the difference in QALYs. A strategy was considered cost effective relative to another strategy if the ICER was lower than a willingness-to pay (WTP) threshold of $150,000 USD per QALY. This WTP threshold of $150,000 was consistent with the upper range used as the standard for health-benefit price benchmarks by the Institute for Clinical and Economic Review [52]. The net monetary benefit of a given strategy was calculated by multiplying the WTP threshold by the total QALYs gained from using the strategy, then subtracting the total cost of the strategy.
2.6.1 Deterministic Sensitivity Analyses (DSA)In addition to the base-case analyses, DSA were conducted that varied the following parameters: starting PSA distribution for each true disease status; the sensitivity and specificity of the diagnostics; the cost of the diagnostics; the disease distribution of local, regional, and distant disease; the utilities of the disease states; and the probability of therapeutic cure at initial diagnosis from local and regional disease for all treatment options. All parameters were varied to match the lower and upper limits, respectively, of the 95% confidence intervals as determined by the parametric distributions used in the probability sensitivity analyses.
2.6.2 Probabilistic Sensitivity AnalysesProbabilistic sensitivity analyses were conducted in Excel to estimate uncertainty of the base-case results. A beta distribution was assigned for binary variables (test performance, utilities, transition probabilities in the Markov model, and cure probabilities), a gamma distribution was assigned to cost parameters, and a Dirichlet distribution was assigned for true disease distribution. The number of iterations was set to 500, based on convergences plots of the ICER when comparing piflufolastat F 18 with fluciclovine F 18, PSMA 11, and SOC imaging (i.e., CT, MRI, and SPECT) (Fig. S2). The variables were varied based on the standard error (SE) if available, or SE calculated from the confidence intervals if available; if the SE or confidence intervals were not available, and the parameter was a proportion (p), then SE would be estimated using sample size (N) using \(\sqrt }\); otherwise, SEs were assumed to be 15% of the mean (See Table S1 in the electronic supplementary material [ESM] for sources and values.)
2.7 Model ValidationThe methods and reporting are consistent with the Consolidated Health Economic Evaluation Reporting Standards (CHEERS) checklist [53] (Table S3, see ESM). Clinical experts (see Acknowledgements) reviewed the assumptions, model structure, and results. Extreme value testing was conducted for the following variable categories: disease state distribution, PSA distribution, test performance, treatment assignment, costs of diagnostics, transition probabilities, AE incidence rates, AE costs, impact of treatment (hazard rates), overall treatment costs, utilities, probability of curative therapy, and transition probabilities. Two versions of the core state transition model were coded independently in Excel to ensure that it was free of errors. Independent checks were done in the remaining Excel sheets to detect errors in formulas, and in Visual Basic for Applications (VBA) code to detect coding or logic errors.
Comments (0)