
Remember me
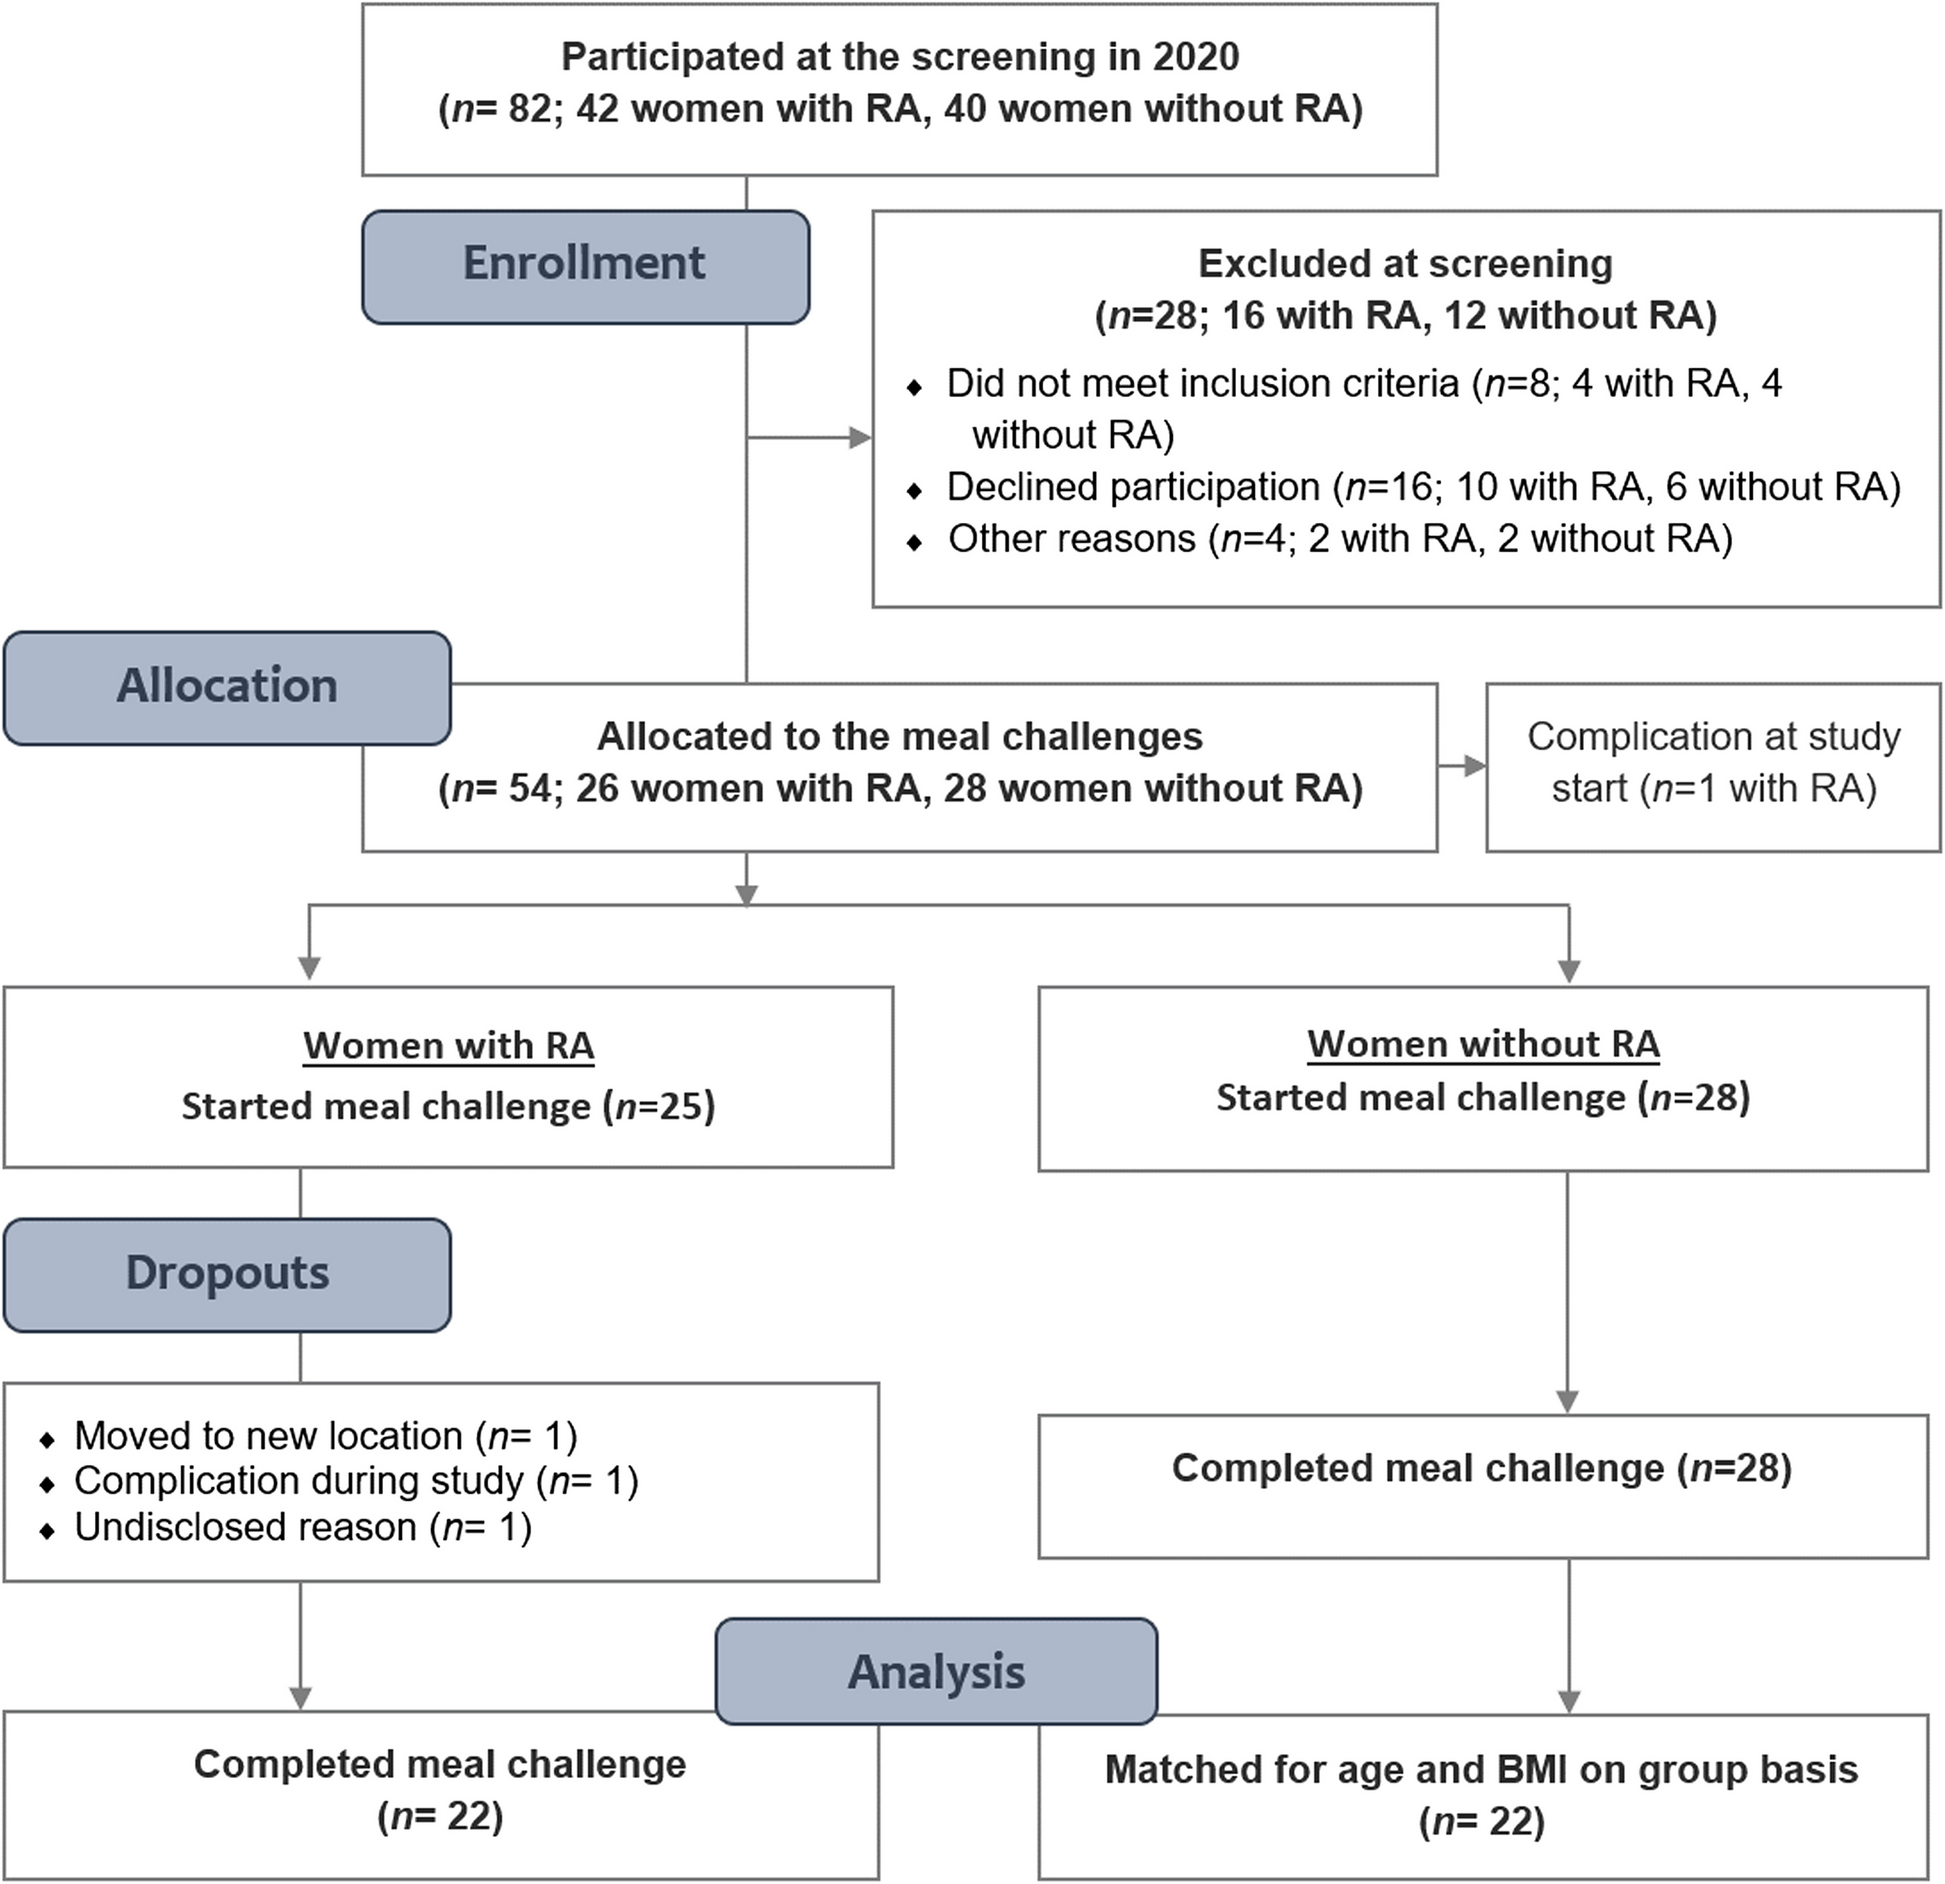


This was an observational follow-up study comparing adults with a history of previous hospital admission for SAM with community-living adult controls. Adults who were treated for SAM during childhood at Lwiro pediatric hospital (LPH) between 1988 and 2007, and still living in Miti-Murhesa and Katana Health zone (HZ) in 2018, were evaluated [38, 39]. A total of 1981 children were treated for SAM at LPH during the above period [39]. The nutritional status of study participants at the time of admission to hospital [37, 39, 40] was reassessed with the Emergency Nutrition Assessment (ENA) for SMART program (October 2007 version) based on WHO child growth’s standards [4]. Based on these standards, 1664 children were classified as having suffered from SAM [39]. The remainers were excluded from subsequent analyses. All children hospitalized for SAM were treated according to the guidelines used at that time [37]. For the initial group of follow up, 524 participants from the initial cohort still living in the two HZ were examined [38]. To assess long-term growth and health consequences of SAM, these survivors (SAM-exposed) were compared to 407 unexposed adult controls randomly-selected from the same community [38, 39].
The inclusion criteria for SAM-exposed individuals for this study were: to be at least 30 years of age, to have suffered for SAM before the age of 5 years, and to voluntarily agree to participate in the study.
In order to be included, unexposed controls should have the following characteristics: no hospital history of SAM, be of the same sex of the matched participants, live in the same community, and be less than 24 months older or younger than the exposed participants. Unexposed individuals were randomly selected by spinning a bottle at the exposed participant's home and enquiring door to door, starting from the nearest house towards which the bottle pointed [38, 39].
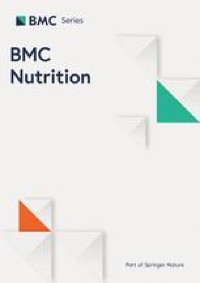
On the basis of these criteria, 97 former SAM-sufferers’ adults were included and formed the exposed group, and matched to 97 non-exposed adult controls from potential participants (524 exposed and 407 unexposed) (Fig. 1).
Fig. 1
Recruitment of exposed group
The study exclusion criteria were: breastfeeding women and those who identified themselves as pregnant (more than 3 months of amenorrhea or with visible pregnancy), and being followed for an infectious pathology or experiencing certain symptoms related to acute infectious pathologies (fevers, headaches, diarrhea, abdominal pain, flu syndrome, vomiting) over the previous two weeks.
VariablesDependant variablesOur main outcomes of interest were hematological disorders including primarily anemia, leukopenia, leukocytosis, thrombocytopenia as well as increased platelets in adulthood, assessed by standard biological measures (blood cells count and erythrocytes parameters). We evaluated the associations between exposure to SAM during childhood and levels of red blood cells [red blood cells (RBC), hemoglobin (Hb) as well as erythrocyte constants: mean corpuscular volume (MCV), mean corpuscular hemoglobin concentration (MCHC) and mean corpuscular hemoglobin content (MCH)], white blood cells [white blood cells (WBC) and leukocyte count (neutrophils, lymphocytes and eosinophils)] and platelets.
Anemia was defined as Hb<13.0 g/dL in men and <12.0 g/dL in women; leukopenia as WBC <3500 WBC/μL, while leukocytosis was defined as WBC >11,000 WBC/μL. Thrombocytosis was defined as a platelets count < 150,000/μL, whereas increased platelets was defined as >450,000/μL.
BMI (Body Mass Index) was calculated as weight/height2 (in kg/m2) and categorized into four categories: <18.5 = underweight, 18.5 to 24.9 = normal, 25 to 29.9 = overweight and ≥ 30.0 = obese.
Independent variablesFor hematological disorders and their different biological markers, the main exposure was a history of SAM in childhood. Lifestyle (food consumption) was added in the modelling as a potential confounder.
Food consumption frequency was evaluated using a diet diversity score (DDS) devised by the World Food Program (WFP) [29, 41, 42]. This score measures the dietary diversity of households, weighted by the frequency of consumption. The head of the household (often the mother) is asked how many days in the last seven days the household consumed any of the following 10 food groups (cereals, tubers, pulses, vegetables, fruit, meat/fish, milk/dairy, sugar, oil/fat, condiments). Next, the frequency of consumption of each food group was multiplied by its nutritional value, to yield a score per food group. Finally, the scores for each food group were added to obtain an overall score.
Based on this overall score, a subject was considered to have an inadequate, borderline or satisfactory diet if the score was between 0-28; 28.5-42 and >42, respectively [29, 42].
Data collectionData collection lasted approximately four months (August-November 2020) and was carried out in two stages by trained community health workers (CHWs). It was facilitated by the district authorities, the head nurses and community relays. The CHWs involved in data collection were the same people who had participated in the identification of subjects during the reconstitution of the exposure cohort [39].
The first step was a home visit. During these visits, the CHWs gave participants a questionnaire translated into Kiswahili, and took their anthropometric measurements. Participants were given an appointment at the nearest hospital for the second stage of data collection, within 48 hours. This second step consisted of obtaining a venous blood test by trained local nurses.
Unlike nurses and laboratory workers who were unaware of whether a participant was exposed or unexposed, CHWs were aware of this information. However, to avoid subjectivity and bias in the results, the context of the demographic data collection was presented as part of a routine exercise rather than as a comparison between exposed and unexposed.
The questionnaire included variables relating to the identity of the participant, anthropometric parameters and food consumption.
The anthropometric parameters considered were weight and standing height. Anthropometric measurements were performed according to WHO guidelines [4] and were quality controlled by having two team members independently measuring the anthropometric parameters. The encoded figure was the average of these two measures. If there was a difference of more than 300 g for weight, and/or 0.5 cm for standing height, a third measurement was taken, and the average of the two nearest measurements used.
Finally, 4 ml of blood was obtained from an antecubital venipuncture after 12 hours of fasting for the determination of the hemogram after counting on an automaton using standard calorimetric enzymatic methods (CYAN smart CY009, Brussels, Belgium) in the laboratory of the Bukavu provincial general reference hospital (tertiary level hospital).
Statistical analysisWe used Stata software version 13.1 for statistical analyses. Categorical variables are summarized as frequency and proportion. Continuous variables are presented as mean and standard deviation (SD), as they all had symmetrical distribution.
Pearson's Chi2 or Fisher's exact test (if the conditions for applying Chi2 were not satisfied) were used for comparison of categorical variables and Student's t-test for comparison of means between groups.
Linear and logistic regression models were used for continuous variables [WBC, neutrophils, lymphocytes, RBCs, platelets, Hb and haematocrit (Hct), MCV, MCHC and MCHC] and categorical variables (anemia, thrombocytopenia, leukopenia, increased platelets and leukocytosis), respectively. The basic models included only the main exposure: SAM, thus providing a crude mean difference between exposed and unexposed for quantitative variables, and crude odds ratios (ORs) for categorical variables. The mean differences and ORs are shown with 95% confidence intervals (95% CIs).
To assess the potential confounding effect of adult dietary habits on the hematological profile, we added the food consumption score to the fitted model. To be included in the models, food consumption was dichotomized. We considered people with a satisfactory level of dietary diversity to be those with a fair food consumption score. The other categories were considered to have a "poor" level.
It should be noted that the conditions for the application of linear regression (normality, homoscedasticity and linearity) were checked by analysis of residuals and that the goodness-of-fit of the logistic model was verified by Hosmer-Lemehow’s test.
Comments (0)