
Remember me
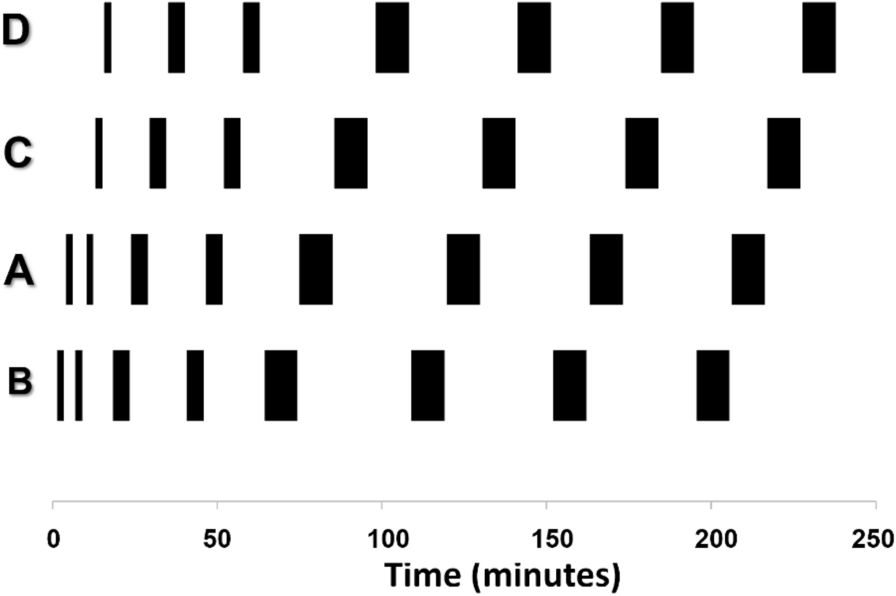
30 mL of human blood mixed with 5000 IU heparin were filled into two beakers where blood was agitated using magnetic mixers and kept at 37 °C. The blood in one beaker was mixed with approximately 100 MBq of [18F]F-PSMA-1007. A silicone tube (length: 800 mm, inner diameter: 0.3 mm, outer diameter: 0.7 mm; Reichelt Chemietechnik, Heidelberg, Germany) was connected via T-piece to the two beakers allowing to switch the blood source using vessel clamps. The commercially available Twilite detector (SwissTrace, Menzingen, Switzerland) was used for detecting coincidence annihilation radiation based on two lutetium yttrium orthosilicate (LYSO) crystals in a tungsten casing. Blood passes the sensitive detector volume within a loop and hence twice whilst being pumped through the detector. Scintillation light was separately guided into a photomultiplier unit where signals were processed into coincidence counts per second (coincidence window: 100 ns, temporal resolution: 1 s). The T-piece distance to the centre of the detector was 400 mm. Blood flow was driven downstream by an 8-wheel peristaltic pump (Medorex Schlauchpumpe TL, MDX Biotechnik International, Nörten-Hardenberg, Germany). Chosen flow rates were calibrated by pumping volumes over three minutes and subsequent weighing. The detector response was recorded for three rising-and-falling boxcar functions at six different flow rates F (24, 40, 55, 67, 79, 96 μL/min)
The same set of experiments was conducted with pumping air instead of the non-radioactive blood to determine the dispersion-free geometric sensitivity profile (detector response function) of the Twilite system, accounting for nonzero residence time within in the detector loop.
Female NMRI nu/nu mice (Janvier Labs, Le Genest-Saint-Isle, France), 9–10 weeks old, were housed at a constant temperature (22 °C) and relative humidity (40–55%) under a regular light/dark schedule. Food and water were available ad libitum.
Mice interventions were performed under combined anaesthesia (isoflurane, fentanyl) with temperature maintained at 37 °C ± 1 °C and breathing frequencies kept at 50–65 min−1 using typically 1.7–2.3% isoflurane in 100% oxygen.
9 animals were prepared in supine position with two intravenous tail vein catheters (one in each lateral tail vein). 4 µL/g of body mass of a 125 IU/mL heparinised saline solution was injected subcutaneously for anticoagulation. An extracorporeal circulation was applied shunting the surgically accessed femoral artery and a tail vain catheter as previously reported [6]. It consisted of an intravascular polyurethane tube in the femoral artery (length: 10 mm, inner diameter: 0.18 mm, outer diameter: 0.36 mm; Instech, Plymouth Meeting, PA) connected to a 150 mm silicone tube (same type as for boxcar function experiments), a T-piece connector for blood sampling, another 800 mm silicone tube that was placed into the Twilite and further downstream into the peristaltic pump, and additionally featured a glass capillary (length: 10 mm, inner diameter: 0.94 mm) before leading into the tail vein catheter. The distance between the femoral artery and Twilite centre was 400 mm.
For intracorporeal AIF recordings, a positron-sensitive microprobe (length: 1 mm, diameter: 0.25 mm, coupled to a photomultiplier unit via fiberglass light guides; BioSpace Lab, Nesles-la-Vallée, France) was surgically inserted into the aortic arch via the carotid artery, without occluding the aorta [10]. Another probe was placed in the paraaortic mediastinum via an incision above the sternum. To prevent signal contamination by ambient light, the animal was shielded inside a custom-built opaque plastic chamber. Figure 1 depicts an overview of the experimental setup.
Fig. 1
Experimental setup using both a shunt from femoral artery to the tail vein and implanted microprobes for extra- and intracorporeal AIF measurements, respectively a; examples of AIF acquisitions demonstrating extracorporeal dispersion b
Three mice each were examined for flow rates of approximately 30, 50, 70 µL/min. Constant flow rates were verified using a laser Doppler probe (Perimed AB, Järfälla, Sweden) attached to the glass capillary. 50 μL saline, followed by 100 μL [18F]F-PSMA-1007 in saline (39±25 MBq, equivalent to 390 ± 250 MBq/mL) and a 50 μL saline flush were injected using a power injector at 1000 µL/min (Harvard Apparatus, Holliston, MA). Simultaneous microprobe and Twilite measurements were performed for 90 min. Blood samples (approx. 50 μL) were withdrawn at 5, 15, 30 and 90 min post-injection at the T-piece connector for calibration of the microprobes using a calibrated gamma counter (2480 Wizard2, PerkinElmer, Waltham, MA) and a calibrated balance as well as for haematocrit (\(hct\)) measurements. Afterwards, the silicone tube was cut at the tail vein, and a 3-min sample was taken, to retrospectively calibrate both flow rates and the Twilite detector, the latter again using the gamma counter. Finally, the mice were sacrificed under deep anaesthesia, and the chest was opened to verify correct placement of the microprobes.
AnalysesAll analyses were performed using MATLAB and its nonlinear least-squares solver (MathWorks, Natick, MA).
The acquired Twilite signals were corrected for LYSO background activity and physical decay of 18F. The input \(_(t)\) into the tube was modelled as a sum of three radioactivity boxcar functions:
$$_(t)\sim \sum_^\left(H\left(t-_\right)-H\left(t-_\right)\right)$$
(1)
with \(H\) denoting the Heaviside function, and \(_\), \(_\) the switching times between non-radioactive blood/air and radioactive blood, available as tagging information within the detector event list.
The background- and decay-corrected measurement \(c(t)\) was modelled as a convolution of \(_(t)\) with a suitable kernel \(k(t)\):
$$c\left(t\right)=_\left(t\right)*k\left(t\right)$$
(2)
with \(*\) denoting the convolution operator. The analysis was conducted considering two different assumptions for the kernel characterisation: a pure dispersion component of the kernel (\(_\)) describing catheter dispersion alone and a more complex one consisting of the convolution of \(_\) and the detector response kernel \(_\): \(k\left(t\right)= _\left(t\right)*_\left(t\right)\). The latter was approximated by a sum of two shifted Gaussians, reflecting that blood passes the sensitive detector volume twice due to the loop:
$$_\left(t;\mu ,\sigma \right) = \frac\left(\frac\pi }}^^}^}}+\frac\pi }}^^}^}}\right)$$
(3)
The two parameters \(\mu\) and \(\sigma\) were determined as functions of the flow rates \(F\) by fitting the respective boxcar pulses convolved with \(_}(t)\) to the geometric detector response function measurements. Within this parameterisation, \(t=0\) refers to the time when radioactive blood reaches the turning point of the loop within the detector unit. As Gaussians are by definition non-vanishing at any time, chosen kernel parameterisation is actually non-causal; however, they are vanishing sufficiently fast so no visually non-causal kernels resulted in any of the investigated cases.
The catheter dispersion kernels \(_}(t)\) were assumed to be described by one of three possible mathematical models:
$$_}\left(t\right)=_\left(t;\Delta t,w,_,_,_,_\right)=H(t-\Delta t)\bullet \left[w\frac^_-1}}_^_}\Gamma \left(_\right)} }^_}+\left(1-w\right)\frac^_-1}}_^_}\Gamma \left(_\right)} }^_}\right]$$
(4a)
$$_\left(t\right)=_\left(t;\Delta t,n,\tau \right)=H(t-\Delta t)\bullet \frac^}^\Gamma \left(n\right)} }^$$
(4b)
$$_\left(t\right)=_\left(t;\Delta t,\tau \right)=H(t-\Delta t)\bullet }^$$
(4c)
Here, ME refers to dispersion as convolution with a mono-exponential kernel [11], SG with a single-gamma variate, and DG with a sum of two gamma variates, in order to capture complex dispersion kernel shapes found in some numerical simulations [12]. In particular, three cases were compared:
1)DG: \(k\left(t\right)=_}(t)*_}(t)\)
2)SG: \(k\left(t\right)=_}(t)\)
3)ME: \(k\left(t\right)=_}(t)\)
DG here refers to the most complex model with explicit detector response function modelling, whilst SG and ME assume simpler models without explicit geometric detector response function. Deconvolution was performed by finding optimal kernel parameters for DG, SG, and ME that minimise the sum-of-squared differences between the Twilite measurements \(c(t)\) and \(_(t)*k(t)\). Model performances were assessed by the Akaike Information Criterion (AIC) [13], by calculating the AIC differences of each method to the smallest determined AIC value [14]. The kernel parameters were parametrised as functions of the blood flow \(F\) for the two best models.
For the mice experiments, Twilite and microprobe signals were corrected for background and decay as described above. Twilite data were calibrated to units of Bq/mL using the late 3-min blood sample and normalised to the injected activity concentration, thus resulting in unitless AIF.
The microprobe-based AIF was determined from the background- and decay-corrected aortic signal \(_(t)\) and mediastinal signal \(_(t)\) as
$$}_(t)= _+_\bullet _(t)-_\bullet _(t)$$
(5)
with constants \(_\), \(_, _\) being determined from fitting this equation to the 4 blood sample values (in Bq/mL) taken during the experiments. In cases where \(_\) was different to zero, the early AIF was set to zero until blood radioactivity was detected by the microprobes. \(_\) was also normalised to the injected activity concentration, resulting again in unitless AIF.
Numerical deconvolution using kernels from the dispersion models was performed by parameterising the Twilite-based AIF as consisting of a linearly rising part followed by a sum of four exponentials [15, 16]:
$$\mathrm\left(t;_,_,_,_\right)=\left(H\left(t-_\right)-H\left(_-_\right)\right)\left(t-_\right)\frac_+_+_+_}_}+ H\left(t-_-_\right)\sum_^_}^_-_}_}}$$
(6)
with \(_\) denoting the onset time, \(_\) the rising time, \(_+_+_+_\) the peak height, and \(_\) the time constants of the exponentials. Nonlinear least squares fitting was performed to provide estimates of the parameters by optimising simultaneously not only the AIF parameters, but also the kernel parameters, to account for potential differences in dispersion between boxcar and mice experiments. Thus, the optimal parameters leading to the best deconvolution are determined as:
$$_},_\right)}^}=\underset_},_}}(t;_)*k(t;_)-c(t)\Vert }^$$
(7)
with \(_}=\left(_,_,_,_\right)\) denoting the AIF parameters, and \(_=\left(\Delta t,w,_,_,_,_\right)\) and \(_=\left(\Delta t,n,\tau \right)\) for DG and SG parameters, respectively, resulting in optimal Twilite-based AIF \(_\) and \(}_\).
Given the high number of optimisation variables and the inner difficulties of deconvolution, prior knowledge and constraints were allowed during the fitting. In particular, since any change in \(_\) can be counterbalanced by a change in kernel \(\Delta t\), \(_\) was fixed to 7 s in this process. Moreover, initial values for iterative optimisation related to AIF parametrisation were set to \(_=7 }\),\(_=0.04\), \(_=0.02\), \(_=0.01\), \(_=0.002\), \(_=3 }\), \(_=30 }\), \(_=300 }\), \(_=3000 }\), whilst the initial values for the kernel parameterisation were taken from the boxcar function analysis based on the parameterisation of the respective kernel with known blood flow \(F\).
AIC analyses were performed as described above in order to decide which deconvolution approach was superior. The peak heights were determined for all three methods and compared using one-way ANOVA. Coefficients of variation (CoV) for the ratios of Twilite-based AIF peak heights to those of \(_\) were calculated. Areas-under-curve (AUC) were evaluated at \(t=300 }\) and \(t=5000 }\) for all AIF and compared using one-way ANOVA along with multiple comparison test (pairwise test for multiple groups). Finally, average AIFs ± standard deviation (SD) were calculated for the two best kernels.
We simulated PET response TACs using one-tissue compartment (1TC; with compartment concentration \(_\)) and two-tissue compartment (2TC; with compartment concentrations \(_\), \(_\)) models, assuming that \(}_\) corresponds to the “real” AIF. Additionally, we assumed the radiotracer is not metabolised and not taken up by red blood cells, i.e. blood plasma concentration was equal to \(_(t)/\left(1-\mathrm\right)\), with the individually determined haematocrit values \(hct\). The simulation was conducted using PMOD (PMOD Technologies, Zurich, Switzerland). For 1TC, two parameter sets were chosen: \(_=0.200 }^\), \(_=0.100 }^\) (1TC-sim1) and \(_=0.200 }^\), \(_=0.020 }^\) (1TC-sim2), respectively; for 2TC, two parameter sets were chosen based on literature values for mouse FDG brain PET: \(_=0.270 }^\), \(_=0.570 }^\), \(_=0.080 }^\), \(_=0.018 }^\) (2TC-sim1), and \(_=0.140 }^\), \(_=0.190 }^\), \(_=0.070 }^\), \(_=0.005 }^\) (2TC-sim2), respectively [3, 17]. PET TACs \(_(t)\) were determined as
$$_}\left(t\right) = \left(1- _\right)_\left(t\right)+_}_\left(t\right)$$
(8)
for 1TC, and
$$_}\left(t\right)=\left(1-_\right)\left(_\left(t\right)+_\left(t\right)\right)+_}_\left(t\right)$$
(9)
for 2TC, with \(_=0.05\), reflecting a typical blood fraction value for soft tissue. These were then modelled using both \(_\) and \(_\) as AIF, again using PMOD, resulting in fit values for \(_\), \(_\), \(_\), \(_\), and \(_\), which were compared to the pre-defined simulation values. Total distribution volume \(_=_/_\) for 1TC and net influx \(_=__/(_+_)\) for 2TC were also compared.
Comments (0)