Study design
This test-retest study was part of a randomized controlled trial (EudraCT-no.: 2021-003525-30) aiming to evaluate the effect of the anti-inflammatory drug colchicine on vessel wall inflammation in patients with type 2 diabetes measured by [18F]FDG PET/CT. Of the 30 participants that underwent [18F]FDG D-WB PET/CT at baseline, 15 participants opted to participate in the present reproducibility study. In these patients, retest-scans were carried out on the day following the baseline scan (24.0 ± 0.8 h mean interval between studies). Both scans were performed before the trial’s pharmacological intervention. Data were collected between November 2022 and May 2023 at a single trial site at Department of Nuclear Medicine & PET-Centre, Aarhus University Hospital, Aarhus, Denmark. The trial was approved by the local ethics committee (Committees on Health Research Ethics of the Central Region of Denmark, approval no. 1-10-72-345-21) and complied with the Helsinki declaration. All participants gave written informed consent prior to enrolment.
Trial participants
Patients with type 2 diabetes and HbA1C ≥ 48 mmol/mol (6,5%) and either age ≥ 50 years and a history of cardiovascular disease or age ≥ 60 years and at least 1 risk factor for CVD (e.g. albuminuria), were eligible for inclusion. Participants were excluded if they had an estimated glomerular filtration rate (eGFR) < 50 mL/min/1.73 m2, active non-cutaneous cancer, liver disease, severe heart failure, inflammatory bowel disease or cytopenia (anaemia, leukopenia, or thrombocytopenia). An exhaustive list of inclusion and exclusion criteria can be found in the Supplemental Table 1.
Imaging protocol
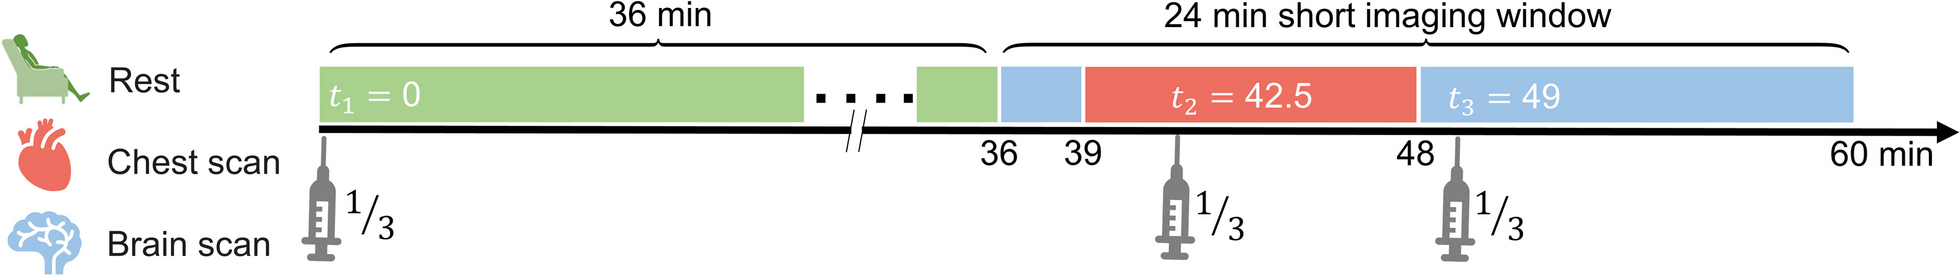
All participants were scanned using a fully automated short multiparametric 20-minute [18F]FDG D-WB PET protocol 60–80 min post-injection performed on a Siemens Biograph Vision 600 PET/CT scanner (Siemens Healthineers, Knoxville, TN, USA). Participants fasted for at least 8 h prior to imaging and abstained from caffeine and nicotine products on the study days. Blood glucose levels and blood pressure were measured in all participants. A standardized tracer infusion was administered using an Intego PET Infusion System (MEDRAD, Inc., Warrendale, PA, USA) through a peripheral venous catheter in the participant’s arm.
A low-dose WB CT (25 Ref mAs, 120 kV, Care Dose4D, Care kV, Admire level 3) was performed, followed by a 20-minute multiparametric PET acquisition protocol, consisting of 4 × 5 min WB passes, started 60 min after tracer administration. The same protocol was repeated on the following day for retest evaluation.
Input function analysis
To obtain multiparametric images from this short 20-min D-WB PET acquisition protocol, a population-based input function (PBIF) was used, scaled to the tail of the image-derived input function (IDIF) following the methodology described in the study by Dias et al. [12].
In brief, an automated delineation tool, developed by Siemens Healthineers, known as automated learning and parsing of human anatomy (ALPHA) [16] was employed to generate a 1.6 mm3 cylinder VOI in the proximal descending aorta in order to extract an IDIF. The correct position of the VOI was verified by visual inspection. The PBIF was then individually applied by scaling it to the participant’s IDIF as measured on the four late passes. Thus, this scaled PBIF (sPBIF) accounts for variations in injected dose, the patient’s body composition, and tracer distribution.
PET image reconstruction
In this study, 4 PET reconstructions were performed: (1) The standard-of-care SUV image using PET data from 60 to 70 min (two passes): TrueX + TOF, 4 iterations, 5 subsets, 440 × 440 matrix, 2-mm Gaussian filter, and relative scatter correction; (2) An SUV image using PET data from 60 to 80 min (four passes): TrueX + TOF, 6 iterations, 5 subsets, 440 × 440 matrix, no filtering, and relative WB scatter correction; (3) and (4) Direct Patlak with non-negativity constraints [6] was performed to reconstruct the two parametric images (MRFDG and DVFDG) using data from 60 to 80 min (four passes) using the previously described PBIF: TrueX + TOF, 8 iterations, 5 subsets, 30 nested loops, 440 × 440 matrix, 2-mm Gaussian filter, and relative scatter correction.
Image analysis
After image acquisition, the deep-learning (DL) software TotalSegmentator [17] was applied to the low-dose WB CT, automatically delineating structure VOIs. For this study, we selected VOIs of the aortic wall, myocardium of the left ventricle, right kidney, liver, lungs, pancreas, spleen, and vertebra (L3). Furthermore, geometric VOIs were placed in the liver (sphere, 30 mm radius), spleen (sphere, 20 mm radius), and lung (sphere, 20 mm radius), since these areas are more prone to movement which can introduce biases to the quantitative measurements when using VOIs automatically delineated from the CT information. All VOIs were individually checked by J.M.B and A.H.D. and manually adjusted to the respective areas if necessary using PMOD® 4.0 (PMOD Technologies Ltd., Zürich, Switzerland).
Quantitative values of SUVmean, MRFDG−mean and DVFDG−mean were extracted respectively from the SUV60 − 80 min, SUV60 − 70 min, and the Patlak PET reconstructions. MRFDG is calculated as Ki × plasma glucose and can be converted to the metabolic rate of glucose (MRGlu) using MRGlu = MRFDG/LC, where LC is the lumped constant. All images and tables assume LC = 1, as LC is tissue-dependent and not established for all tissues. To provide a more comprehensive analysis and account for body composition variations, additional calculations were performed, including SUVglu (plasma glucose-corrected SUV), SUL (lean body mass-corrected SUV), and SULglu (plasma glucose-corrected lean body mass-corrected SUV). These metrics while not commonly used in a clinical setting can potentially reduce intersubject variability and provide more accurate assessments of tracer kinetics. Specifically, SUVglu was calculated by multiplying SUV by the plasma glucose concentration, while SUL and SULglu were obtained by normalizing SUV and SUVglu to lean body mass, respectively.
Statistical analysis
Normally distributed data are presented as mean ± standard deviation or with 95% confidence intervals, data with a non-normal distribution are presented as median values with interquartile ranges. Data normality was evaluated with histograms and QQ-plots.
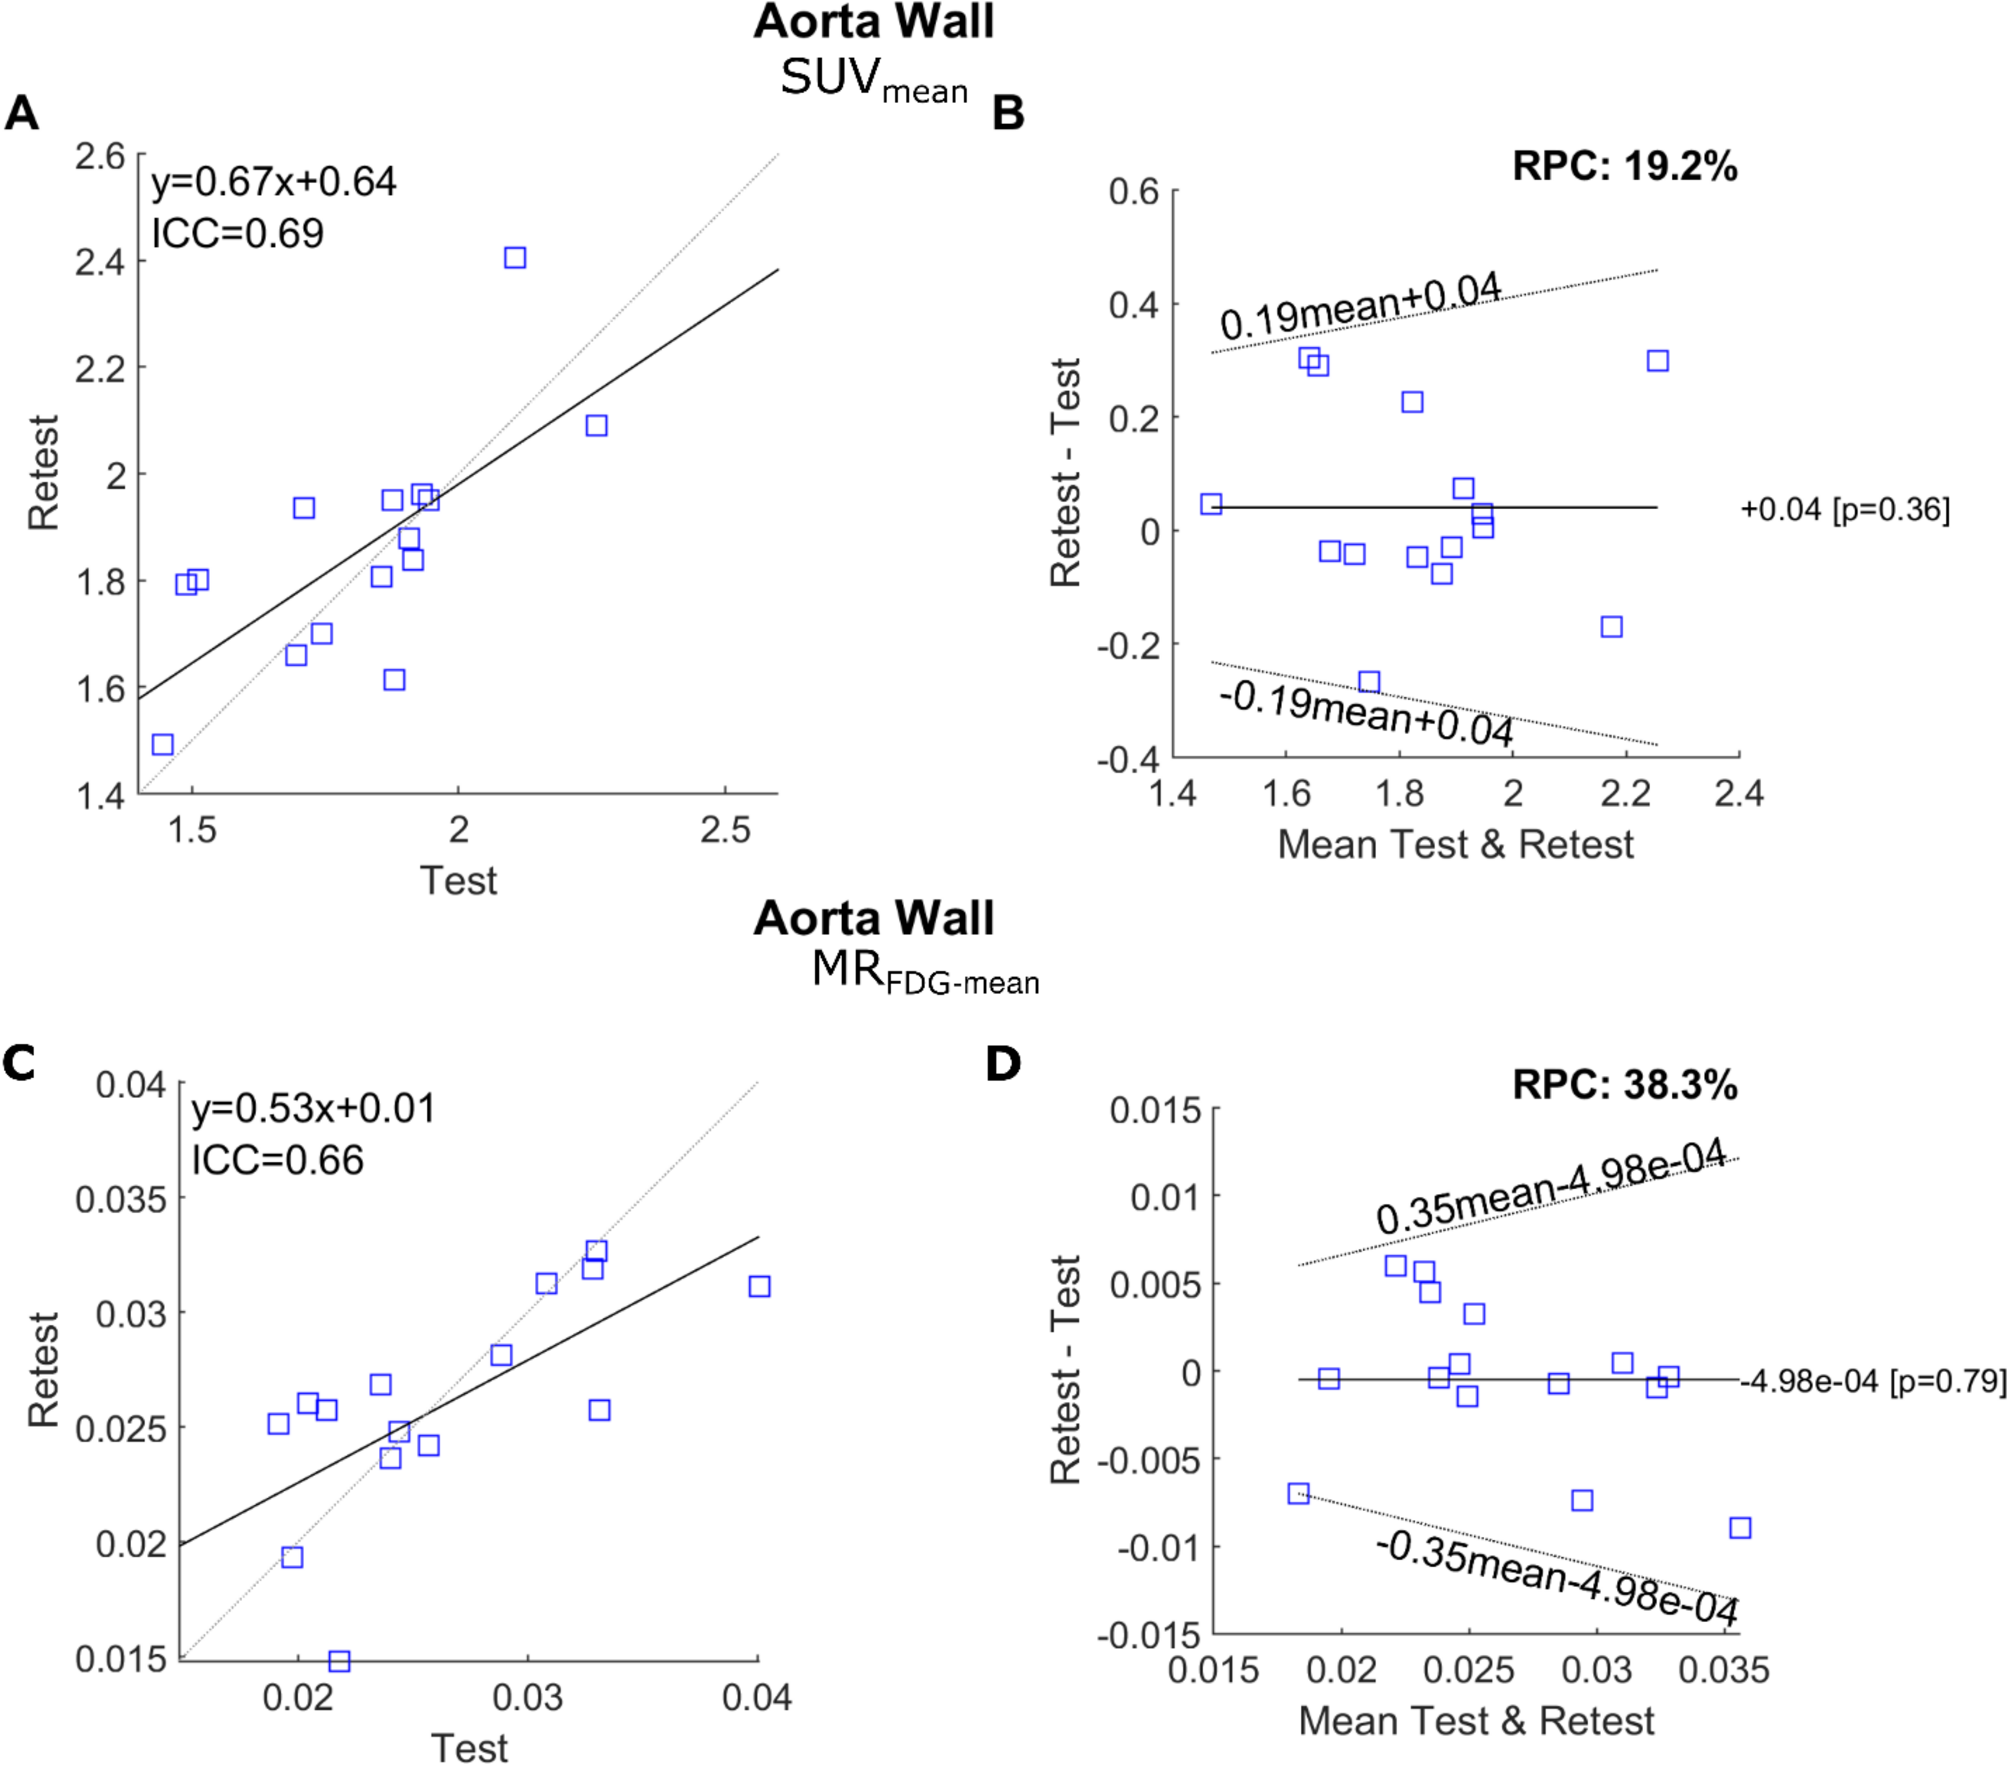
The repeatability of SUVs, MRFDG and DVFDG was assessed with a Bland-Altman Analysis similar to Jochumsen et al. [18]. Non-normal distributed data were log-transformed, and the within-subject coefficient of variability, intraclass correlation coefficients (ICCs) and repeatability coefficients (RPC) were calculated according to the methodology described by Lodge et al. [19]. In brief, the RPC was calculated as 1.96 × √2 × wCV, where wCV represents the within-subject coefficient of variation for log-transformed data. Bland–Altman plots of MRFDG are presented in the original scale, whereas limits of agreement are back-transformed using the methodology of Euser et al. [20]. The percentage RPC (%RPC) was expressed for easier understanding of the measurements relative to the size of the measured values. A lower %RPC suggests better repeatability, indicating that the measurement error is small relative to the size of the measurements [21].
Examples of sample size calculations were performed using a two-sided significance test of no difference for paired log-normally distributed data, with a significance level of 5% and a power of 95%. These calculations were based on the standard deviation of the difference between the logarithm of the test and the logarithm of the retest.
Study data were collected and managed using REDCap (Vanderbilt University Medical Center, Nashville, TN, USA) [22, 23]. Data analysis was conducted using Stata version 18.1 (StataCorp LLC, College Station, TX, USA).

Comments (0)