
Remember me
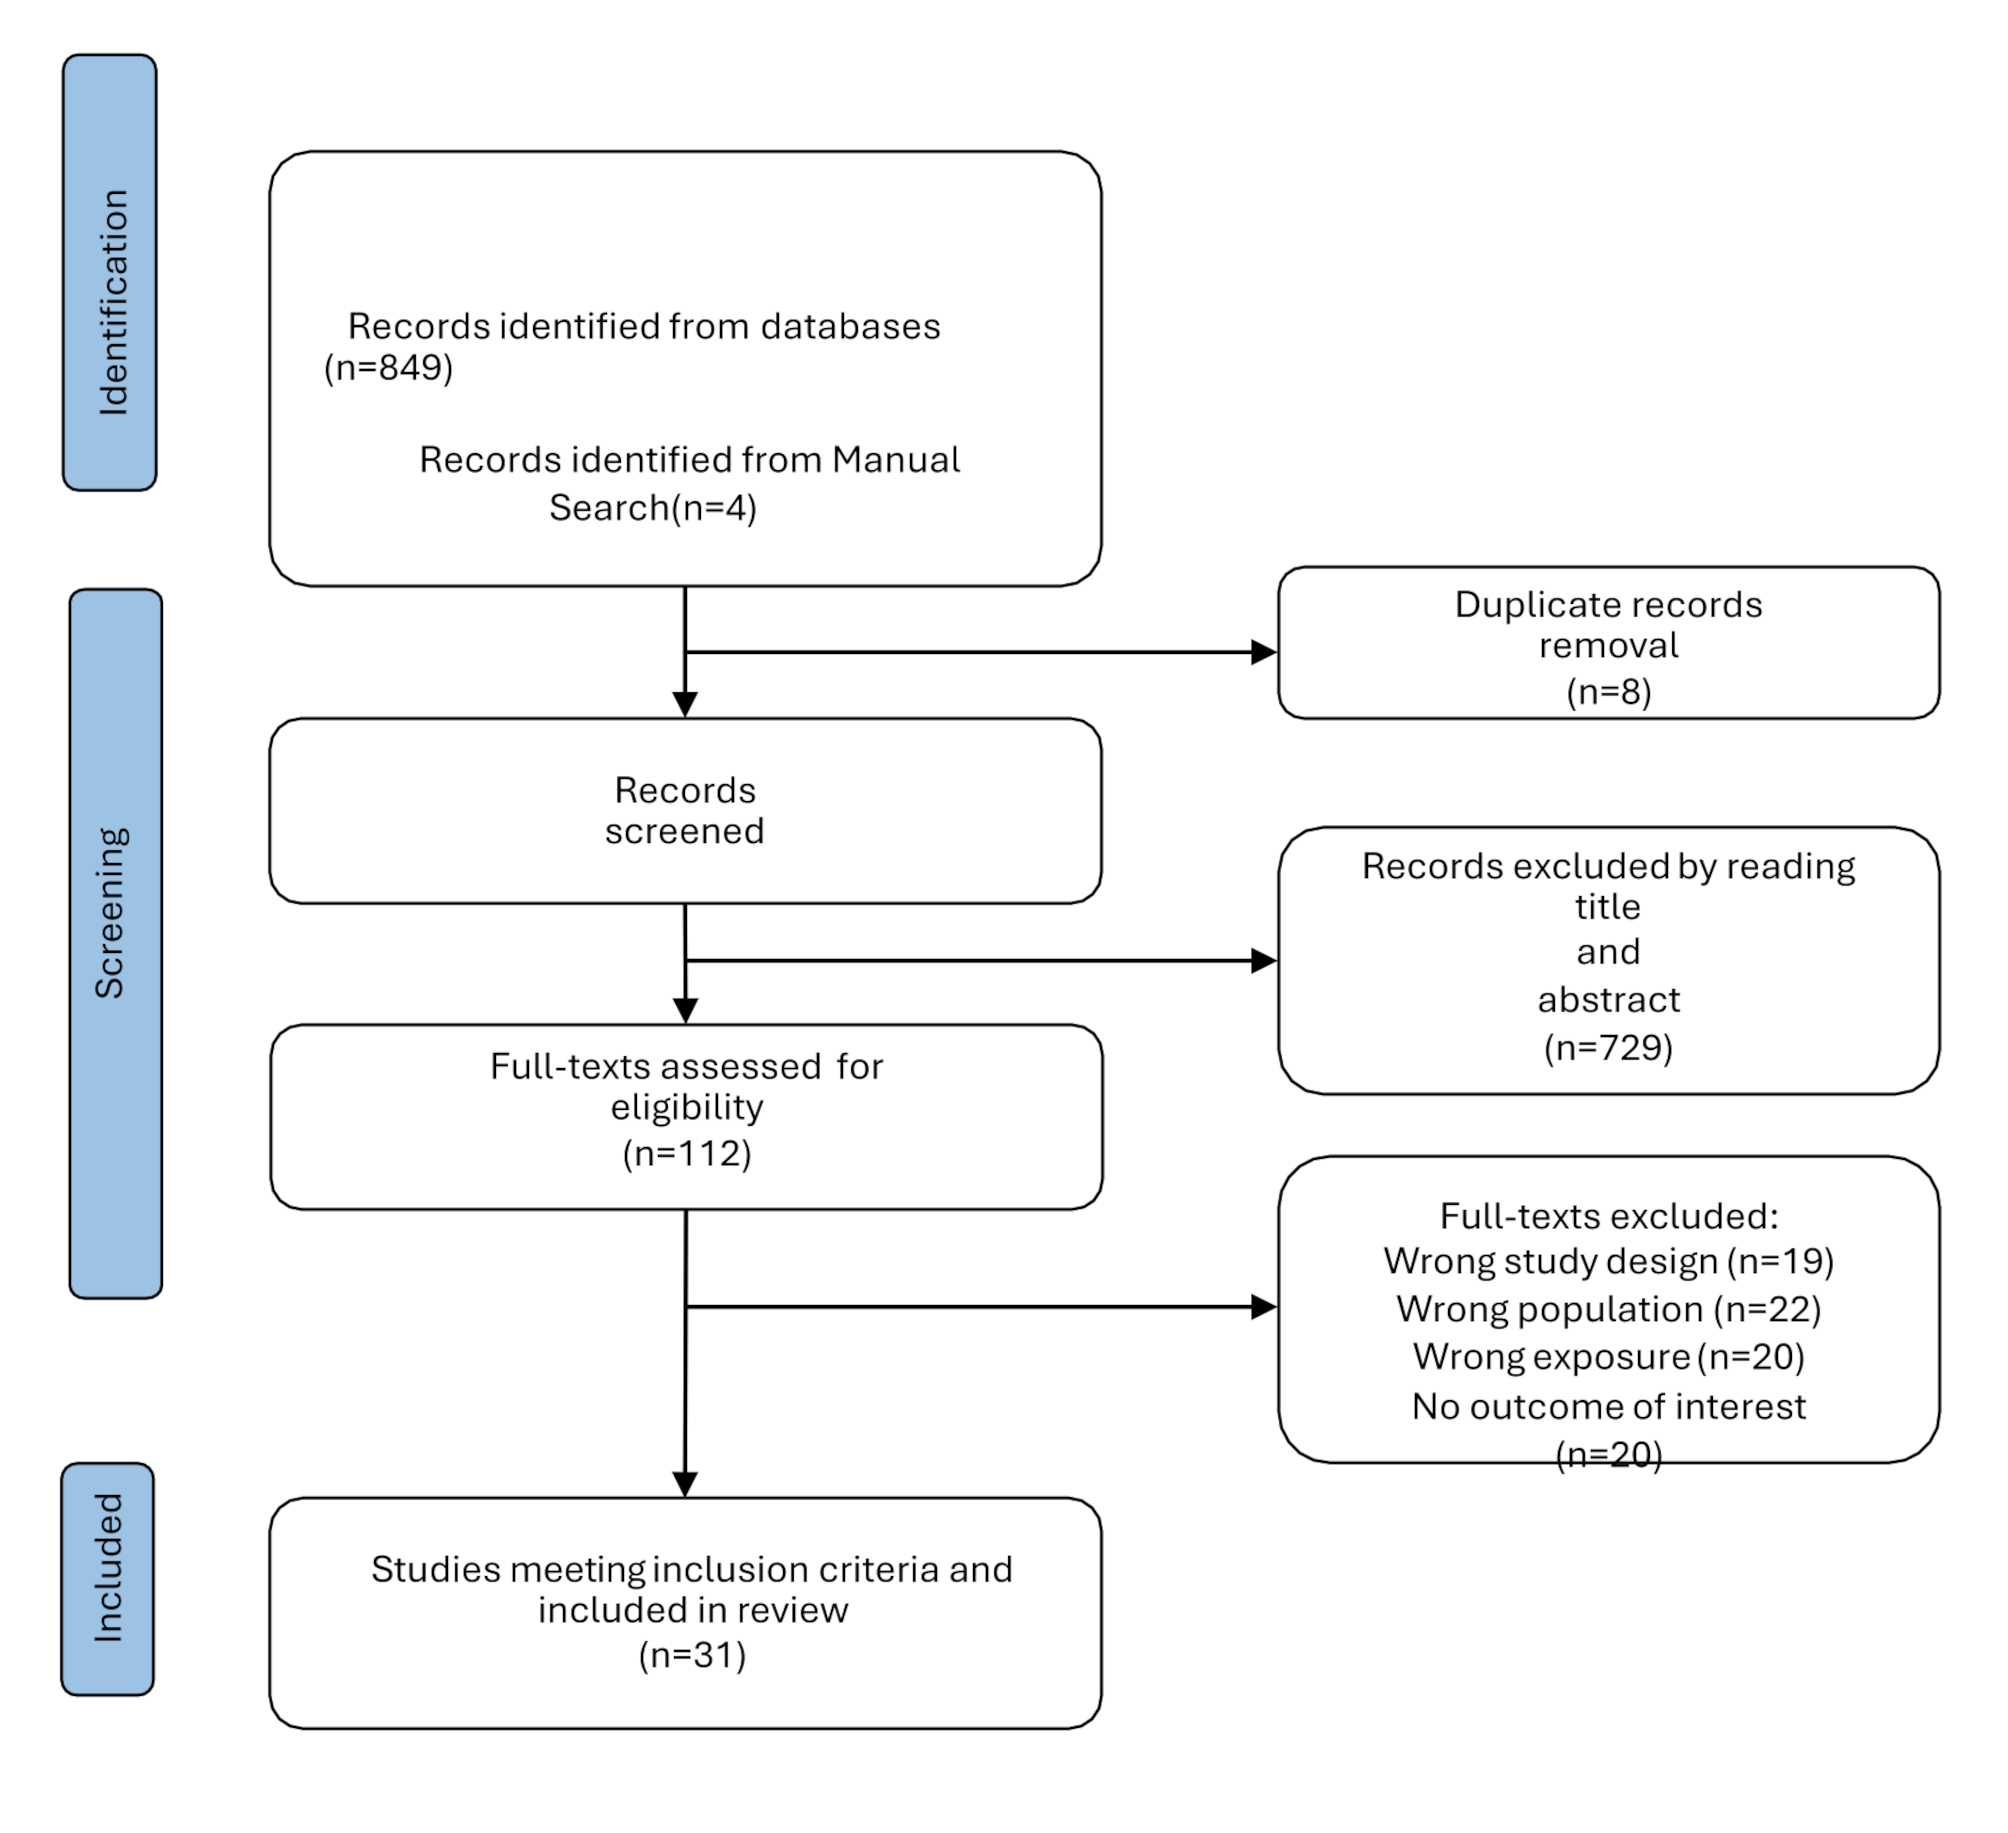


We retrieved 1118 studies from electronic databases, after reading titles and abstracts through the literature management software, 914 non-conforming studies were excluded, and 176 studies were excluded by full-text reading. Finally, 28 studies were included in the meta-analysis. The steps for document retrieval are shown in Fig. 1.
Fig. 1
Steps of document retrieval
The characteristics of the twenty-eight included studies are presented in Table 1 [5, 10,11,12,13,14,15,16,17,18,19,20,21,22,23,24,25,26,27,28,29,30,31,32,33,34,35,36]. The studies were published between 2012 and 2022 and published in Switzerland, Canada, England, and China. A total of 9711 patients with bipolar disorder, depression disorder, schizophrenia, and healthy control were included.
Table 1 Description of included studiesMeta-analysisBipolar disorder vs healthy controlA total of twenty-five studies were included, including 3238 patients with bipolar disorder and 2876 healthy controls [10,11,12, 14, 16,17,18,19, 21,22,23,24,25,26,27,28,29,30,31,32,33,34,35,36]. Figure 2 forest plot for serum uric acid levels in the bipolar disorder group compared with the healthy control group. A random-effects model was used because high levels of heterogeneity were observed among the twenty-five studies. Serum uric acid levels were significantly higher in bipolar disorder patients than healthy controls [SMD 95%CI 0.87 (0.67 ~ 1.06); Z = 8.68 (p < 0.00001); I2 = 92%)]. To explore the source of heterogeneity, we conducted a further subgroup analysis of studies that provided data on specific subtypes of bipolar disorder. The forest plot for subgroup analysis is shown in Fig. 3. The results showed that the uric acid levels among different subgroups of bipolar disorder are a major source of high heterogeneity, especially in the group of BD depressed episode, there was low heterogeneity in BD manic/mixed episode groups.
Fig. 2
Forest plot for serum uric acid levels in the bipolar disorder compared with the healthy control
Fig. 3
Forest plot for subgroup analysis of serum uric acid levels in the bipolar disorder compared with the healthy control
Bipolar disorder vs depressionWhen comparing serum uric acid levels in the bipolar disorder group with the depression group, we included 1469 patients with bipolar disorder and 1568 patients with depression [11, 13, 19, 30, 36]. The forest plot for serum uric acid levels in the different groups is shown in Fig. 4. The results showed that serum uric acid levels were significantly higher in bipolar disorder patients than in depression patients [SMD 95%CI 0.53 (0.37 ~ 0.70); Z= 6.48 (p< 0.00001); I2 = 63%)]. This comparison also had high heterogeneity, whereas we could not assess publication bias due to the lack of eligible studies.
Fig. 4
Forest plot for serum uric acid levels in bipolar disorder compared with the depression
Bipolar disorder vs schizophreniaWe conducted a meta-analysis of six studies to compare bipolar disorder with schizophrenia, 947 patients with bipolar disorder and 785 patients with schizophrenia were included [18, 21, 22, 33, 35, 36]. Bipolar disorder had increased uric acid levels with an SMD [95%CI 0.27 (0.05 ~ 0.49); Z = 2.41 (p = 0.02); I2 = 77%)]. The heterogeneity was also high, so we chose the random-effects model. The forest plot for serum uric acid levels in the two groups is shown in Fig. 5.
Fig. 5
Forest plot for serum uric acid levels in bipolar disorder compared with the schizophrenia
BD manic episode vs BD depressed episodeWe compared uric acid levels among different subtypes of bipolar disorder, a total of sixteen studies were compared, including 1205 patients with manic episodes and 837 depressed episodes [5, 11, 14,15,16, 18,19,20, 22, 25, 26, 30, 31, 33,34,35]. Figure 6 shows the serum uric acid levels were significantly higher in manic episode patients than depressed episode patients [SMD 95%CI 0.31 (0.22 ~ 0.41); Z = 6.79 (p < 0.00001); I2 = 0%)], there was low heterogeneity in this comparison, so we chose the fixed-effects model. The results of the comparison showed that uric acid levels may play an important role in distinguishing different subtypes of bipolar disorder.
Fig. 6
Forest plot for serum uric acid levels in the BD manic episode compared with the BD depressed episode
BD mixed episode vs BD manic episode/depressed episodeFinally, we included six studies to analyze the relationship about serum uric acid levels between BD mixed episode and BD manic episode/depressed episode [5, 11, 20, 25, 30, 31]. However, we did not find any significant differences in uric acid levels comparing, respectively, mixed/manic (p = 0.63) and mixed/depressed (p = 0.16).
Sensitivity analysis and quality assessmentA “leave-one-out sensitivity analysis” was performed to evaluate the impact of the heterogeneity between all studies. None of the results about bipolar disorder vs healthy control and the comparison of different subtypes of bipolar disorder were altered after any one study was excluded. However, in the comparison about Bipolar disorder with schizophrenia or depression, the results significantly affected the pooled results (I2 dropped from > 50 to < 50%) after excluding one study respectively [13, 19, 36]. Therefore, we hypothesized that the study of these three studies may be the source of heterogeneity in this meta-analysis. The risk of publication bias about BD manic episode vs BD depressed episode was analyzed by Egger’s regression test (p > 0.05), the results suggested that there was no significant publication bias in the meta-analysis, and the funnel plot is shown in Fig. 7.
Fig. 7
Funnel plot about BD manic episode vs BD depressed episode
Comments (0)