
Remember me


Participants were recruited for this cross-sectional validation study in two ways. The survey documents were mailed to informal caregivers living in Bavaria who had participated in the “Benefits of Being a Caregiver” study (recruitment in 2019–2020) and had given their consent to be contacted for future voluntary surveys. In addition, survey documents were distributed to patients in two outpatient medical facilities in Heiligenstadt and Eckental (Bavaria, Germany). Inclusion criteria were being at least 18 years of age, being able to complete a questionnaire in German, and not having dementia. In contrast to the previous study participants who were re-contacted, the individuals recruited in the medical context remained anonymous to the research team. By returning the completed questionnaire, the participants consented to the anonymized use of the information they provided. Data collection began in September 2022 and was completed in January 2023. Approval for the study was obtained from the ethics committee of the Medical Faculty of the Friedrich-Alexander-Universität Erlangen-Nürnberg (No.: 220_20 B).
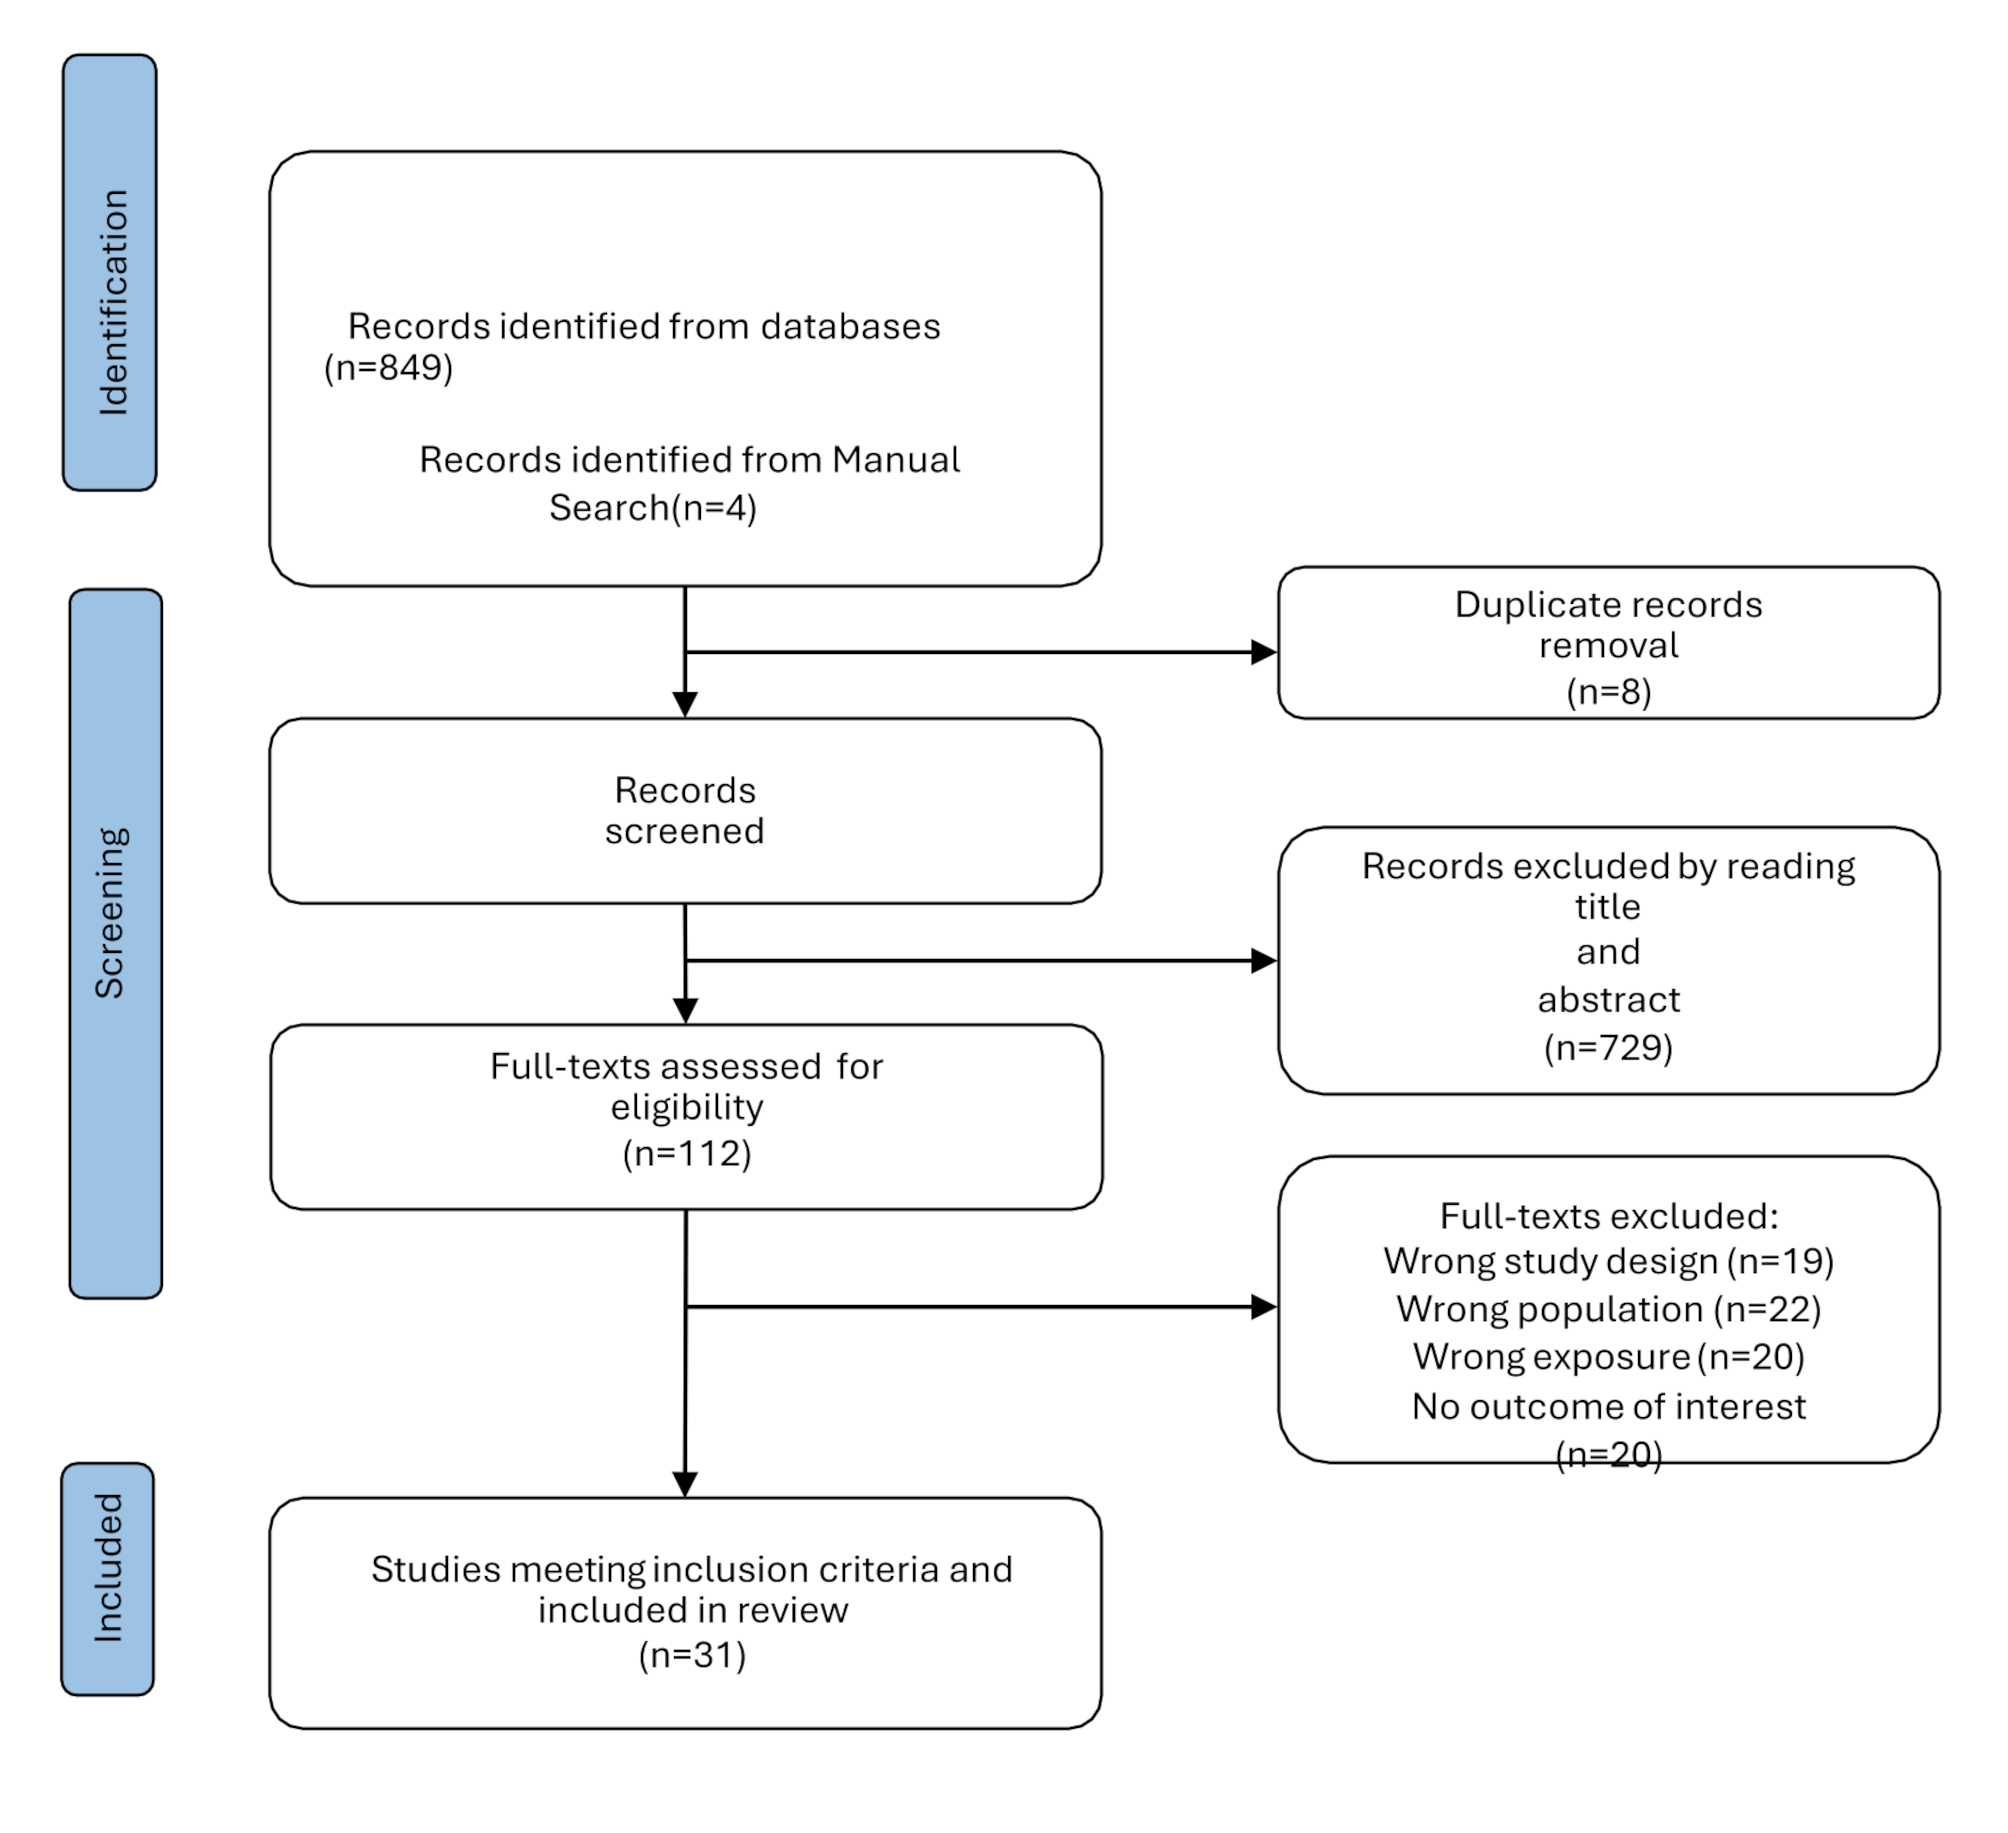
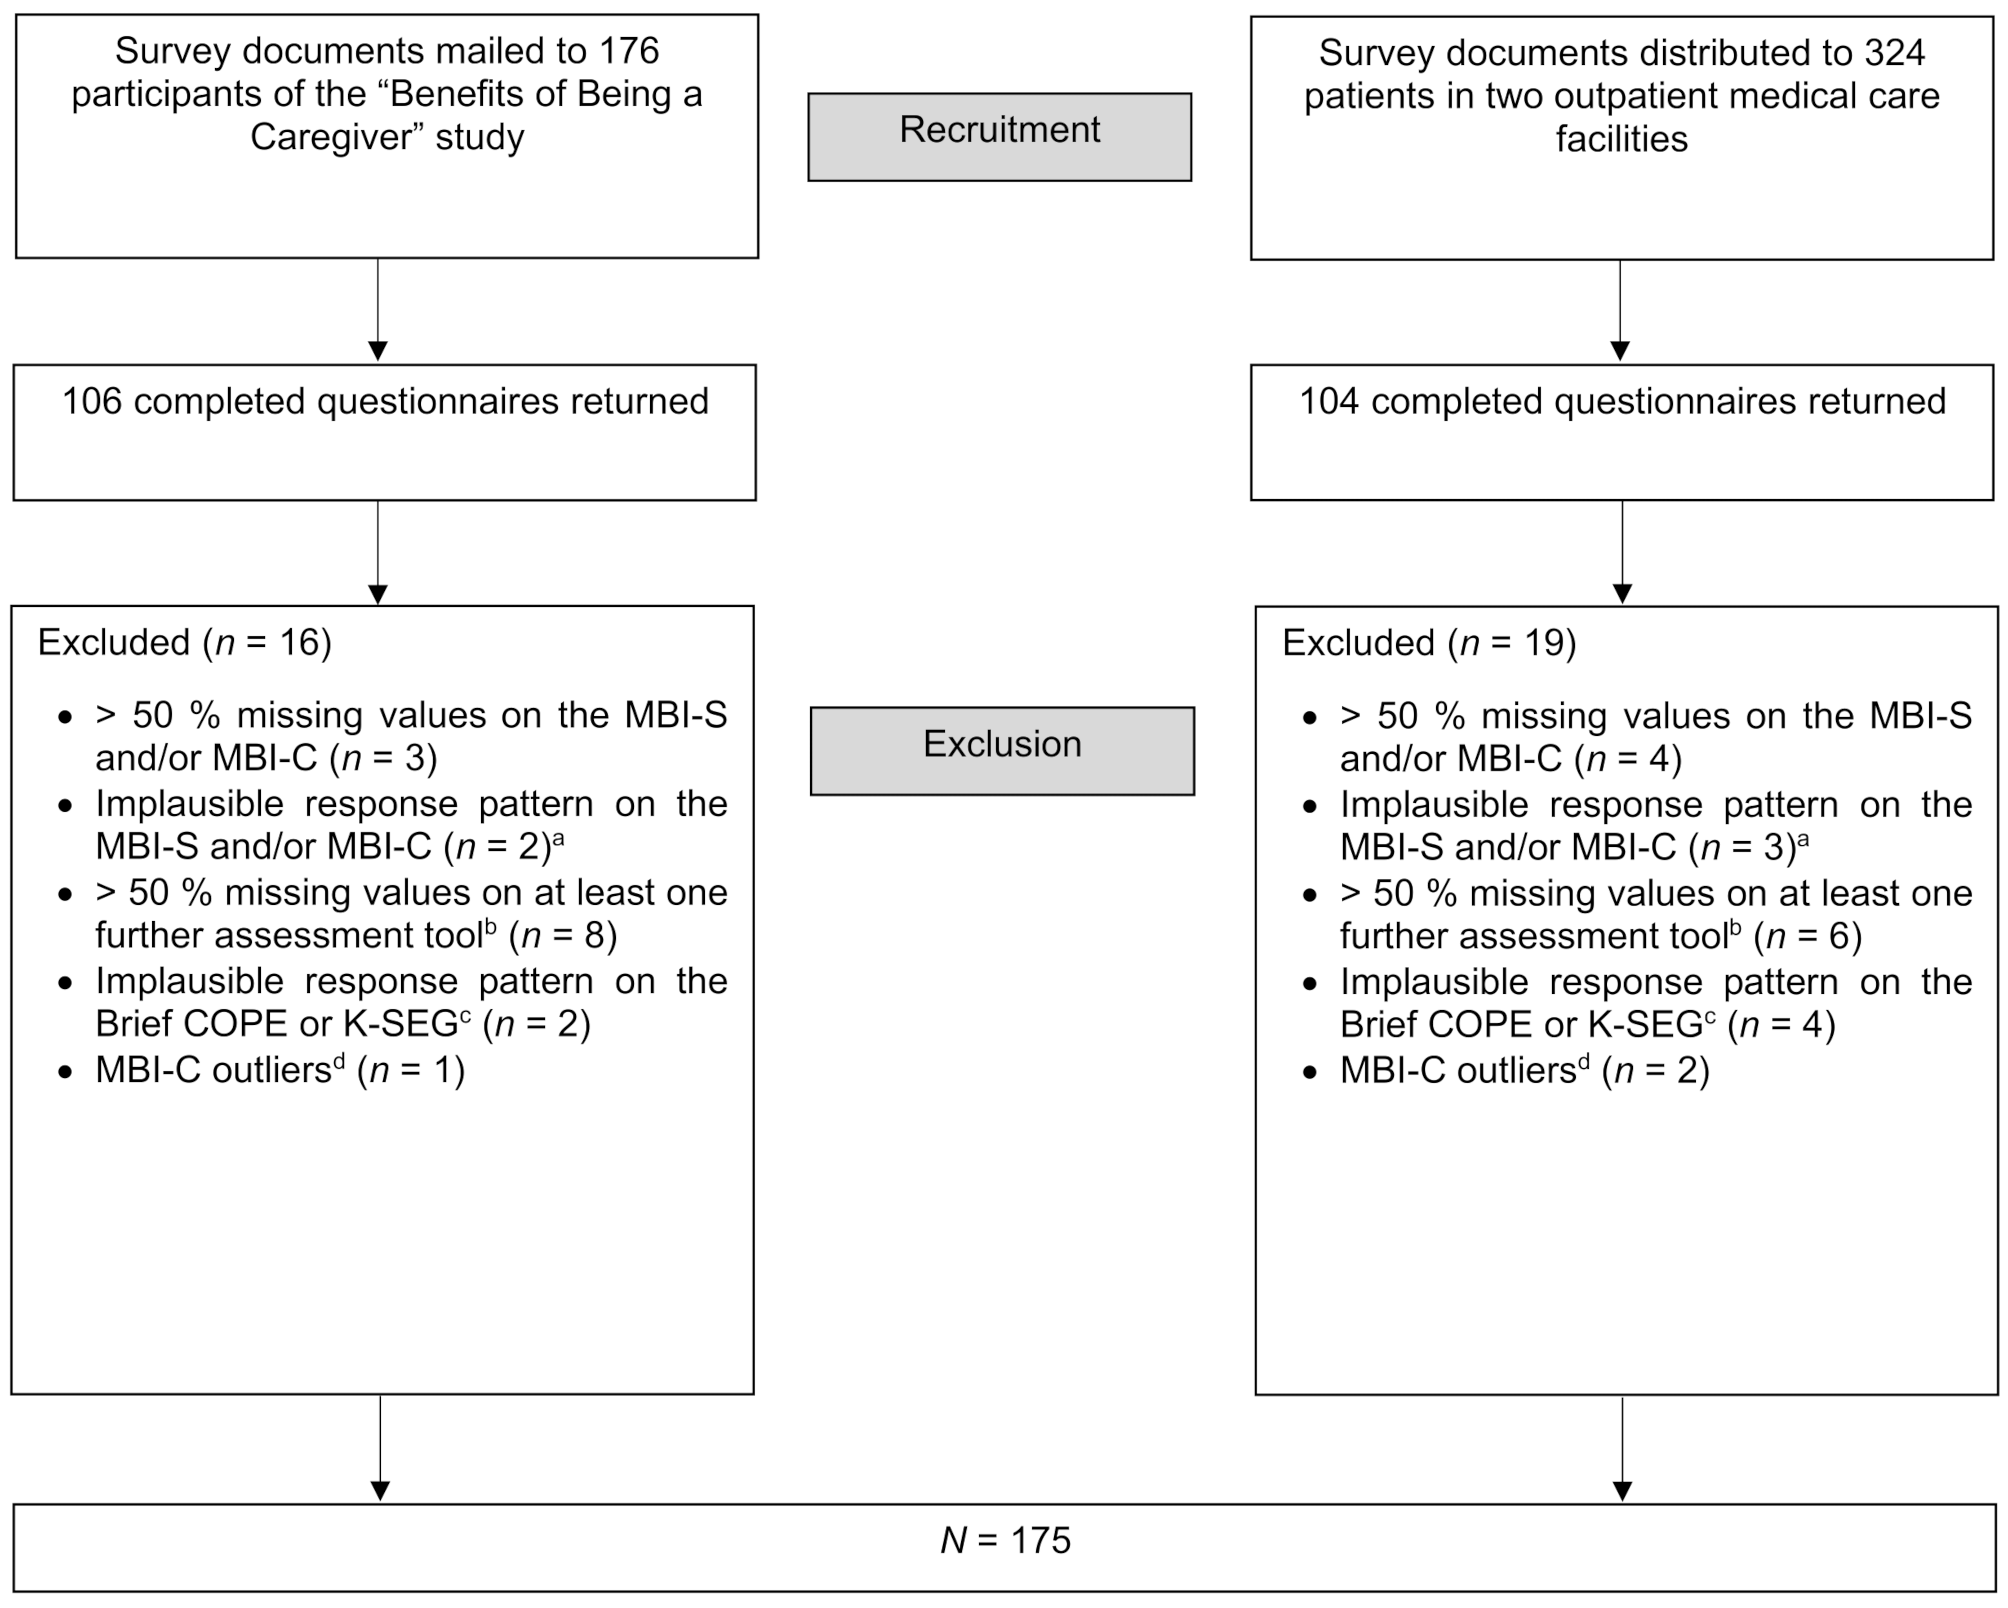
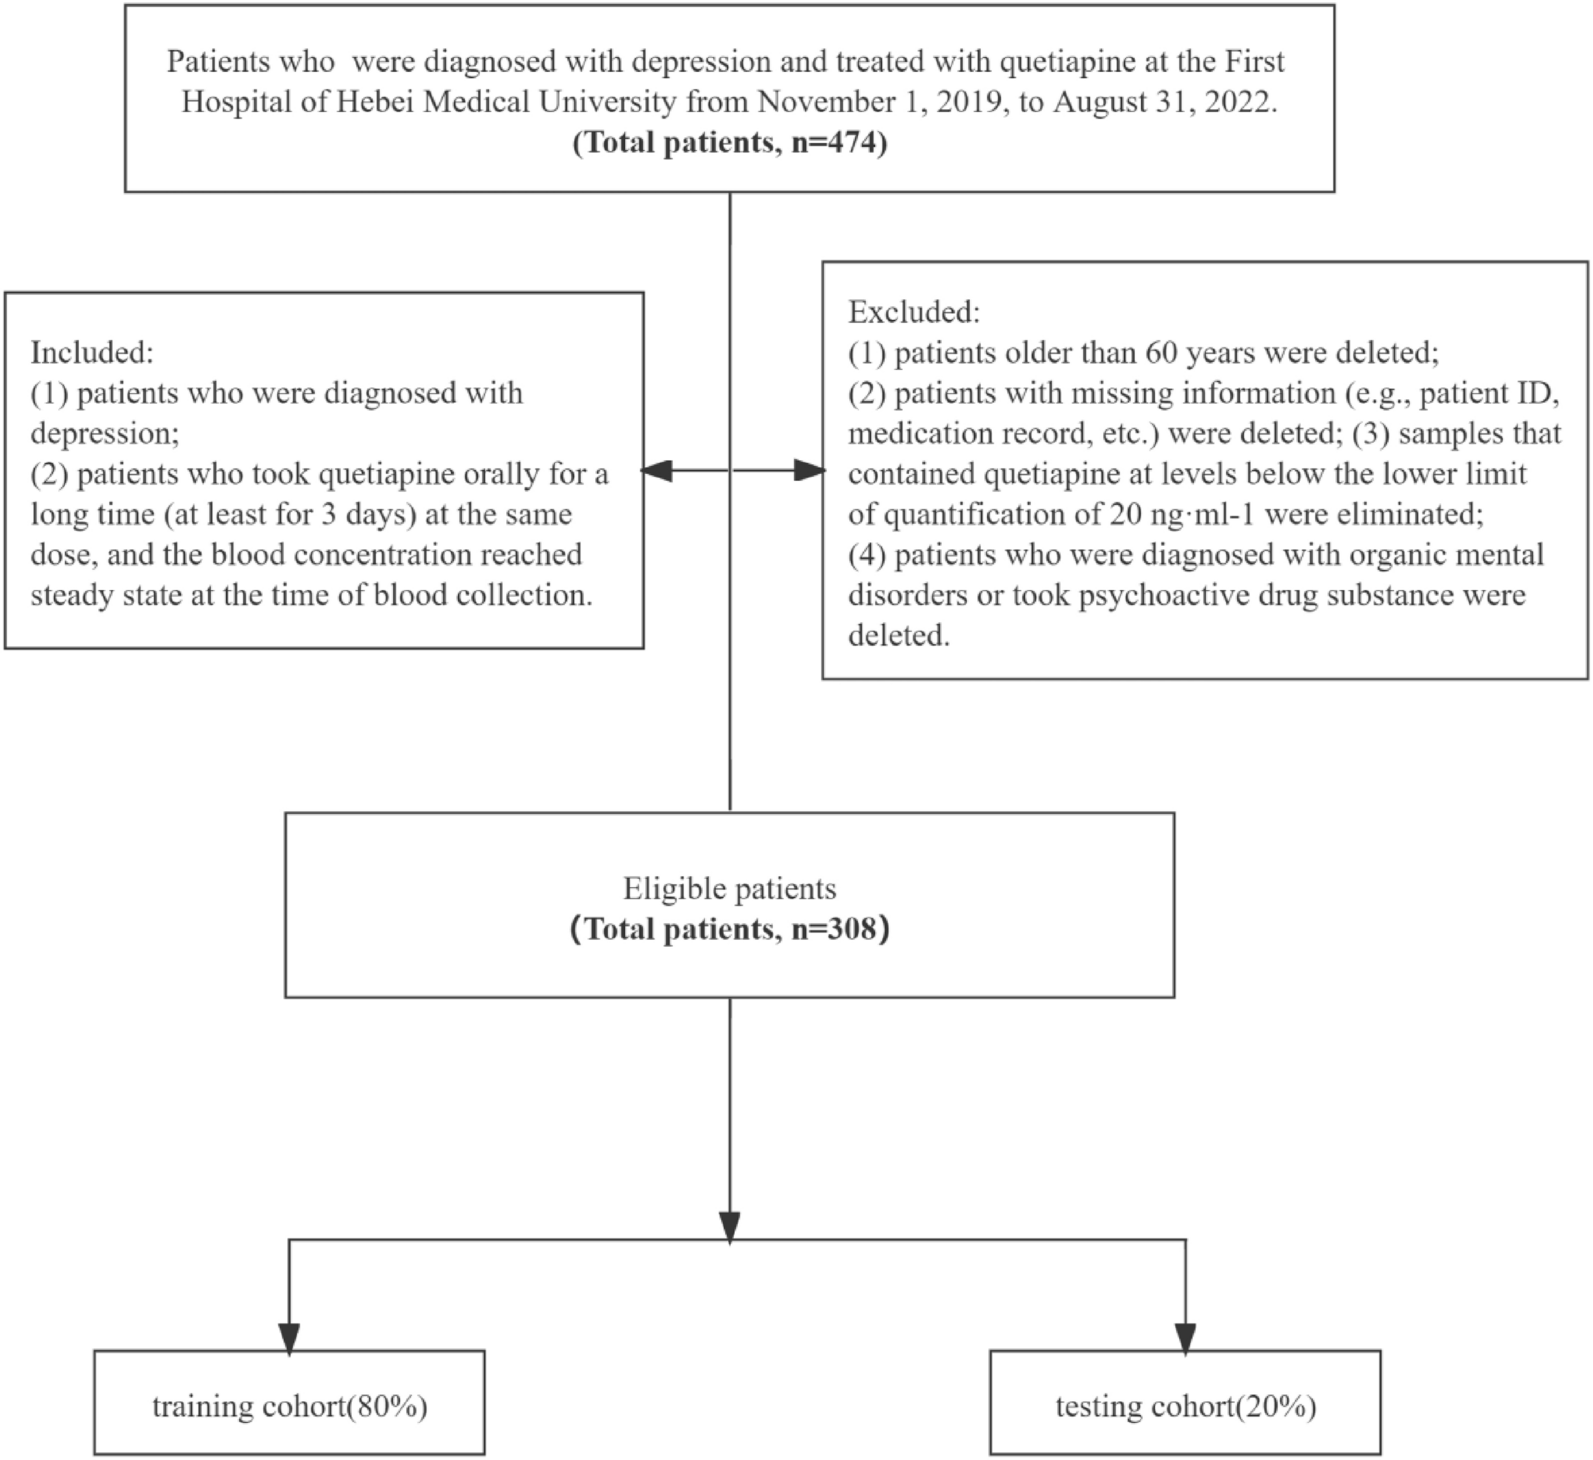
SampleAfter 35 cases were excluded (see Fig. 1 for details), the final sample consisted of 175 individuals, 90 of whom were former participants of the “Benefits of Being a Caregiver” study and 85 of whom were anonymous respondents. The process that led to the final sample is shown in Fig. 1. The participants’ mean age was 59.6 years (SD = 14.5, range = 18–89), and most of the participants were female (68.6%). One person reported non-binary gender. Most participants were married (66.3%) and were co-residing with someone (82.3%). For educational level, 36% of the sample had nine or fewer years of education, 39.4% had 10 years, 11.4% had 12 to 13 years, and 13.1% had more than 13 years. About half of the participants (49.1%) were employed.
Fig 1
Flow chart of the sampling process. Notes. MBI-S: Mild Behavioral Impairment Scale; MBI-C: Mild Behavioral Impairment Checklist; K-SEG: Social Desirability-Gamma Short Scale
a Implausible response pattern refers to > 50% of answers not being interpretable because the application of the two-step response format was not consistent with the given instructions
b Items on sociodemographic characteristics were not considered
c Implausible response pattern refers to all items with a score of 0
d Extreme outliers were defined as values that fell outside the range of three times the interquartile range from the first quartile down and the third quartile up. These cases were excluded due to a high probability of psychiatric issues that were not statistically controlled for and might bias the results
InstrumentsDevelopment and description of the Mild Behavioral Impairment Scale (MBI-S)The adapted version of the German MBI-C [32] served as the basis for developing a shortened instrument, as it is available in a self-report version. In a first step, a focus group consisting of a medical doctor, two psychologists, one of whom was also a psychological psychotherapist, and a doctoral student at the Center for Health Services Research in Medicine at the Uniklinikum Erlangen selected items from the 34-item version of the MBI-C in a structured, predefined, 4-step procedure. As an established, valid, and reliable instrument for assessing NPS in neurodegenerative diseases, the Neuropsychiatric Inventory, especially its questionnaire version, the NPI-Q [27, 33], served as the basis for item selection (Step 1). The NPI-Q assesses 12 symptoms (delusions, hallucinations, agitation/aggression, depression/dysphoria, anxiety, elation/euphoria, apathy/indifference, disinhibition, irritability/lability, motor disturbance, nighttime behaviors, appetite/eating), and the aim was to select MBI-C items (one each) that best represented these symptoms with the greatest possible agreement on content. All participants of the focus group made proposals about which items to select, and if there was consensus that one item best represented a symptom of the NPI-Q, it was selected. Otherwise, the decision was discussed further until consensus was achieved. This process resulted in 10 preliminary items. For the symptoms elation/euphoria and nighttime behaviors, no suitable MBI-C items were available, so the original questions were taken from the NPI-Q and adapted for self-report by the focus group (Step 2). The existing 12 items were revised (Step 3). The process included the adaptation of questions for assessing the current status instead of changes from previous behavior, for example, the item “Do you get up more often at night or sleep more during the day than before?” was rephrased as “Do you get up frequently at night and/or do you sleep a lot during the day?” (Step 3, part 1). In order to avoid ambiguous answers when all the specific symptoms in a question applied versus only some, the symptoms within an item were linked with the wording “and/or.” Items were analyzed and shortened if necessary to reduce ambiguity when a question contained many specific symptoms (Step 3, part 2). For example, “Do you feel very tense, having developed an inability to relax, or shakiness, or symptoms of panic?” was rephrased as, “Do you feel tense in the sense that you are no longer able to relax properly?” Some items were toned down to increase acceptability, for example, the item “Do you believe you are in danger or that others are planning to hurt or steal from you?” was rephrased as “Does it sometimes seem to you that something is going on even though it can’t really be?” (Step 3, part 3). For the MBI-S, the two-step response format of the MBI-C was retained and adapted to the NPI-Q response format and observation period (Step 4). The first step assesses whether a symptom is present, and if it is, a three-level severity score (1 = mild, 2 = moderate, 3 = severe) is additionally assigned, and respondents are asked to indicate the severity of each symptom. In accordance with the NPI-Q, symptoms must have been present in the last four weeks. This time period is shorter than the period of six months used in the MBI-C but can be justified by its better suitability for repeated measurements and higher sensitivity for short-term changes. Furthermore, the MBI-S was not developed to diagnose MBI. The total score ranges from 0 to 36 with higher scores indicating more severe behavioral impairment.
Additional measurementsTo be able to compare mild behavioral impairment with the original concept, the German version [32] of the MBI-C [20] was used. The instrument consists of 34 items that assess five domains: decreased motivation (6 items; e.g., “Have you lost interest in friends, family, or home activities?”), emotional dysregulation (6 items; e.g., “Have you become less able to experience pleasure), impulse dyscontrol (12 items; e.g., “Have you become more impulsive, seeming to act without considering things?”), social inappropriateness (5 items; e.g., “Do you lack the social judgment you previously had about what to say or how to behave in public or private?”), and abnormal perception or thought content (5 items; e.g., “Have you developed beliefs that you are in danger or that others are planning to harm you or steal your belongings?”). Each item is rated for its presence or absence in the last 6 months. The severity of each symptom that was present in the last six months and represents a change from previous persistent behavior is rated on a three-point scale ranging from 0 (mild; significant but without major change) to 3 (severe; very marked or major, dramatic change). The maximum possible overall score on the MBI-C is 102, with a higher score indicating greater behavioral impairment.
Participants’ maladaptive coping behavior was assessed with the German version [34] of the Brief Coping Orientation to Problems Experienced Inventory (Brief COPE; [35]). The Brief COPE contains 28 items from 14 scales that are rated on a four-point scale ranging from 0 (not at all) to 3 (very). To assess maladaptive coping, the scores of six of the scales (“venting, “denial,” “substance use,” “behavioral disengagement,” “self-distraction,” “self-blame”) were combined [36]. The total score ranges from 0 to 36 with higher scores indicating that respondents are more likely to use maladaptive coping strategies.
Loneliness was assessed with the German version [37] of the Three-Item Loneliness Scale [38]. The instrument comprises three items that are rated on a three-point scale ranging from 0 (rarely) to 2 (often). The total score ranges from 0 to 6, with higher scores indicating greater loneliness.
Social desirability was assessed with the Social Desirability-Gamma Short Scale (K-SEG; [39]). The instrument contains three items from each of the two scales “exaggerating positive qualities” (PQ+) and “minimizing negative qualities” (NQ-). Items are answered on a five-point scale ranging from 0 (doesn’t apply at all) to 4 (applies completely). For the analysis, the items of the NQ- subscale were inverse coded. The social desirability scores were computed separately for each subscale by calculating the mean score of the three items of each subscale. The scores ranged from 0 to 4, with higher scores indicating a greater tendency to give socially desirable answers to self-report items.
Other measuresSociodemographic and background characteristics were also assessed. These included, for example, participants’ age and gender, employment, educational level, as well as living situation (co-residing, yes or no). All instruments were administered in German.
Statistical analysisDescriptionWe calculated the mean, median, and standard deviation for descriptive analyses.
Reliability and item analysisWe calculated Cronbach’s alpha as a measure of internal consistency reliability. Cronbach’s alpha was calculated for the overall score. According to Krebs and Menold [40], an alpha of 0.70 or higher is acceptable, and a value of 0.80 or higher is desirable as an indicator that a scale is well-designed. After the item analysis, the difficulty index and discriminatory power were calculated at the item level. While Döring and Bortz [41] recommended an interval from 0.20 to 0.80 for the difficulty index, the discriminatory power was calculated as a deleted item-total correlation. According to Döring and Bortz [41], a discriminatory power of 0.30 to 0.50 can be classified as moderate and a discriminatory power of > 0.50 as high.
All items from the final version of the MBI-S should be important for creating a total score on the basis of psychometric criteria. For this purpose, the internal consistency and the component structure were analyzed. According to a first criterion, items were excluded if Cronbach’s alpha “if item deleted” was higher than the alpha value for the whole scale and their discriminatory power was below 0.30, i.e., they did not differentiate well between individuals with high and low behavioral impairment, that is, they did not capture the target construct well [41].
Principal component analysisTo examine the correlation matrix of the MBI-S items, we performed a principal component analysis (PCA). Requirements for PCA were checked with the Kaiser-Meyer-Olkin measure of sampling adequacy, for which a value of at least 0.50 is recommended and a value greater than 0.80 is desirable [42]. In accordance with the Kaiser criterion, only components with eigenvalues > 1 were considered. To determine the number of components to be extracted, a scree plot of the distribution of the eigenvalues was considered, and a parallel analysis [43, 44] was performed. Parallel analysis is used to determine the number of components to retain by comparing the empirical eigenvalues with eigenvalues calculated from randomly generated correlation matrices and retaining only components whose eigenvalues are larger than the corresponding random eigenvalues [44]. In accordance with Backhaus et al. [42], we defined a loading ≥ 0.50 as the criterion for assigning a variable to a component.
According to a second criterion, to ensure the psychometric quality of the MBI-S, items were removed from the scale if they did not have a loading of at least 0.50 on any of the extracted components.
ValidityThe following hypotheses (H) were tested with regard to convergent (H1 to H3) and discriminant validity (H4):
H1Because the MBI-S and MBI-C [20] were developed to measure the same construct, the two scales were expected to be positively correlated at a high level.
H2Preliminary results indicated a moderate positive correlation between the MBI-C score and the use of negative coping strategies, for example, avoidance [24]. Therefore, a positive correlation between the MBI-S and maladaptive coping captured by the Brief COPE was expected.
H3Meta-analytic results indicated that loneliness is moderately correlated with depression [45] and psychotic symptoms [46]. It also has small to moderate relationships with sleep problems both cross-sectionally and longitudinally [47, 48]. Similarly, strong correlations between loneliness and anxiety have been reported in older individuals [49], further supporting the hypothesis of a relationship between loneliness and NPS. Therefore, a positive correlation was expected between the MBI-S and the Three-Item Loneliness Scale.
H4Previous studies have reported that the number of years of education was only unimportantly and non-significantly related to the MBI-C score [29]. This finding indicates that MBI is independent of the respondent’s educational level. Therefore, we expected no relationship between the MBI-S score and educational level.
To test H1, H2, and H3, the correlations between the MBI-S score and the metric variables were computed as Pearson correlation coefficients (r). To test H4, Spearman’s non-parametric rank correlation coefficient (rs) was calculated. According to Döring and Bortz [41], correlations greater than 0.50 are considered high, those between 0.30 and 0.50 are moderate, and those between 0.10 and 0.30 are low. Correlations of less than 0.10 indicate that there is no relevant association. To control for the accumulation of the alpha error from multiple testing, we applied the Benjamini-Hochberg correction [50].
The correlation of the MBI-S score with the sex of the respondents was examined by calculating the point-biserial correlation coefficient (rpb). As self-ratings have often been shown to be confounded with the social desirability response bias [51], the relationship between the MBI-S and the K-SEG was assessed. Therefore, the MBI-S score’s correlations with the PQ + and NQ- subscales of the K-SEG were calculated as Pearson correlation coefficients.
IBM SPSS version 28 for Windows was used for all statistical analyses. The alpha level was set to 5%.
Comments (0)