
Remember me
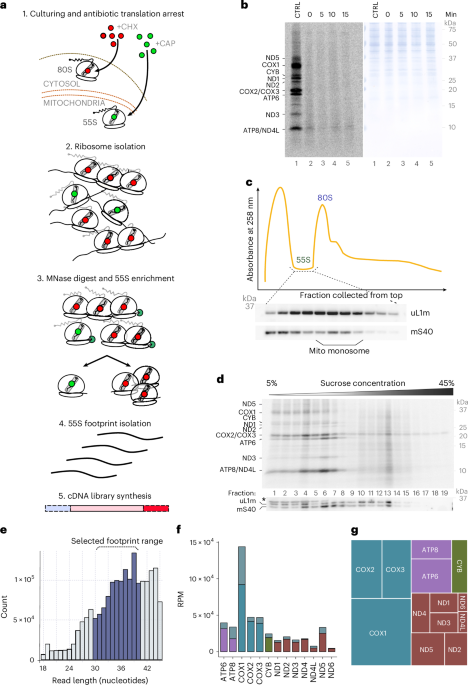
Mitochondrial-encoded polypeptides are cotranslationally inserted into the inner membrane. The ability to map the positioning of mitochondrial ribosomes on the translated mRNAs represents a powerful strategy to investigate mitochondrial protein biogenesis. Therefore, we established a ribosome profiling approach to address the mechanism of translation-coupled protein insertion. In particular, we adapted the established ribosome profiling and data analysis protocols of Bertolini et al.19 to meet the requirements for investigation of mitochondrial translation. Specifically, translation in HEK293 cells was arrested by addition of chloramphenicol (CHL) and cycloheximide or by snap-freezing cells in liquid nitrogen. Cell lysates were digested by micrococcal nuclease (MNase) and ribosome populations were separated using sucrose gradient ultracentrifugation. Mitochondrial ribosome fractions were collected and ribosome protected footprints were isolated by phenol–chloroform extraction before library preparation and sequencing (Fig. 1a)19.
Fig. 1: Footprint isolation and profiling of mitochondrial mRNAs. The alternative text for this image may have been generated using AI.
a, Schematic representation of the procedure of our ribosome profiling approach. b, In vivo [35S]methionine labeling of mitochondrial translation products in wild-type cells. Proteins were separated by SDS–PAGE followed by western blotting (right; Coomassie staining) and digital autoradiography (left). Mitochondrial translation was stalled with CHL at indicated time points. The control sample was lacking CHL (n = 2). c, Absorption profile of average 5–45 % sucrose gradient separating mitochondrial and cytosolic ribosomes. Mitochondrial monosome was detected by western blotting with indicated antibodies (n = 6). d, [35S]methionine labeling of mitochondrial translation products in purified mitochondria. Mitochondrial translation was terminated by addition of CHL, solubilized and MNase-digested. Proteins were separated on a sucrose density gradient, fractionated and analyzed by SDS–PAGE followed by digital autoradiography. The presence of ribosomal subunits was detected by western blotting with indicated antibodies (n = 3). e, Size distribution of isolated sequenced ribosomal footprints presented as bar graphs (y axis, number of reads for each frame; x axis, footprint size range). f, Number of ribosomal footprints isolated from CHL-treated cells for each mRNA represented as reads per million sequenced reads. Gray bar, number of footprints aligning to first 15 codons; colored bars, number of footprints aligning to codon 16 and downstream. (Extended Data Figs. 1 and 2). g, Tree map of isolated footprints aligning to mitochondrial transcripts sorted to indicate number of isolated footprints in relation to OXPHOS association: purple, CV; blue, CIV; green, CIII; red, CI (n = 3).
Accurate translatome analysis that provides positional information of ribosomes along the translated mRNA requires efficient and immediate stalling of translation during cell harvest, for example, by antibiotic treatment. To minimize ongoing translation during cell harvest, we first addressed the mitochondrial translation elongation kinetics upon CHL treatment in vivo, by monitoring the production of [35S]methionine-labeled translation products at different time points after antibiotic addition. Translation inhibition by CHL stalled translation with fast kinetics. Upon parallel addition of [35S]methionine and CHL, mitochondrial translation was efficiently blocked. A full block of translation was apparent after more than 5 min of treatment (Fig. 1b). Therefore, we selected a time of 10 min of treatment for further experiments.
The protocol for ribosome profiling described above enabled enrichment of ribosome footprints, generated by MNase digestion of HEK293 cell lysate. Following MNase treatment, we applied sucrose gradient separation to selectively enrich mitochondrial monosomes from HEK293T cells (Fig. 1c). As the low mitochondrial rRNA content and the low abundance of mitochondrial ribosomes did not allow for detection using 254-nm absorbance, we monitored mitochondrial monosome distribution by western blotting of the gradient fractions. Under the chosen conditions, mitochondrial monosomes were detected in fractions 10–16 of the gradient, above cytosolic monosomes (Fig. 1c).
To support that we faithfully isolated translating monosomes, we performed sucrose gradient centrifugation of MNase-digested mitochondrial lysates after in-organelle translation in the presence of [35S]methionine. Both the CHL-treated mitochondria and the control displayed similar separation patterns of RNCs (Fig. 1d and Extended Data Fig. 1a).
To profile translation, footprints of mitochondrial monosomes were isolated from the relevant sucrose gradient fractions and subjected to library preparation and deep sequencing. Upon bioinformatic analysis, we noticed that footprints of different sizes were recovered from the mitochondrial ribosomes (Fig. 1e). These variations of footprints were previously observed for mitochondrial profiling20,21,22,23,24,25. For further analyses, we selected 30–40-nt footprints on the basis of previous studies and available structural data on active ribosomes (Fig. 6)25. For our analyses, we adapted the mitochondrial genome to take into account that the transcripts undergo post-transcriptional modification, such as processing and polyadenylation, which generates the STOP codon in case of the transcripts encoding ND1, ND2, ND3, ND4, CYTB, COX3 and ATP6 (ref. 26). In addition, we provided the two bicistronic transcripts (ATP8–ATP6 and ND4L–ND4) as single open reading frames for genome alignment (Extended Data Fig. 1b). Applying a footprint frame of 30–40 nt, all mitochondrial mRNAs were present in our dataset (Fig. 1f,g). Most reads were obtained from transcripts encoding complex IV (CIV) subunits with approximately 49% of all reads (COX1, 20%; COX2, 15%; COX3, 13%). Transcripts encoding subunits of other OXPHOS complexes contributed with 30% (complex I, CI), 5% (complex III, CIII) and 17% (complex V, CV) (Fig. 1f,g). Read counts of individual transcripts normalized by library size and transcript length, expressed as reads per kilobase of transcript per million mapped reads (RPKM), resembled approximately the translation profile observed upon [35S]methionine labeling of mitochondrial translation products (Fig. 2a,b).
Fig. 2: Assessment of mitochondrial translation. The alternative text for this image may have been generated using AI.
a, Number of ribosomal footprints isolated from each mRNA represented as RPKM. Colored bars indicate OXPHOS complex origin: purple, CV; blue, CIV; green, CIII; red, CI (n = 3). b, [35S]methionine labeling of mitochondrial translation products in cells analyzed by SDS–PAGE and digital autoradiography (n = 3). c,d, Mitochondrial metagenes analysis from CHL-treated cells: first 100 codons from the 5′ start (c) and 100 codons upstream of the 3′ stop codon (d); error is indicated by the shading in line color (n = 3). e,f, Isolated footprints aligning to ATP8–ATP6 (e) and ND4L–ND4 (f) obtained from CHL-treated cells (n = 3). Confidence is indicated as opacity (Extended Data Fig. 2).
To reveal common patterns of read abundances among transcripts, we aligned all mRNAs at their start or their stop codon and averaged read densities of all mRNAs creating a metagene ribosome distribution profile that represents all mitochondrial translation events. Figure 2c,d reveals ribosome read densities downstream of the 5 start codon (Fig. 2c) and upstream of the 3′ stop codons (Fig. 2d). Increased read densities were found at the 5′ start codon, spanning an average distance of ten codons (Fig. 2c). Reads also accumulated toward the 3′ stop codon of transcripts, whereas, shortly upstream of the stop codon, a drop in read density was observed (Fig. 2d).
Metagene profiles showed ribosome enrichment ~10 codons after the start (Fig. 2c) and before the stop of the drop (Fig. 2d). Individual transcripts (Extended Data Fig. 2a–m) confirmed strong initiation pausing, strongest for COX1 (37% reads in first ten codons); bicistronic overlaps were noted for ATP8–ATP6, ND4L–ND4 (Fig. 2e,f). The 3′-end read reduction suggests accelerating elongation. Thus, 30–40-nt footprints with a modified genome enable precise mitochondrial translation assessment.
In organello silencing affects ribosome occupancy on target mRNAsTranslation of selected mRNAs can be blocked by importing a precursor–morpholino chimera into purified mitochondria. For this, chimeras consisting of a mitochondrial precursor protein (Jac1) fused to a polymorpholino directed against a mitochondrial mRNA are imported into mitochondria where the morpholino interacts with the cognate transcript to block translation17. We reasoned that combining the ribosome profiling approach with morpholino-based knockdown (KD) is ideally suited to address the mechanism of translational silencing while also validating the technical quality of the pipeline. Therefore, we imported chimera directed against either COX1, COX2 or ND2 mRNA into purified mitochondria. We used morpholinos targeting nucleotides 1–19 of COX1, 1–23 of COX2 or 12–29 of ND2 mRNAs. Previous data indicated that morpholino chimeras efficiently reduced the synthesis of the corresponding newly synthesized polypeptide without significantly changing the expression of other mRNAs17. We performed ribosome profiling from mitochondria purified under the chimera-treated conditions. The presence of chimera in mitochondria reduced the expression levels displayed in RPKM of COX1 and COX2 mRNAs by 70% and 60%, respectively, when compared to the control sample (Fig. 3a). At the level of newly synthesized polypeptides, the chimera treatment efficiently reduced the amount of newly made COX1 and COX2 proteins17. For both, COX1 and COX2, the use of the respective morpholinos resulted in a reduction of ribosome densities throughout the transcript of the target mRNA (Fig. 3e,f). The presence of COX11−19 chimera in mitochondria resulted in higher normalized read counts on all other mRNAs; however, we cannot rule out that this was a consequence of the relative reduction of normalized reads on COX1 (Fig. 3d,f and Extended Data Fig. 3). On the other hand, the presence of COX21−23 resulted in more complex changes in translation. Here, total normalized reads on most other transcripts were reduced, with the exception of COX1, COX3 and ND2, which displayed the opposite effect. Curiously, we observed an increased ribosome abundance close to the start codon for most of the other transcripts not targeted by the COX21−23 morpholino and reduced ribosome density downstream of this region (Fig. 3c,i). This effect was especially pronounced for COX1 when COX2 translation was blocked, where the overall read density increased and the densities of reads located downstream of codon 15 were falling below control (untreated) levels toward the 3′ end, with the exception of reads aligning close to the stop codon (Fig. 3c). In summary, the ribosome profiling data support that chimera treatment reduces target translation in mitochondria. Interestingly, in the case of blocked COX2 translation, effects on translation of other mitochondrial transcripts were observed. This finding agrees with previous radiolabeling analyses of mitochondrial translation products in the presence of COX2 chimera17. Similarly, ND212−29 morpholino treatment reduced ribosome occupancy on the ND2 transcript (Fig. 3a,d,g,j), serving as a CI control that behaved comparably to COX2 silencing without additional inter-mRNA effects We conclude that the established pipeline faithfully provides information on mitochondrial gene expression.
Fig. 3: Profiling upon in organello silencing. The alternative text for this image may have been generated using AI.
a, Purified mitochondrion were subjected to chimera-mediated (KD COX11−19, KD COX21−23 and KD ND212−29) silencing or left untreated. The number of ribosomal footprints isolated from each mRNA is represented as RPKM (n = 3). Gray, control sample; blue, KD COX1−19; aquamarine, KD COX21−23; red, ND212−29. b,e,h, Footprint isolations visualized as enrichment over control plots of the indicated mRNAs upon KD COX11−19 silencing (one representative replicate; n = 3; Extended Data Fig. 3) c,f,i, Footprint isolations visualized as enrichment over control plots of the indicated mRNAs upon KD COX21−23 silencing (one representative replicate; n = 3; see Extended Data Fig. 4) d,g,j, Footprint isolations visualized as enrichment over control plots of the indicated mRNAs upon KD ND212−29 silencing (one representative replicate; n = 3; Extended Data Fig. 5).
Identification of translational pausing by ribosome profilingWork on COX1 translation identified an RNC complex paused at a stage when the nascent COX1 is partially inserted into the IMM2. In the membrane, the nascent COX1 is associated with the protein insertase OXA1L and biogenesis factors such as the COX1-specific assembly factor C12ORF62 (COX14) and MITRAC12 (COA3)2,13,17,27. Upon translation of mitochondrial-encoded polypeptides in purified mitochondria, translation intermediates of COX1 could be detected, which were lost in the presence of chimera affecting specifically the COX1 translation (Fig. 4a, lane 2). As compared to previously visualized translation intermediates, we were able to resolve two additional fragments: one migrating slower than ND3 and one early translation product migrating faster than ND4L and ATP8 (Fig. 4a). Translation intermediates of COX1 were efficiently coimmunopurified with C12ORF62FLAG (Fig. 4b). To define translation intermediates of COX2, we treated mitochondria with COX2 chimera to specifically block COX2 translation. Indeed, we identified a prominent specific translation intermediate of COX2 that was lost upon COX2 silencing (Fig. 4a, lane 4). While COX1 spans the inner membrane with twelve transmembrane domains and exposes both termini to the matrix, COX2 exposes C and N termini into the intermembrane space while spanning the membrane twice. Moreover, translation intermediates of the CI subunit ND2, which were sensitive to treatment with ND212−29 morpholino (Extended Data Fig. 5), were efficiently coimmunopurified with MITRAC15FLAG (COA1) (Fig. 4c, lanes 3 and 4). In addition, we observed a specific translation intermediate of ATP8 of 3.6 kDa (ref. 28) that was sensitive to chimera treatment (Extended Data Fig. 1c).
Fig. 4: Ribosome pausing correlates with TMH incorporation. The alternative text for this image may have been generated using AI.
a, [35S]methionine labeling was performed in purified mitochondria in the presence or absence of indicated morpholino chimera targeting COX1 (blue circles) or COX2 (light green). Samples were analyzed by SDS–PAGE, followed by digital autoradiography (n = 3; profiling results in Fig. 3 and Extended Data Figs. 3 and 4). b, [35S]methionine labeling was performed in purified mitochondria in the presence or absence of COX11−19 morpholino. Samples were subjected to coimmunoisolation using C12ORF62FLAG as bait. Samples were analyzed by SDS–PAGE, followed by digital autoradiography (n = 3). c, [35S]methionine labeling was performed in purified mitochondria in the presence or absence of ND212−29 morpholino. Samples were subjected to imunoisolation using MITRAC15FLAG (COA3) as bait. Samples were analyzed by SDS–PAGE, followed by digital autoradiography (n = 2). d, Representative footprint alignment profiles of COX1, COX2 and ND2 mRNA. Dotted lines in blue, yellow and red correspond to polypeptide fragments of COX1 COX2 and ND2 identified in a–c, respectively. Bars indicate structural features of polypeptides. Dark gray, TMHs; blue, orange and red, topological regions. Cartoons to visualize differences in pausing on codons and fragment length are indicated with red arrows in mRNA profiles (one representative replicate; n = 3; Extended Data Fig. 2–5).
Profiling data of the respective mRNAs COX1, COX2 and ND2 presented translational pausing events corresponding to the identified fragments (Fig. 4d). The distribution of ribosomes on the COX1 mRNA showed expected pausing sites, for example, at codons 180 and 230 (Fig. 4d, left). COX2 had a lower number of pausing sites. Interestingly, one major pausing site fell onto codons 92/93 correlating to the tunnel emergence of the second TMH (Fig. 4d, middle). On the contrary, ND2 mRNA translation showed several sites with increased read amounts, particularly three major accumulations at codons 92/93, 144/145 and 305/306, corresponding closely to the identified fragments. Unfortunately, the two early translation intermediates of ND2 were of similar size as ND3 and ND4L and could, therefore, not be identified in the radiolabeling analysis (Fig. 4c, light-red circles). Lastly, the observed ATP8 fragment corresponded to increased reads at codons 35–38 (Fig. 2e).
Applying C12ORF62 (COX14) immunoprecipitation, nascent chain fragments of COX1 have been identified and estimated in their length2,17,27. All of these identified COX1 fragments—with estimated amino acid lengths of below 170, 212 and 280—matched areas with an increased accumulation of reads. Investigation on codon level revealed that the fragments f3 (280 aa) and f2 (212 aa) aligned directly with paused codons in the P-site (Fig. 4d). The third fragment f1 (~170 aa) fell between two minor pausing events. Yet, the fragment length estimation by SDS–PAGE is error-prone because of the properties of the hydrophobic polypeptide and, therefore, cannot be perfectly linked to fragments identified with codon precision in the profiling approach. Next, we aligned the transmembrane domains (black) of COX1 and COX2 and their connecting loop regions (blue, COX1; dark orange, COX2) to the moment of their decoding (Fig. 4d). A high number of reads aligned to early codons of TMHs (black), suggesting translation pausing, in agreement with observed translation fragments2. Further toward the 3′ ends of the mRNAs, the pausing sites no longer displayed a notable overlap with the start of TMH translation (Fig. 4d). In the case of the COX2 mRNA, notable ribosome pausing was observed for codons 92/93, in agreement with the size of the COX2 chimera-sensitive fragment identified in in organello translation (Fig. 4a). Similar to COX1 and COX2 translation profiles, the translation profile of ND2 displayed read accumulations corresponding to fragments identified by in organello translation. Two small identified fragments strongly correlate to pausing at codons 92/93 and 144/145 (light red) and larger fragments matching less abundant read pausing sites close to codon 300 and one major site at codon 306 (Fig. 4c,d). A common feature of the nascent chains of all three mRNAs was their correlation of pausing events with the emergence of a topological region linking two TMHs (from now on, only topological region) from the ribosomal exit tunnel or vestibule (Fig. 4d, red dotted arrows). In summary, the ribosome profiling data recapitulated translation intermediates of COX1 and COX2 observed at the protein level.
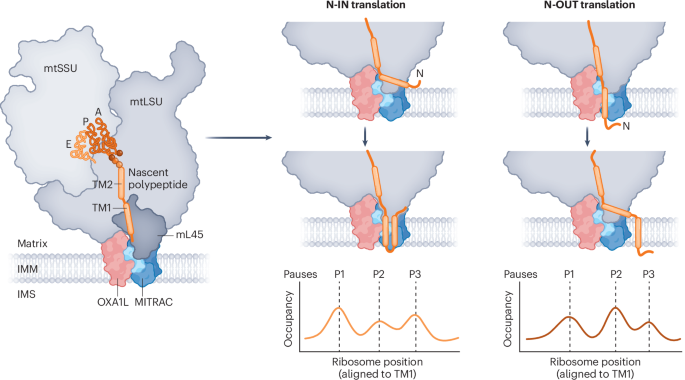
Protein topology links to decoding speedAll human mitochondrial translation products represent proteins that span the inner membrane. On the basis of their topology, these proteins can be classified into two groups, a first one in which the N terminus faces the matrix (N-in) and a second in which the N terminus faces the intermembrane space (N-out) (Fig. 5b). We reasoned that cotranslational insertion of the polypeptide chain should present different challenges to the process depending on the topology of the polypeptide’s N terminus. While proteins with N-out topology can be directly inserted into the lipid phase (Fig. 5a, right; ND1), proteins with N-in topology must undergo a topology switch to generate a loop and maintain the N terminus in the matrix (Fig. 5a, left; COX3). On the basis of the profiles of mRNAs with N-in topology, we speculated that the establishment of a correct nascent chain topology in the context of the environment provided by exit tunnel, membrane and hydrophobicity of the TMHs impacted translation elongation rates. To address whether translation in mitochondria was linked to the insertion process, we categorized all proteins depending on their topology, aligned them at the beginning of their first TMH and performed metagene analysis (Fig. 5c). This analysis enabled us to synchronize positional footprint data downstream of the decoding start of the first TMH. When applying a minimal averaged density threshold of 200, on average, two major ribosome density accumulations and pauses were present near codon ~30 (TMH N terminus arrives at vestibule) and a second at codon ~78 (second TMH N terminus arrives at vestibule) for N-in and N-out proteins (Fig. 5c,d; I–IV). For N-in polypeptides, one additional accumulation could be resolved at codon ~15, whereas, for N-out polypeptides, one additional accumulation could be resolved at codon ~55 (Fig. 5a,c,d). Interestingly, the accumulations identified at positions 15 (N-in), 30, 55 (N-out) and 78 repeat after roughly 50 codons in a similar pattern for both groups. Yet, for the N-out group, the density accumulation downstream of codon 50 was increased. Accordingly, translation of mRNAs encoding the two classes of proteins with different topologies appear to differ. On the basis of our data, we concluded that alterations in the topology of the newly synthesized polypeptide chain are imprinted in the translation process probably because of the requirement of hairpin loop formation before membrane insertion (Fig. 5c,d).
Fig. 5: Translation speed adapts depending on insertion of TMH. The alternative text for this image may have been generated using AI.
a, Read alignment of COX3 (left; blue) and ND1 (right; orange) as representative mRNAs with N-in and N-out topology (n = 3). Bars indicate the structural features of transcripts. Dark gray, TMHs; blue, topological region (Extended Data Fig. 2). b, Schematic presentation of translation products in the inner membrane. c, Metagene alignments for mRNAs aligned at the first codon encoding the first TMH filtered into groups on the basis of N terminus topology. Blue, N terminus retained in matrix (left; N-in); orange, N terminus translocated to IMS (right; N-out). Normalized ribosome densities are displayed on the y axis of three biological replicates (n = 3). d, Schematic representation of TMH insertion events identified in c. Left, insertion of N-in proteins (blue). Right, insertion of N-out proteins (yellow). Matching events in c,d are denoted by similar background coloration.
Cryo-EM of COX1-translating RNC–OXA1L/MITRAC complexesTo assess how translation is coupled to membrane insertion in mitochondria at the molecular level, we visualized COX1-translating mitochondrial ribosome–nascent chain complexes by cryo-EM (COX1–mtRNC) (Figs. 6 and 7). In mitochondria, COX1 represents the most translated transcript; therefore, COX1–mtRNC complexes are expected to represent the largest population of mtRNCs (Fig. 2a). In the COX1–mtRNC complexes, the partially membrane inserted nascent chain is in complex with assembly factors C12ORF62 and MITRAC12, as well as the OXA1L insertase and probably other membrane proteins such as TMEM126A (ref. 18). Therefore, we refer here to the complexes as COX1–mtRNC–OXA1L/MITRAC complexes. Complexes were prepared for cryo-EM using a FLAG-tagged version of C12ORF62 (C12ORF62FLAG), which allows selective purification of COX1–mtRNC–OXA1L/MITRAC (Figs. 6b and 7a and Methods). In contrast to our previous biochemical work, we used the detergent PCC (4-trans-(4-trans-propylcyclohexyl)-cyclohexyl α-maltoside) instead of digitonin to extract complexes from purified mitochondria.
Fig. 6: Structure and dynamics of human COX1-translating mtRNC–MITRAC complexes. The alternative text for this image may have been generated using AI.
a, Cryo-EM maps of COX1–mtRNCs in different states of translation, shown as cross-sections (from left to right): post-translocation state (P), classic pretranslocation state (AP), intermediate state (AP*) and tRNA hybrid states (H1 and H2). A, P and E, tRNA binding sites; NC, COX1 nascent chain; mL, proteins of mtLSU; L1, L1 stalk of LSU; head and body, head and body of SSU. b, Purification of COX1-translating mtRNCs for cryo-EM using C12ORF62 as bait. MITRAC COX1 assembly intermediate and mtRNC–OXA1L/MITRAC were purified by C12ORF62FLAG immunoisolation and analyzed by SDS–PAGE and Coomassie staining (n = 1). mtRPs, mitoribosomal proteins; C12ORF62 and MITRAC12, assembly factor-components of the MITRAC complex2,14. c, Average cryo-EM map of COX1–mtRNC (close-up view). Note the scattered density at the tunnel exit (circle) indicating incomplete occupancy with membrane-integral OXA1L/MITRAC. d, COX1–mtRNC–OXA1L/MITRAC complexes sample two distinct conformational states. Left and middle, cryo-EM maps of COX1–mtRNC–OXA1L/MITRAC complexes in closed and open states obtained by sorting of cryo-EM data in exit area (circle in c), lowpass-filtered to 6-Å resolution for clarity. Top right, a rotational movement opens up the region between membrane-integral OXA1L/MITRAC and mtRNC. IMM, schematic of IMM indicating approximate orientations; CP and L7/12, central protuberance and L7/12 stalk of the LSU, respectively.
Fig. 7: Cotranslational folding at the tunnel exit in COX1–mtRNC. The alternative text for this image may have been generated using AI.
a, Interactions of insertase OXA1L with mtLSU in COX1–mtRNC–OXA1L/MITRAC. Left, close-up views of OXA1L contact sites in the open state. Semitransparent mesh, experimental densities filtered to local resolution; CTH and CTE, C-terminal helix and extension of OXA1L, respectively. Right, overview. b, Experimental density for vestibule region in open COX1–mtRNC–OXA1L/MITRAC, indicating cotranslational folding of the COX1 nascent chain (blue). Semitransparent mesh, cryo-EM density lowpass-filtered to 6 Å and rendered at high threshold (5σ). c, Nascent chain path in the open COX1–mtRNC–MITRAC. Close-up view of tunnel exit with COX1 nascent chain folding into an α-helical element in the vestibule formed by uL23m, uL24m and mL45. The dashed line indicates the potential path of the nascent chain towards OXA1L/MITRAC. Molecular model surfaces are shown in semitransparent representation. d, Ultrawide view of the amphipathic vestibule in the open state colored according to lipophilicity potential, shown from top. e, Schematic comparison of the amphipathic vestibule (top) and the amphipathic properties of COX1 N-terminal α-helix (α0) and TMH1–TMH3 (bottom). f, Nascent-chain-dependent dynamics of the vestibule region. From left to right: mitochondrial ribosome structure in absence of nascent chain (mtRibo; Kummer et al.32 and Itoh et al.4), COX1–mtRNC–MITRAC in the open state, mtRNC–OXA1L complex with unspecified nascent chain Itoh et al.4 and COX1–mtRNC–MITRAC in the closed state. In the closed COX1–mtRNC, mL45 NTT, uL23 linker region and COX1 nascent chain are unresolved in the exit region (‘?’), indicating high flexibility. mL45α, α-helix of mL45 forming in presence of nascent chain4,32. Left insets, cartoons illustrating orientation of mtRNCs relative to membrane. Right insets, schematic cross-sections of vestibule, seen from top. g, Proposed model for coupling of translational stalling with mtRNC structural rearrangements. The plot shows ribosome footprint data of early COX1 translation (average of replicates under cryo-EM conditions). I–III denote different stages of translation. For stage I, schematics depict mL45 blocking the exit tunnel before the onset of translation (left; Kummer et al.32 and Itoh et al.4) and during early translation (right; Koripella et al.44), which may contribute to initial ribosome pausing, providing a window for ribosome docking to OXA1L/MITRAC at the membrane. In stage II, emergence of the COX1 N-terminal α-helix in the vestibule coincides with a second pausing event, which may be facilitated by nascent chain interactions with the vestibule. The opening of the COX1–mtRNC versus OXA1L/MITRAC may create space for binding of auxiliary factors (AFs) and, at longer chain lengths, for cotranslational folding. In stage III, closure of COX1–mtRNC onto the membrane impedes access of AFs from the matrix and may facilitate unhindered translation and nascent chain integration into the membrane by OXA1L/MITRAC. Insets, schematic cross-sections of vestibule. ‘Off’ and ‘on’ denote mL45 conformations that may disfavor or favor OXA1L binding, respectively, as discussed in the text.
By sorting cryo-EM data according to tRNA states, we obtained five structures of mtRNCs in distinct states of translation at 3.0–3.7-Å resolution (Fig. 6a, Extended Data Fig. 6 and Table 1). These structures capture the stepwise movement of tRNAs through the mitochondrial ribosome29, starting with the nonrotated post-translocat
Comments (0)