
Remember me
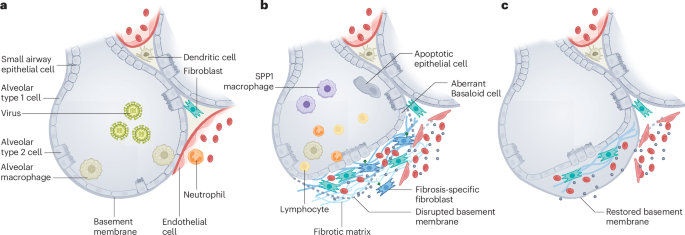


Given the importance of ILC2s in allergic lung inflammation, we considered that Blimp-1 may play a role in ILC2s. Using Blimp-1 YFP reporter mice, we measured the expression of Blimp-1 in ILC2s after chronic house dust mite (HDM) exposure. Blimp-1 was significantly induced in ILC2s and increased with additional doses of HDM, especially on rechallenge (Extended Data Fig. 1a–f). As HDM responses are largely CD4 T cell dependent, we examined papain, a cysteine protease that robustly activates ILC2s14,15. Three days of intranasal (i.n.) papain induced lung inflammation, eosinophil recruitment and ILC2 proliferation (Extended Data Fig. 1g–j). Blimp-1 was robustly expressed after papain as measured by YFP in ST2+ KLRG1+ GATA3+ ILC2 cells (Fig. 1a,b and Supplementary Fig. 1). Proliferation of ILC2s was similar in both Blimp-1-expressing and Blimp-1-nonexpressing populations (Extended Data Fig. 1k). ILC2s activated by papain rapidly produce IL-5 and IL-13. Blimp-1 was not specific to cytokine-expressing cells; however, Blimp-1+ cells produced slightly more IL-5 and IL-13 than Blimp-1− cells (Fig. 1c–e). Similar patterns were observed after HDM, indicating that Blimp-1 is part of the ILC2 effector program (Extended Data Fig. 1l)16. We wondered whether repeated stimulation via HDM drove more Blimp-1 even though ILC2s are rapidly activated to secrete cytokines. We found that papain induced more Blimp-1 than HDM after an equal number of exposures (Extended Data Fig. 1m), suggesting that chronic exposure to HDM promotes more Blimp-1 and that differences between allergens impact the overall expression of Blimp-1.
Fig. 1: Blimp-1 is expressed in lung ILC2s in response to tissue inflammation and helminth infection. The alternative text for this image may have been generated using AI.
a, Representative flow plot of Blimp-1-YFP in ILC2s. b, Quantification of a (n = 3–5 mice per group). c, Representative flow plots of Blimp-1 YFP and IL-5. d, Quantification of IL-5+ (left) or IL-13+ (right) ILC2 from c (n = 5–7 mice per group). e, Percentage of IL-5 and IL-13 expression in Blimp-1 YFP+ ILC2 or Blimp-1 YFP- ILC2 (n = 7). f, Representative flow plots of Blimp-1 YFP in ILC2s isolated after IL-33+IL-25. (n = 3–6 mice per group). g, Quantification of Blimp-1 YFP+ ILC2s from f. h, Representative flow plots of Blimp-1 YFP in ILC2s isolated from N. brasiliensis infection. i, Quantification of Blimp-1 YFP+ ILC2s from h. j, Representative flow plot for iILC2 gating after IL-25 i.p. (n = 4). k, Percentage of Blimp-1 YFP in ILC2 subsets from j. l, Quantification of Blimp-1 YFP percentage (left) or geometric mean fluorescence intensity (gMFI) (right) in nILC2s and iILC2s (n = 4). m, Percentage of Blimp-1 YFP in gut ILC2s after IL-33 and IL-25 i.p. (n = 6) (left) and quantification (right). Each point represents one individual sample. The data are shown as mean ± s.d. and represent two or three independent experiments. A two-tailed, unpaired Student’s t-test was performed for b, d, g, i and m, Šídák’s multiple-comparison test for e and Tukey’s multiple-comparison test for l. *P < 0.05, **P < 0.01, ***P < 0.001, ****P < 0.0001. The specific P values are as follows: for b: P = 0.0001; for d: left, P = 0.0055; right, P = 0.0005; for e: comparison between IL-5, P < 0.0001, comparison between IL-13, P < 0.0001; for g: P = 0.0002; for i: P = 0.0002; for l: left, IL-25 iILC2s versus IL-25 nILC2s, P = 0.0184, IL-25 iILC2s versus naive nILC2s, P < 0.0001, IL-25 nILC2s versus naive nILC2s, P < 0.0001; right, IL-25 iILC2s versus IL-25 nILC2s, P < 0.0001, IL-25 iILC2s versus naive nILC2s, P < 0.0001, IL-25 nILC2s versus naive nILC2s, P < 0.0001; and, for m, P < 0.0001. Nippo., Nippostrongylus brasilensis.
We next tested other settings of ILC2 activation in vivo. IL-33 and IL-25 are alarmins produced in response to helminth infection and allergen inhalation that potently activate ILC2s17. IL-33 and IL-25 i.n. robustly induced Blimp-1 in ILC2s similar to papain and HDM (Fig. 1f–g). To test whether Blimp-1 is expressed in ILC2s responding to helminth infection, we used Nippostrongylus brasilensis as a model that includes infection of both the lung and the gastrointestinal tract18. Similar to the above models, Blimp-1 was expressed in lung ILC2s 5 d after helminth infection (Fig. 1h,i), suggesting that Blimp-1 is universally expressed in effector ILC2s. We next assessed expression of Blimp-1 in inflammatory ILC2s (iILC2s; CD90.2loKLRG1hi) versus natural ILC2 cells (nILC2s; CD90.2hiKLRG1lo). The iILC2s are recruited to the lung from the gastrointestinal tract in response to inflammatory signals and are distinct from nILC2 cells that reside in the lung19,20. The iILC2s were readily found in the lung after IL-25 administration intraperitoneally (i.p.) (Fig. 1j). Blimp-1 was upregulated in both iILC2s and nILC2s; however, iILC2s expressed slightly more Blimp-1 than nILC2s (Fig. 1k,l). ILC2s are also recruited from the bone marrow (BM) and can be blocked with FTY720, an agonist of S1P121. Blocking ILC2 recruitment with FTY720 after IL-33 treatment reduced the total number of ILC2s in the lung, whereas precursors (common lymphoid progenitors, CLP) were increased in the BM (Extended Data Fig. 2a–c). Blocking recruitment of ILC2s did not affect the percentage of Blimp-1+ cells in the lung, despite their reduced number (Extended Data Fig. 2d–f). These data suggested that Blimp-1 is not specific to a subset of ILC2s, but rather expressed as ILC2s differentiate into effector cells, whether they are activated locally in the tissue or recruited from another site. Finally, we assessed Blimp-1 in ILC2s at other tissue sites. Alarmins induced Blimp-1 in intestinal and skin-associated ILC2 populations (Fig. 1m and Extended Data Fig. 2i), suggesting that upregulation is a global feature across barrier and mucosal tissue sites in response to inflammatory tissue alarmins22.
IL-33 and IL-25 indirectly induce Blimp-1 in activated ILC2sWe next asked what factors support the upregulation of Blimp-1 in ILC2s. As IL-33 and IL-25 induced Blimp-1 in ILC2s in vivo, we reasoned that stimulation of ILC2s in vitro with these alarmins may also upregulate Blimp-1. Sorted lung ILC2s from naive Blimp-1 YFP mice were stimulated for 3 d with IL-33 or IL-25, with IL-2 to support cell survival (Supplementary Fig. 2). IL-33 or IL-25 potently induced Blimp-1 in nearly all ILC2s compared to IL-2 alone (Fig. 2a,b). ILC2s sorted from the dermis and small intestine lamina propria (siLP) stimulated with IL-33 also readily expressed Blimp-1 (Extended Data Fig. 2j–m). Time-course analysis demonstrated that IL-33 could induce Blimp-1 as early as 8 h and >50% of ILC2s were Blimp-1+ by 24 h (Fig. 2c,d). However, IL-5 and IL-13 were still detectable before Blimp-1, as early as 4 h after IL-33 stimulation, suggesting that Blimp-1 was not associated with type 2 cytokine expression, in line with expression in vivo in both type 2 cytokine-positive and type 2 cytokine-negative cells (Extended Data Fig. 3a,b). Thymic stromal lymphopoietin (TSLP) and neuromedin U (NMU) are also known activators of ILC2s; however, neither induced Blimp-1 above IL-2 alone (Extended Data Fig. 3c,d).
Fig. 2: IL-33 and IL-25 indirectly upregulate Blimp-1 in ILC2s. The alternative text for this image may have been generated using AI.
a, Histogram for Blimp-1 YFP in ILC2s after stimulation with IL-33 or IL-25 for 3 d. b, Quantification of Blimp-1 gMFI from a (n = 4). c, Histogram of Blimp-1 expression in ILC2s at indicated timepoints stimulated with IL-33 + IL-25. d, Quantification of YFP+ cells in c (n = 4). e, Percentage of Blimp-1 YFP in stimulated ILC2s when treated with JAK inhibitor. f, Quantification of e (n = 4). g, Percentage of Blimp-1 YFP in ILC2s from ST2-deficent and ST2-intact ILC2 cell-mixing experiment. h, Quantification of g. i, Percentage of Blimp-1 YFP in ILC2s from ST2-deficent and ST2-intact ILC2 transwell assay. j, Quantification of i. Each point represents one individual sorting sample from two pooled animals. The data are shown as mean ± s.d. and represent two or three independent experiments. A two-tailed, unpaired Stiudent’s t-test was performed for f, Dunnett’s multiple comparisons test for b, d and j and Tukey’s multiple-comparison test for h. *P < 0.05, **P < 0.01, ***P < 0.001, ****P < 0.0001. The specific P values are as follows: for b: IL-2 versus IL-2 + IL-25, P = 0.0001, IL-2 versus IL-2 + IL-33, P < 0.0001; for d, unstimulated versus 12 h, P = 0.0028, unstimulated versus 18 h, P < 0.0001, unstimulated versus 24 h, P < 0.0001, unstimulated versus 48 h, P < 0.0001; for f, P = 0.0002; for h: ST2-deficent ILC2s, mixed versus ST2-intact ILC2s, mixed, P < 0.0001, ST2-deficent ILC2s, mixed versus ST2-deficent ILC2s only, P < 0.0001, ST2-intact ILC2s, mixed versus ST2-deficent ILC2s only, P < 0.0001; and, for j: ST2-deficent only versus transwell ST2-deficent, P < 0.0001 and ST2-deficent only versus transwell ST2-intact, P < 0.0001. DMSO, dimethyl sulfoxide; Unstim, unsimulated.
In T cells, Blimp-1 is driven by cytokine–JAK–STAT pathways such as IL-12–STAT4 in TH1 cells and IL-10–STAT3 in TH2 cells23,24. To test whether Blimp-1 is also driven by STAT pathways in ILC2 cells, sorted lung ILC2s from naive Blimp-1 YFP mice were stimulated in vitro with IL-33 for 24 h with or without the JAK inhibitor ruxolitinib, which specifically binds and inhibits JAK1 and JAK2, effectively eliminating all downstream STAT activation25. Inhibition of STAT pathways via the JAK inhibitor completely ablated Blimp-1 expression (Fig. 2e,f) suggesting that the JAK–STAT pathways are critical for Blimp-1 upregulation. IL-33 and IL-25 have been reported to activate STATs; however, we were unable to detect canonical phospho-STAT3 or STAT5 activation downstream of these alarmins in ILC2s (Extended Data Fig. 3e–g).
Given the timing of Blimp-1 upregulation, we hypothesized that Blimp-1 may be indirectly regulated by another factor rapidly upregulated in activated ILC2s in response to alarmins. To test this, we mixed IL-33 receptor (ST2)-deficient ILC2s 1:1 with ST2-intact cells and stimulated them with IL-33. ST2-deficient ILC2s cultured alone were unable to induce Blimp-1 and failed to become activated, whereas ST2-intact cells robustly expressed Blimp-1 as expected (Fig. 2g). ST2-deficient ILC2s cultured together with ST2-intact cells produced a significant amount of Blimp-1, although less than ST-intact cells (Fig. 2g,h). Using a transwell system to prevent cell–cell contact, ST2-deficient ILC2s still produced significant Blimp-1, indicating regulation by secreted factors (Fig. 2i,j). These data suggest that IL-33 and IL-25 indirectly drive Blimp-1 in ILC2s, likely through upregulation of a secreted factor that can activate STAT family members.
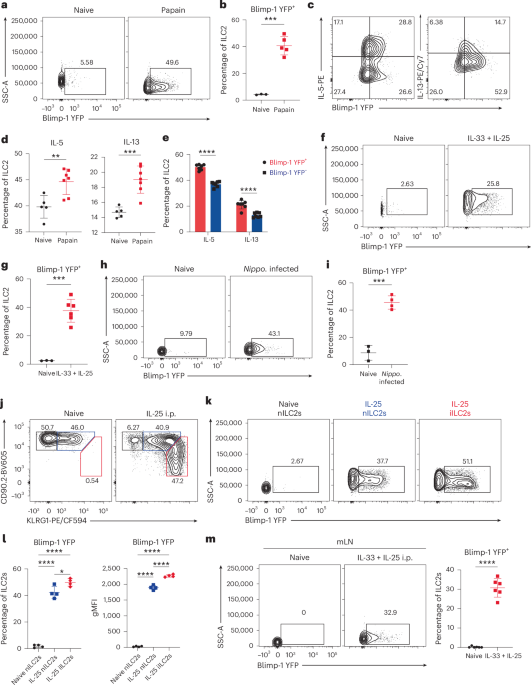
IL-9 is necessary and sufficient for Blimp-1 induction in ILC2sTo determine candidate secreted factors from ILC2s capable of promoting Blimp-1, we performed RNA sequencing (RNA-seq) comparing unstimulated ILC2s ex vivo from lungs with ILC2s stimulated with IL-33 for 24 h. Secreted protein genes that were significantly upregulated were compared to expression of their cognate receptors on unstimulated ILC2s (Fig. 3a,b). Based on these results, we selected the cytokines IL-9, IL-24 and IL-3 for further examination. ILC2s from Blimp-1 YFP mice were stimulated for 24 h with each candidate cytokine and compared to IL-2 alone. IL-9 drove significantly more Blimp-1 than IL-3 and IL-24 (Fig. 3c,d). Furthermore, ILC2s rapidly produced IL-9, because nearly 85% of ILC2s were positive after 4 h of stimulation, in line with the timeline to subsequently induce Blimp-1 (Fig. 3e,f).
Fig. 3: IL-9 is necessary and sufficient for Blimp-1 upregulation in ILC2s. The alternative text for this image may have been generated using AI.
a,b, RNA-seq comparing naive ILC2s with ILC2s stimulated for 24 h with IL-33 for secreted factors (a) or receptor expression (b). The z-scores were calculated as transcripts per million (TPM). c, Percentage of Blimp-1 YFP in ILC2s stimulated with IL-3, IL-9 or IL-24 for 24 h (n = 3). d, Quantification of c. e, Percentage of IL-9+ ILC2s at indicated timepoints when stimulated with IL-33 (n = 3). f, Quantification of e. g, Percentage of Blimp-1 YFP in ILC2s from transwell assay after treatment with anti-IL-9-blocking antibody. h, Quantification of g (n = 3). i, Percentage of Blimp-1 YFP in ILC2s after anti-IL-9 blockade in vivo (n = 6). j, Quantification of i. k, Percentage of Blimp-1 YFP in ILC2s after IL-9 treatment for 3 d (n = 6). l, Quantification of k. Each point represents one individual sorting sample from two pooled animals. The data are shown as mean ± s.d. and represent three or four independent experiments. A two-tailed, unpaired Student’s t-test was performed for j and l, Dunnett’s multiple-comparison test for d and f and Šídák’s multiple-comparison test for h. *P < 0.05, **P < 0.01, ***P < 0.001, ****P < 0.0001. The specific P values are as follows: for d, IL-2 versus IL-2 + IL-9, P = 0.0004; for f, unstimulated versus 1 h, P = 0.003, unstimulated versus 2 h, P = 0.0012, unstimulated versus 4 h, P = 0.0002; for h, comparison within ST2 knockout (KO), P < 0.0001, comparison within ST2 wild-type (WT), P < 0.0001; and, for j, P < 0.0001; for l, P < 0.0001.
To investigate whether IL-9 is necessary for Blimp-1 expression, we performed transwell assays as above with ST2-deficient ILC2s in the lower well and ST-intact ILC2s in the upper well, followed by IL-33 stimulation with or without blocking anti-IL-9. IL-9 blockade completely abrogated Blimp-1 expression in both ST2-intact and ST2-deficient ILC2s, demonstrating that IL-9 was essential for Blimp-1 expression in ILC2 cells (Fig. 3g,h). Next, we administered IL-33 + IL-25 i.n. with or without IL-9 blockade. Blimp-1 expression in ILC2s in the lung was completely abolished when IL-9 was blocked (Fig. 3i,j). Finally, to determine whether IL-9 was sufficient to induce Blimp-1 in vivo, we administered recombinant IL-9 i.n. 3× similar to IL-33 or papain and found that this was sufficient to drive Blimp-1 in ILC2s (Fig. 3k,l). Collectively these data demonstrate that IL-9 is the primary driver of Blimp-1 in ILC2s in response to activation by alarmins.
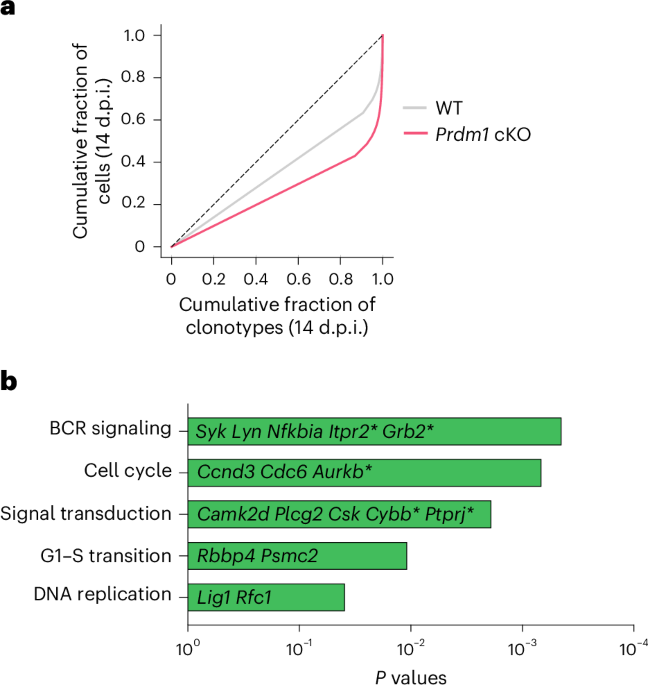
Blimp-1 suppresses type 1 genes in ILC2sTo determine the function of Blimp-1 in ILC2s, we deleted Blimp-1 in all ILC subsets as well as T cells, B cells and NK cells using Blimp-1flox mice crossed to IL7Rα-Cre (Blimp-1IL7RaCre) mice. ILC2 numbers in the lung at steady state were similar between controlIL7RaCre and Blimp-1IL7RaCre mice, indicating that Blimp-1 was not required for the development of ILC2s (Extended Data Fig. 4a). As Blimp-1 was absent in several cell types, we tested the function of Blimp-1 in vitro. Sorted ILC2s from the lungs of controlIL7RaCre and Blimp-1IL7RaCre mice were activated with IL-33 and IL-25 followed by RNA-seq and assay for transposase-accessible chromatin using sequencing (ATAC–seq). Differentially expressed genes were defined as log2(fold-change) > 2 and adjusted P (Padj) <0.01. The number of genes upregulated in Blimp-1-deficient ILC2s was 369, whereas only 89 were downregulated (Fig. 4a and Extended Data Fig. 4b). Gene set enrichment analysis (GSEA) showed that the top pathway enriched in Blimp-1-deficient ILC2s was cytokines and chemokines (Fig. 4b). Closer inspection revealed that several type 1-associated genes were upregulated, including Tnf, Lif, Ifng, Cxcl9, Cxcl10, Lta, Ltb, Csf1 and Csf2 (Fig. 4c). Type 2 genes Il4, Il5 and Il13 were not significantly different; however, Il9 was significantly upregulated, consistent with prior reports that Blimp-1 suppresses IL-9 in CD4 T cells (Fig. 4c,d)26. Il3, a cytokine that promotes inflammatory cells including mast cells, was also upregulated in the absence of Blimp-1 (Fig. 4c)27. Several genes of interest were also downregulated, including Arg1, Slc2a3 (Glut3) and Ccr3 (Fig. 4e). We confirmed an increase in both TNF and IL-9 in Blimp-1-deficient ILC2s at the protein level by intracellular cytokine staining and ELISA for TNF (Fig. 4f and Extended Data Fig. 4c,d). However, we did not detect an increase in IL-9 protein, likely because IL-9 is already robustly induced in ILC2s. In contrast, IFNγ was not upregulated at the protein level (Extended Data Fig. 4e). IFNγ is known to be highly regulated post-transcriptionally, suggesting that additional factors are needed to drive expression not present in this setting28. IL-3, granulocyte–macrophage colony-stimulating factor and CCL2 were upregulated in the supernatant upon ILC2 activation in Blimp-1IL7RaCre cells (Extended Data Fig. 4f–h). In contrast to RNA-seq data, we found that type 2 cytokines were reduced at the protein level, suggesting the possibility that increased type 1 cytokines could indirectly repress type 2 cytokines (Extended Data Fig. 4i–l).
Fig. 4: Blimp-1 suppresses type 1-related genes in ILC2s. The alternative text for this image may have been generated using AI.
a, Volcano plot from RNA-seq comparing controlIL7RaCre and Blimp-1IL7RaCre ILC2s. The threshold was set at log2(fold-change) > 1 and log10(P) < 0.01. b, GSEA plot with enrichment in cytokines and chemokines in Blimp-1IL7RaCre ILC2s. Normalized enrichment score (NES), 1.55; P, 0.0001; false recovery rate (FDR), 0.004. c–e, Heatmap for genes that were upregulated (c), no change (d) or downregulated (e) in Blimp-1IL7RaCre ILC2s. The z-scores were calculated as TPM. Genes marked with an asterisk (*) in d are not significant. f, Percentage and quantification of TNF + ILC2s from controlIL7RaCre or Blimp-1IL7RaCre mice with IL-33 and IL-25 (n = 3). g, Representative ATAC–seq peaks near the TNF locus and the IFNγ locus. h, Tornado plot for ATAC–seq differential peaks comparing Blimp-1-deficient with Blimp-1 intact ILC2s. i, Top results from HOMER motif analysis enriched in open chromatin regions of Blimp-1-deficient ILC2s. Each point represents one individual sorting sample from two pooled animals. The data are shown as mean ± s.d. and represent three or four independent experiments. A two-tailed, unpaired Student’s t-test was performed for f, the multiple-comparison test with Benjamini–Hochberg procedure for Padj in RNA-seq and the Kolmogorov–Smirnov test for P value in GSEA. *P < 0.05, **P < 0.01, ***P < 0.001. The specific P values are as follows: for f, P = 0.0006.
Blimp-1 is a transcriptional repressor known to recruit the histone methyltransferase G9a, which drives methylation of H3K9, a mark of heterochromatin29. To determine the mechanism of Blimp-1-mediated suppression of type 1 genes, we compared open chromatin regions in activated ILC2s from controlIL7RaCre and Blimp-1IL7RaCre mice identified by ATAC–seq. Blimp-1-deficient ILC2s had increased chromatin accessibility at type 1 cytokine genes, including the Lta, Tnf and Ltb locus and Ifng (Fig. 4g). Genome-wide analysis identified increased accessibility at open regions (clusters 1 and 2) but few newly accessible regions, suggesting that Blimp-1 limits gene expression of those genes that may already be accessible (Fig. 4h). ILCs are known to have a chromatin landscape poised for responsiveness30. Motif analysis of regions more accessible in Blimp-1-deficient ILC2s identified the Prdm1 consensus sequence as a top hit, suggesting that Blimp-1 mediates repression of type 1 genes directly (Fig. 4i). Collectively, these data suggest that Blimp-1 limits the accessibility and expression of type 1 genes after ILC2 activation, protecting the type 2 transcriptional state of ILC2s under inflammatory conditions.
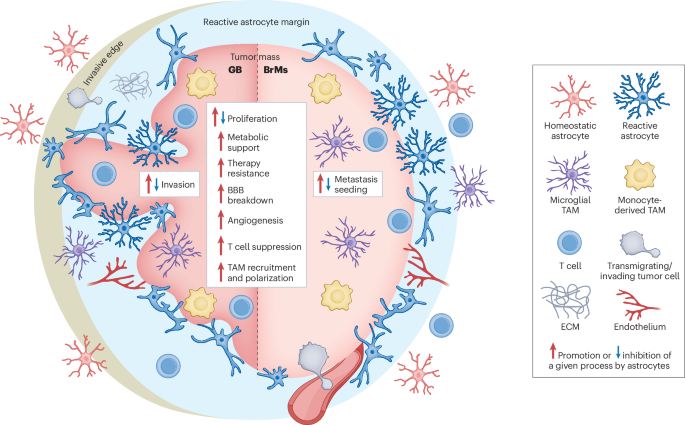
Blimp-1 promotes type 2 responses in ILC2s by repressing type 1 cytokinesTo assess Blimp-1 function in vivo during allergen or alarmin responses, we generated ILC2-specific, Blimp-1-deficient mice using the NMur1-Cre strain which includes eGFP as a marker of NMur1. NMur1 has been observed in non-ILC2 populations in other tissues but is restricted to the ILC2 compartment in the lung (Extended Data Fig. 5a,b). We administered IL-33 and IL-25 i.n. for 3 d and found ILC2 activation, including ST2 and KLRG1, and ILC2 numbers were not affected, indicating that Blimp-1 does not broadly regulate ILC2 activation or expansion (Extended Data Fig. 5c,d). However, Blimp-1 deficient ILC2s produced significantly more IFNγ and TNF compared to control ILC2s (Fig. 5a–d and Supplementary Fig. 3). Despite undetectable IFNγ protein in vitro, in vivo IFNγ was robustly increased which extended to bronchoalveolar lavage (BAL) (Fig. 5e). IL-5 and IL-13 were significantly reduced (Fig. 5f,g), suggesting that they may be indirectly regulated by increased type 1 cytokines. As early responders to tissue damage, ILC2s can influence the inflammatory state of T cell responses. We found increased expression of IFNγ and TNF in both CD4 and CD8 T cells in the lung (Extended Data Fig. 5e–j), although total numbers of both remained the same (Extended Data Fig. 5k,l). Decreased type 2 cytokines led to a reduction in eosinophil recruitment to BAL (Fig. 5h,i); however, mast cells were significantly increased, likely due to increased IL-3 and IL-9, because they can recruit mast cells (Fig. 5j,k)27,31. Neutrophils in the BAL were unaffected (Extended Data Fig. 5m). To assess the impacts on lung inflammation, we performed hematoxylin and eosin (H&E) and periodic acid–Schiff (PAS) staining to identify mucus in the airways. Blimp-1NMur1Cre mice had reduced lymphocytic infiltration and mucus in the airways compared to controlNMur1Cre mice (Fig. 5l–n). Collectively, these data indicate that Blimp-1 maintains the type 2 state of ILC2s, whereas its loss promotes a mixed phenotype expressing both type 1 and type 2 cytokines.
Fig. 5: Loss of Blimp-1 shifts the ILC2 cytokine balance in response to tissue alarmins. The alternative text for this image may have been generated using AI.
a,c, Representative flow plots of IFNγ+ (a) or TNF+ (c) ILC2s in indicated mice after IL-33 + IL-25. b,d, Quantification of IFNγ (b) or TNF (d) from a and c (n = 6). e, Quantification of IFNγ in BAL by ELISA (n = 3). f, Representative flow plots of IL-5+ IL-13+ ILC2s in indicated mice after IL-33 + IL-25. g, Quantification of IL-5 (left) or IL-13 (right) expression from f (n = 6). h,j, Representative flow plot for eosinophils (h) or mast cells (j) in indicated mice after IL-33 + IL-25. i,k, Quantification of eosinophil number (i) or mast cell numbers (k) from h and j (n = 3). l, Representative H&E and PAS staining of lungs from the indicated mice after IL-33 and IL-25 i.n. m,n, Quantification of inflammation (m) and mucus (n) from l (n = 4) Each point represents one individual sample. The data are shown as mean ± s.d. and represent two independent experiments. A two-tailed, unpaired Student’s t-test was performed for b, d, e, g, i, k and n and Šídák’s multiple-comparison test for m. *P < 0.05, **P < 0.01, ***P < 0.001, ****P < 0.0001. The specific P values are as follows for b: P = 0.0021; for d: P = 0.0007; for e, P = 0.0112; for g: left, P < 0.0001, right, P = 0.0009; for i: P = 0.0326; for k, P = 0.0029; for m, normal, P = 0.0428, inflamed, P = 0.0223, bronchi, P = 0.9867; and, for n, P = 0.0095. NS, not significant; ROI, region of interest.
We next examined Blimp-1 in ILC2s using clinically relevant allergens, papain and Alternaria alternata. Acute models of either allergen produced results similar to IL-33 and IL-25 across most measures. ILC2 numbers were unchanged, but IFNγ and TNF increased at the expense of IL-5 and IL-13 (Fig. 6a–g and Extended Data Fig. 6a–g). Papain robustly increased IFNγ and TNF, whereas Alternaria sp. significantly increased IFNγ, with only a trend in TNF, indicating allergen-specific differences. IL-9 was potently upregulated in Blimp-1-deficient ILC2s (Extended Data Fig. 6h,i). Despite undetectable levels of IL-9 in the BAL, the shift in cytokines led to decreases in eosinophils, whereas mast cells were increased (Fig. 6h,i and Extended Data Fig. 6j–o). Neutrophils remained unchanged (Extended Data Fig. 6p,q). We also did not observe any changes in NK or ILC1 cells (Extended Data Fig. 6r,s). CD4 and CD8 T cells had increased IFNγ expression but were not changed in total number (Fig. 6j–n) and histological analysis consistently showed a reduction in lymphocytic infiltration and mucus production (Fig. 6o–q and Extended Data Fig. 7a–c). To determine the physiological impact of these changes, we assessed airway hyperresponsiveness (AHR) to methacholine challenge after Alternaria sensitization. Despite robust changes by histology, we did not find statistically significant differences in AHR between controlNMur1Cre and Blimp-1NMur1Cre mice (Extended Data Fig. 7d). A recent study demonstrated that IL-9 was a key factor promoting AHR and mast cells are known to be associated with AHR32,33. Thus, despite reduced IL-5, IL-13, eosinophils and lung inflammation, increased IL-9 and mast cell recruitment likely sustain AHR.
Fig. 6: Loss of Blimp-1 shifts ILC2 cytokines and limits tissue inflammation to allergens. The alternative text for this image may have been generated using AI.
a, Quantification of total ILC2 number. b, Representative flow plots of IFNγ+ TNF+ ILC2s in indicated mice after papain (n = 6). c,d, Quantification of IFNγ (c) or TNF (d) expression from b. e, Representative flow plots of IL-5+ IL-13+ ILC2s in indicated mice after papain. f,g, Quantification of IL-5 (f) or IL-13 (g) expression from e. h, Representative flow plots of eosinophils from indicated mice after papain (n = 3). i, Quantification of h. j,l, Representative flow plots of IFNγ+ CD4 (j) or CD8 (l) in indicated mice after Alternaria sp. (n = 6). k,m, Quantification of j (k) and l (m). n, Quantification of total CD4 (left) or CD8 (right) T cell numbers in indicated mice after papain (n = 6). o, Representative H&E and PAS staining of indicated mice after papain. p,q, Quantification of inflammation (p) and mucus (q) from o (n = 4). Each point represents one individual sample. The data are shown as mean ± s.d. and represent two independent experiments. A two-tailed, unpaired Student’s t-test was performed for a, c, d, f, g, i, k, m, n and q and Šídák’s multiple-comparison test for p. *P < 0.05, **P < 0.01, ***P < 0.001, ****P < 0.0001. The specific P values are as follows for a: P = 0.7521; for b, P = 0.0068; for d, P = 0.0133; for f, P < 0.0001; for g, P = 0.0011; for i, P = 0.0494; for k, P = 0.0031; for m, P = 0.0394; for n, CD4, P = 0.9591, CD8, P = 0.6749; for p, normal, P = 0.0187, inflamed, P = 0.2616, bronchi, P = 0.4843; and, for q, P = 0.0267.
To model chronic allergen exposure in asthma, we administered Alternaria sp. twice weekly for 3 weeks and compared it to acute daily exposure for 4 d. As expected, the amount of IL-5 and IL-13 from CD4 T cells in chronic exposure far exceeded the amount during acute settings, where almost no cytokines from T cells were detected (Extended Data Fig. 7e–g). No differences in type 2 cytokines from CD4 T cells were observed between controlNMur1Cre and Blimp-1NMur1Cre mice. Eosinophil recruitment was also unaffected, likely due to IL-5 from CD4 T cells (Extended Data Fig. 7h,i). ILC2s from both groups produced IL-5 and IL-13; although IL-5 levels in the chronic setting were comparable to acute administration, IL-13 was greatly increased in ILC2s after chronic Alternaria sp. exposure (Extended Data Fig. 7j–l). IFNγ was not detected in ILC2s, whereas TNF was elevated with chronic Alternaria sp. exposure, with a nonsignificant increase in Blimp-1NMur1Cre mice compared to controls (Extended Data Fig. 7m). High type 2 cytokine production by T cells obscured ILC2-intrinsic effects of Blimp-1 loss, indicating a role for the broader cytokine environment; collectively, these data support a key role for Blimp-1 in acute alarmin responses by maintaining type 2 cytokines and repressing type 1 genes.
Blimp-1 maintains the type 2 transcriptional state of ILC2sTo define how Blimp-1 regulates ILC2 effector differentiation, we performed single-cell RNA-seq (scRNA-seq) of sorted ILC2s from untreated, papain or Alternaria-treated controlNMur1Cre and Blimp-1NMur1Cre mice (n = 2 per condition). Uniform Manifold Approximation and Projection (UMAP) clustering identified eight clusters, all expressing core ILC2 transcription factors (Gata3, Rora and Id2) and type 2 cytokine genes (Il13, Il5 and Il4) (Fig. 7a and Extended Data Fig. 8a,b). Analysis of clusters by treatment demonstrated distinctions between untreated and allergen-treated mice, likely representing ILC2s at steady state compared to activated ILC2s (Fig. 7b and Extended Data Fig. 8c). The differences between treatment groups aligned with our prior analysis demonstrating greater effects on TNF in papain compared to Alternaria sp. Clusters 0–2 were enriched for untreated ILC2s, whereas clusters 3–7 contained allergen-treated cells, consistent with an activated effector state (Fig. 7b and Extended Data Fig. 8c).
Fig. 7: Blimp-1 maintains the transcriptional state of ILC2s and extrinsically regulates type 2 cytokines. The alternative text for this image may have been generated using AI.
a–c, A UMAP visualization of ILC2 cells from scRNA-seq colored by Leiden clustering labels 0–7 (a), aller
Comments (0)