
Remember me
In this section, we derive algebraic equations for \(\text\), \(_}\), and \(_\), based on classical PK principles as applied to therapeutic peptides. We also compare these theoretical equations to the collected PK data.
3.1.1 ClearanceMost small-molecule pharmaceutical compounds are metabolized by cytochrome P450 (CYP) enzymes expressed primarily in the liver. In these instances, tissue perfusion limits the metabolic blood clearance (\(}_,\text,\text}\)) to the blood flow rate to the liver (\(_}\)), a dependence commonly described by the well-stirred model [27,28,29]:
$$}_,\text,\text}=\frac_} \times _,\text} \times }_,\text,\text}}_}+ _,\text} \times }_,\text,\text}}$$
(1)
where \(_,\text}\) is the unbound fraction in blood and \(}_,\text,\text}\) is the intrinsic clearance, representing the intrinsic ability of the hepatocytes to metabolize the drug not restricted by either blood flow or plasma protein binding. The correction for protein binding assumes that only the free pool equilibrates between the blood and intracellular compartments, where the drug is exposed to metabolizing enzymes. Of note, when perfusion is not limiting, i.e., when \(_}\gg _,\text} \times }_,\text,\text}\), Eq. 1 simplifies to \(}_,\text,\text}=_,\text} \times }_,\text,\text}\).
For peptides, intracellular hepatic metabolism is generally not a major elimination route, albeit a few exceptions have been reported [7]. Instead, the clearance is driven by ubiquitously expressed, high-capacity proteases, like DPP-4, which are widely abundant in the blood [7, 10]. Therefore, metabolic clearance of peptides is, unlike most small molecules, not necessarily restricted by tissue blood flow. In fact, as peptide degradation also can occur in the blood stream, clearance of peptides can exceed the cardiac output rate [7].
Analogues to the well-stirred model in conditions where perfusion is not a limiting factor, the metabolic plasma clearance of a peptide can be described as:
$$}_}=_} \times }_,\text}$$
(2)
where \(_}\) is the unbound fraction in plasma and where CLint,met denotes the intrinsic in vivo metabolic clearance, representing the capability of proteases in blood and highly perfused organs, such as the liver and kidneys, to metabolize the drug.
While Eq. 2 states that peptides gain protection from metabolism through binding to plasma proteins, it does not consider the impact on this pool by the continuous synthesis and catabolism of the plasma proteins. If the protein-bound drug is instead assumed to undergo turnover in accordance with the kinetics of its primary plasma protein, albumin, Eq. 2 expands to:
$$}_}=f}_}\times }_,\text}+\left(1-_}\right)\times }_}$$
(3)
where \(}_}\) is the clearance of albumin. Levitt and Levitt [30] report a liver albumin synthesis rate of about 10.5 g/day. For a typical albumin concentration of 35–50 g/L [31], the albumin clearance is obtained from the steady-state relationship as synthesis rate divided by concentration, hence (10.5 g/day) / (34–54 g/L) = 0.21–0.30 L/day in humans. Generally, assuming a human body weight of 70 kg, \(}_}\) = 3.0–4.3 mL/kg/day.
Peptides consisting of up to 50 amino acid residues, each with an average molecular weight of 110 Da, will weigh < 5.5 kDa. This is significantly below the 30 kDa threshold for free filtration in the kidney glomeruli. Indeed, the observed peptide clearance can decrease in populations with renal impairment [32]. Renal clearance (\(}_}\)) may be viewed as a composite of glomerular filtration (CLfiltr), transporter-mediated tubular secretion (CLsecr) and reabsorption (freabs) [33]:
$$}_}=\left(}_}+}_}\right) \times \left(1-_}\right)$$
(4)
However, linear peptide drugs are commonly not substrates for transporters, as the primary peptide transporters PEPT1 and PEPT2 mainly handle only dipeptides and tripeptides [8, 34, 35]. Consequently, tubular exchange has limited impact, and filtration becomes the main determinant of renal clearance. Since the size of plasma proteins exceeds the filtration threshold, only the free pool of circulating peptide is subject to filtration, which in turn is dictated by the \(\text\) [36].
$$}_}=}_}=_}\times \text$$
(5)
As an example, the \(\text\) is approximately 0.11 L/kg/h in humans [16], and this corresponds to a half-life of approximately 1.6 hours, for a peptide not bound to plasma proteins (\(_}=1\)) with distribution limited to the extracellular volume (calculated by the equation \(_=\text(2)/(}_}/_})\) using extracellular volume \(_}\) of 0.26 L/kg [16]). It is worth noting that while the peptide is filtered in the kidney, it may not necessarily be eliminated in intact form. Instead, only minimal amounts of the intact forms of, for example, exenatide [37], liraglutide and semaglutide [10] have been reported in urine.
Clearance is additive, as drugs are exposed to all elimination pathways in parallel. Therefore, the total clearance is obtained as
where \(}_}\) includes any remaining elimination pathways. By inserting (3) and (5) for metabolic and renal clearance, while assuming negligible remaining clearance, we obtain
$$}_}=_} \times \left(}_,\text}+\text\right)+\left(1-_}\right)\times }_}$$
(7)
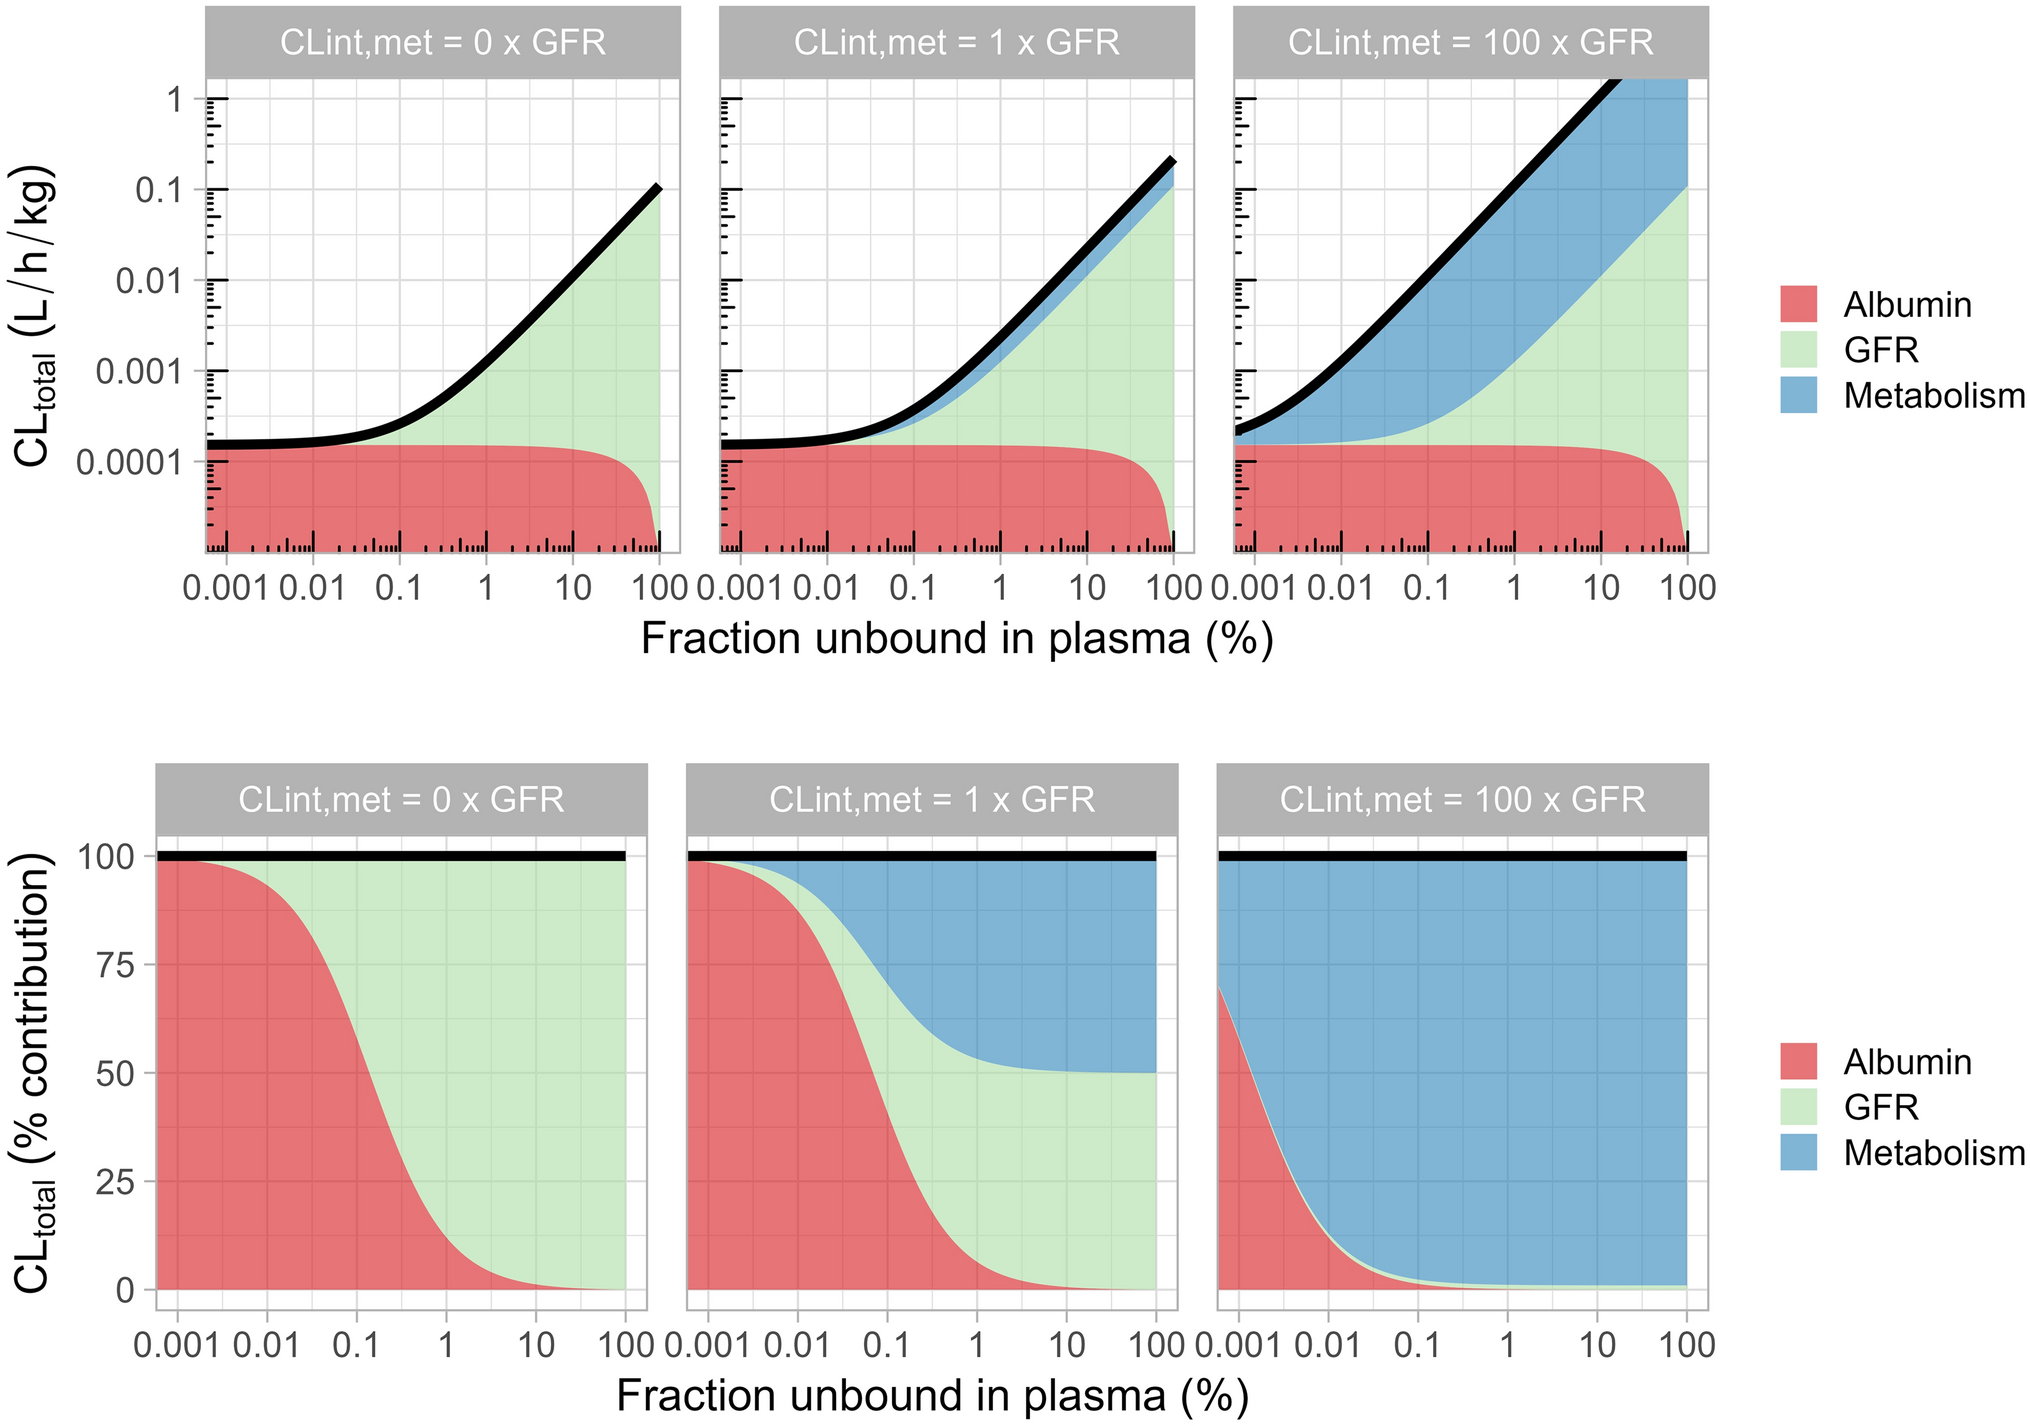
This describes the clearance as a function of unbound fraction, metabolic stability, \(\text\) and albumin-mediated clearance. Figure 1 illustrates the contribution of metabolism, \(\text\) and albumin-mediated elimination to total clearance as a function of plasma protein binding. Specifically, when the unbound fraction falls below 0.1%, albumin turnover becomes the primary route of elimination, provided that metabolic clearance is of the same order of magnitude as renal clearance. Conversely, for unbound fractions above 1%, metabolic and renal clearances are the dominant elimination pathways.
Fig. 1 The alternative text for this image may have been generated using AI.
Absolute (top) and relative (bottom) contribution of metabolism, glomerular filtration rate (GFR) and albumin-mediated elimination to total peptide clearance (black line) as a function of plasma protein binding based on Eq. 7
For the latter case of moderate free fractions (i.e., \(_}>1\boldsymbol\)), Eq. 7 simplifies to
$$}_}=_} \times \left(}_,\text}+\text\right) > _} \times \text$$
(8)
Empirical insights: Eq. 8 distinguishes between elimination due to metabolism and that resulting from glomerular filtration. Neglecting albumin-mediated elimination, any residual unbound clearance (\(}_}/_}\)) greater than the \(\text\) is attributed to metabolic processes, or equivalently, unbound clearance equal to \(\text\) will only be observed for a perfectly stabilized peptide. Figure 2 presents the observed \(}_}/_}\) for the peptide set across species where clearance and protein binding data are available. While measured metabolic clearance is unavailable and prevents a direct comparison of predicted and observed values, the finding that unbound clearance is uniformly equal to or exceeds GFR remains qualitatively consistent with Eq. 8. For a given peptide, the magnitudes of displacement from the GFR lower bound are relatively consistent across species, suggesting broadly similar non-renal contributions to clearance. Because we consider unbound apparent clearance, heterogeneity in plasma protein binding should not influence the displacement. This is illustrated by pramlintide and exenatide, both with minimal plasma protein binding, which bracket the observed range from near-GFR to >10-fold above GFR. However, interpreting the offset above GFR as solely reflecting metabolic clearance is complicated by several factors: (1) albumin-mediated processes can contribute when plasma protein binding is high, and the assumption of fraction unbound (\(_}\)) ≥ 1% is not strictly met for all compounds in our dataset; (2) variability in bioavailability affects unbound CL/F, and values of F < 100% (Table S1) can inflate apparent clearance above GFR; and (3) for some peptides, target-mediated processes may further contribute to non-renal clearance [17]. Despite these caveats, Figure 2 provides a practical benchmark for assessing peptide clearance components given the currently available data.
Fig. 2 The alternative text for this image may have been generated using AI.
Total apparent clearance after subcutaneous administration (\(}_}/F)\) divided by the fraction unbound (\(_}\)) for several peptide drugs across species. The solid line indicates the glomerular filtration rate (\(\text)\) for each species, representing the theoretical lower boundary for unbound clearance; values below this boundary (shaded area) are not feasible
3.1.2 Volume of DistributionVolume of distribution (\(_}\)) is the ratio of the amount of drug in body (\(_}\)) and the plasma concentration (\(_}\)) at a given point in time:
Oie and Tozer [38] derived an equation for the apparent volume by considering three separate physiological volumes: the plasma volume (\(_}\)), the extracellular volume outside the plasma volume (\(_}\)), and the volume into which a drug distributes outside the extracellular volume (\(_}\)), where the subscript R denotes the remainder. The two latter volumes may be interpreted as the interstitial and the intracellular space, respectively. Assuming passive distribution, i.e., that unbound concentration of drug is the same in all tissues at distribution equilibrium, the \(_}\) can be calculated as
$$_}=_}\left(1+_/\text}\right)+_}\times _} \left(\frac_}}_}}-_/\text}\right)+_}\times \frac_}}_,\text}}$$
(10)
where \(_}\) is the plasma volume, \(_/\text}\) is the ratio of the total number of binding sites or the amount of protein in interstitial space to that in plasma, and \(_}\) and \(_,\text}\) are the fractions unbound in plasma and intracellular space, respectively. The two parameters for fraction unbound are accordingly the only drug-specific parameters determining \(_}\).
For a 70-kg human, typical values of \(_}\) and \(_}\) are 15.2 and 3.0 L, respectively [16]. Furthermore, 55–60% of the total extracellular albumin is typically found in the interstitial space outside the plasma [38, 39]. Assuming that plasma proteins to which a drug binds are distributed similarly to albumin, the ratio \(_/\text}\) is approximately 1.4.
As previously described, the physicochemical nature of peptides restricts membrane permeability, limiting distribution into the intracellular volume. Thus, the apparent volume of distribution (Vd/F) for tissue distribution intracellularly is considered negligible, approximating distribution to the two first terms of Eq. 10:
$$_}\left(\text\right)\approx 3.0 \times \left(1+1.4\right)+_}\times 3.0\times \left(\frac-1.4\right)=7.2+11.0\times _}$$
(11)
A corresponding approximation to Eq. 10 in volumes normalized to 70 kg human body weight becomes:
$$V_}} \left( }}}}}} \right) \approx 0.10 + 0.16 \times f_}}$$
(12)
For comparison, similar derivations have been reported previously [40, 41].
Accordingly, the \(_}\) is predicted to span from 0.10 L/kg for strongly protein-bound peptides to 0.26 L/kg for peptides with negligible binding. This range is markedly narrower than that observed for small molecules [42], reflecting the limited intracellular distribution of peptides. The corresponding expressions to Eq. 12 in mouse, rat, monkey and dog are provided in Table S2, based on physiological volumes reported by Davies and Morris [16].
Empirical insights: Eq. 12 defines the expected narrow range of \(_}\) in humans as a function of plasma protein binding, with analogous relationships established for animals presented in Table S2. Figure 3 illustrates the theoretical versus observed \(_}\) for the peptide set in species where Vd and protein binding data are available. The observations show that approximately half of the samples align with theoretical predictions, while the remaining samples indicate that the model overpredicts the Vd.
Fig. 3 The alternative text for this image may have been generated using AI.
Theoretical (ribbon) versus observed (circles) volume of distribution after subcutaneous administration (\(_}/F\)) for the peptide data set in species where volume and protein binding data are available. The lower and upper boundaries define the range based on free fraction in plasma (0% and 100% free, respectively) as described by Eq. 12 for human (corresponding dependencies for preclinical species provided in Table S2)
3.1.3 Pharmacokinetic Half-LifeThe PK half-life is determined by Vd and total clearance according to [41]
$$_=\frac(2) \times _}}}_}}$$
(13)
where \(\text(2)\) is approximately 0.69. Replacing \(}_}\) with Eq. 7 and \(_}\) with Eq. 12 yields
$$_=\frac(2) \times (0.10+_})}_}\times }_,\text}+\text)+\left(1-_}\right)\times }_}}$$
(14)
The expression above describes why plasma protein binding effectively can be used to modulate half-life of peptide drugs contrary to small molecules: clearance (denominator) is sensitive to free fraction, whereas volume (nominator) as described previously, is relatively insensitive. For an extremely highly protein-bound peptide (i.e., fu\(\to\) 0), the half-life approaches an upper limit of:
$$_=\frac2 \times 0.10}}_}}=16-23\text$$
(15)
using \(}_}\) = 3.0–4.3 mL/kg/day. This is in agreement with reports on albumin half-life of approximately 21 days in circulation [43], theoretically setting a physiological limit as to how much a peptide´s half-life can be extended by enhancing albumin binding through, e.g., lipidation [18].
Empirical insights: Equation 14 explains how human clearance and \(_}\), both of which depend on plasma protein binding, combine with physiological factors such as \(\text\), physical volumes, and albumin turnover to determine the half-life in circulation. Based on Eq. 14, profiles of theoretical half-life versus unbound fraction at intrinsic metabolic clearance (\(}_,\text}\)) equivalent to 0, 1, 10 and 100 times \(\text\) were generated and compared to the peptide set where half-life and human protein binding data are available (Fig. 4). The simulations illustrate the upper boundary for half-life at each plasma protein binding value, approaching approximately 21 days at very high binding. However, as illustrated, any extension beyond approximately 1 week would require metabolic stability comparable to, or lower than, GFR unless protein binding is extremely high (< 0.1%). All compounds fall within this feasible range, and additionally, the results suggest that compounds like liraglutide and apraglutide have lower metabolic stability compared to some of the other evaluated peptides, such as semaglutide and tirzepatide.
Fig 4 The alternative text for this image may have been generated using AI.
Relationship in human between half-life and fraction unbound in plasma (\(_}\)) according to Eq. 14 for three different levels of intrinsic metabolic clearance (\(}_,\text}\)) equivalent to 0, 1, 10 and 100 times the glomerular filtration rate (\(\text\)), and from observed data for the peptide set where half-life and human protein binding data are available (circles)
3.2 Interspecies Scaling of Pharmacokinetic ParametersAllometric scaling is a widely applied approach for predicting human PKs and disposition based on animal data. The method has played, and continues to play, a pivotal role in early drug development, supporting activities such as dose selection for first-in-human studies, dose extrapolation, and safety assessments. Allometric scaling relies on a power-law relationship between body weight (\(\text\)), or body surface area, and a PK parameter (\(P\)) as,
where a and b are the coefficient and the exponent of the allometric equation, respectively. This relationship can be linearized by taking logarithms on both sides:
$$}_\left(P\right)= }_\left(a\right)+}_\left(\text\right)$$
(17)
This linearized form allows for straightforward estimation of a and b from experimental data using linear regression. In the context of predicting human PK parameters, this relationship enables translation from preclinical data. Generally, observations from ≥ 3 preclinical species are required for reliable prediction of human parameters [20]. The technique’s application spans across different drug classes, including small molecules, oligonucleotides and biologics like monoclonal antibodies, underscoring its versatility and significance [19, 20, 44,45,46]. Simple allometric scaling of, e.g., clearance, can however be misleading when notable variation in key metabolizing enzymes, transporters, or protein binding exists across species, which is common for small molecule drugs [47].
Empirical insights: We evaluated the extent to which the compiled PK parameters adhered to allometric principles. For the nine peptides included in this study, data from three or more species were available for analysis. Figure 5, along with Tables S3 and S4, depict the allometric plots and associated regression parameters for apparent clearance, \(\text/F\), and apparent volume of distribution, \(_}/F\), following SC administration. Our analyses demonstrate that the data for each peptide were well described by a power relationship for both PK parameters (R2 ≥ 0.88). The allometric exponent for clearance ranged from 0.58 to 0.88, with a geometric mean of 0.72. For \(_}\), the allometric exponent was generally higher, ranging from 0.89 to 1.1, with a geometric mean of 0.98. In conclusion, these exponent values for CL/F and \(_}/F\) align with established empirical interspecies relationships, emphasizing that peptides may be considered to adhere to general, size-related physiological patterns and that preclinical PK studies offer reasonable estimates of human disposition.
Fig. 5 The alternative text for this image may have been generated using AI.
Allometric plots for apparent clearance (\(\text/F\)) (upper panel) and apparent volume of distribution (\(_}/F\)) (lower panel) after subcutaneous administration for the considered peptides. Linear regression with 80% confidence range is indicated by line and shaded area (estimated allometric slope indicated bottom-right). Vertical line indicates 70 kg human body weight. DIO diet-induced obese
In addition, we explored the allometric behavior of half-life, which is proportional to the ratio of the primary parameters for \(_}/F\) and \(\text/F\). Because both \(_}/F\) and CL/F scale with distinct exponents, the resulting allometric exponent for half-life reflects the net difference between these primary parameters. Empirical analyses indeed confirm that half-lives also follow a power-law relationship with body weight, with observed exponents ranging from 0.10 to 0.35 across peptides (Fig. S1). The geometric mean exponent of 0.25 matched the expected value from the exponents for \(\text/F\) and \(_}/F\).
Comments (0)