
Remember me
A prospective, observational pharmacokinetic sub-study was conducted within the V-SMART trial (Trial registration number ACTRN12620000681954) to assess the feasibility of saliva-based TDM for levofloxacin in patients with MDR-TB. This study was conducted across four provinces in Vietnam with ethical approvals from The University of Sydney, Australia (Protocol No. 2021/082, dated 21/10/2021) and the National Lung Hospital, Vietnam (Approval No. 25/21/CN-HDDD, dated 27/04/2021). Adults (aged ≥ 18 years) receiving levofloxacin for at least 7 days (at steady state) and willing to undergo simultaneous blood and saliva collection at 0, 2, and 5 h post-dose were eligible. Patients unable to consent or with oral conditions preventing saliva collection were excluded. Written informed consent was obtained from all participants.
2.2 Quantification of Levofloxacin in Plasma and SalivaLevofloxacin concentrations in plasma and saliva were quantified using liquid chromatography quadrupole-orbitrap mass spectrometer validated assay [18]. Separation was achieved using an Agilent Poroshell 120 CS-C18 column (100 × 2.1 mm, 2.7 µm) with a 0.2 mL/min gradient of 0.1% formic acid in water (A) and methanol (B), with levofloxacin eluting within 7 min. Detection was performed using a Q-Orbitrap mass spectrometer in positive electrospray ionisation (ESI+) mode, targeting the transition m/z 362.151 → 318.161 for levofloxacin. A stable isotope-labelled internal standard ([13C3,2H3]-levofloxacin) was used to control for matrix effects and instrument variability. Sample preparation was simple, using methanol protein precipitation (1:3 ratio), which worked effectively for both plasma and saliva samples with minimal handling.
2.3 Population Pharmacokinetic AnalysisPatients included in the final analysis were those with evaluable pharmacokinetic data, defined as dose-sampling alignment, complete data verification, and concentrations within quantifiable limits. Scheduled administration records were used to impute dosing times. Reported times and doses were verified against observed concentration–time data (e.g., plausibility of pre/post-dose concentrations and decay). A PopPK analysis was performed using a nonlinear mixed-effects modelling approach in NONMEM (v. 7.4.4; ICON Development Solutions, Hanover, MD, USA) with the ADVAN13 subroutine. Parameter estimation used the first-order conditional estimation method with interaction (FOCE-I). Nonlinear Mixed Effects Modelling (NONMEM) execution and post-processing were handled by Pirana (v. 21.11.1; Certara, Princeton, New Jersey, USA), Perl-Speaks-NONMEM (v. 5.3.1), and Xpose4 [19, 20]. Data handling and graphical analysis were conducted in R (v. 4.3.3; R Foundation for Statistical Computing, Vienna, Austria).
A combined pharmacokinetic model was built to describe levofloxacin pharmacokinetic in both plasma and saliva. The plasma model was developed initially, and this was extended to include a saliva bio-compartment (i.e., a hypothetical effect compartment, which does not account for mass balance). To describe the plasma pharmacokinetics of levofloxacin, well-established one- and two-compartment structural plasma models were investigated [8, 9, 21,22,23,24,25], and the absorption phase was modelled using first-order processes both with and without a lag time, as well as a transit-compartment model. Given the sparsely sampled dataset, a three-compartment model was not investigated. Since the oral bioavailability of levofloxacin could not be determined, all pharmacokinetic parameters were expressed relative to bioavailability: apparent central volume of distribution and apparent clearance. Interindividual variability in structural parameters was described using an exponential relationship, and residual unexplained variability was evaluated using proportional, additive and combined proportional and additive error models (Supplementary Material S1). The inclusion of interindividual variability on a pharmacokinetic parameter was based on the evaluation of η-shrinkage, overall model stability, and the attainment of a successful covariant step. Inter-occasion variability could not be assessed owing to the single-occasion design. Model selection relied on multiple criteria, including a predefined reduction in the objective function value for a nested model, Akaike information criterion for a non-nested model, precision and bias (i.e., mean error [Eq. 1]) and root mean squared error [Eq. 2]), goodness-of-fit diagnostics and visual predictive check plots.
Mean error (ME):
$$\text=\frac\sum_^\left(\text-\text\right).$$
(1)
Root mean squared error (RMSE):
$$\text=\sqrt\sum_^-\text\right)}^,}$$
(2)
where, IPRED is individual-predicted concentration; DV is observed concentration and n is number of observations.
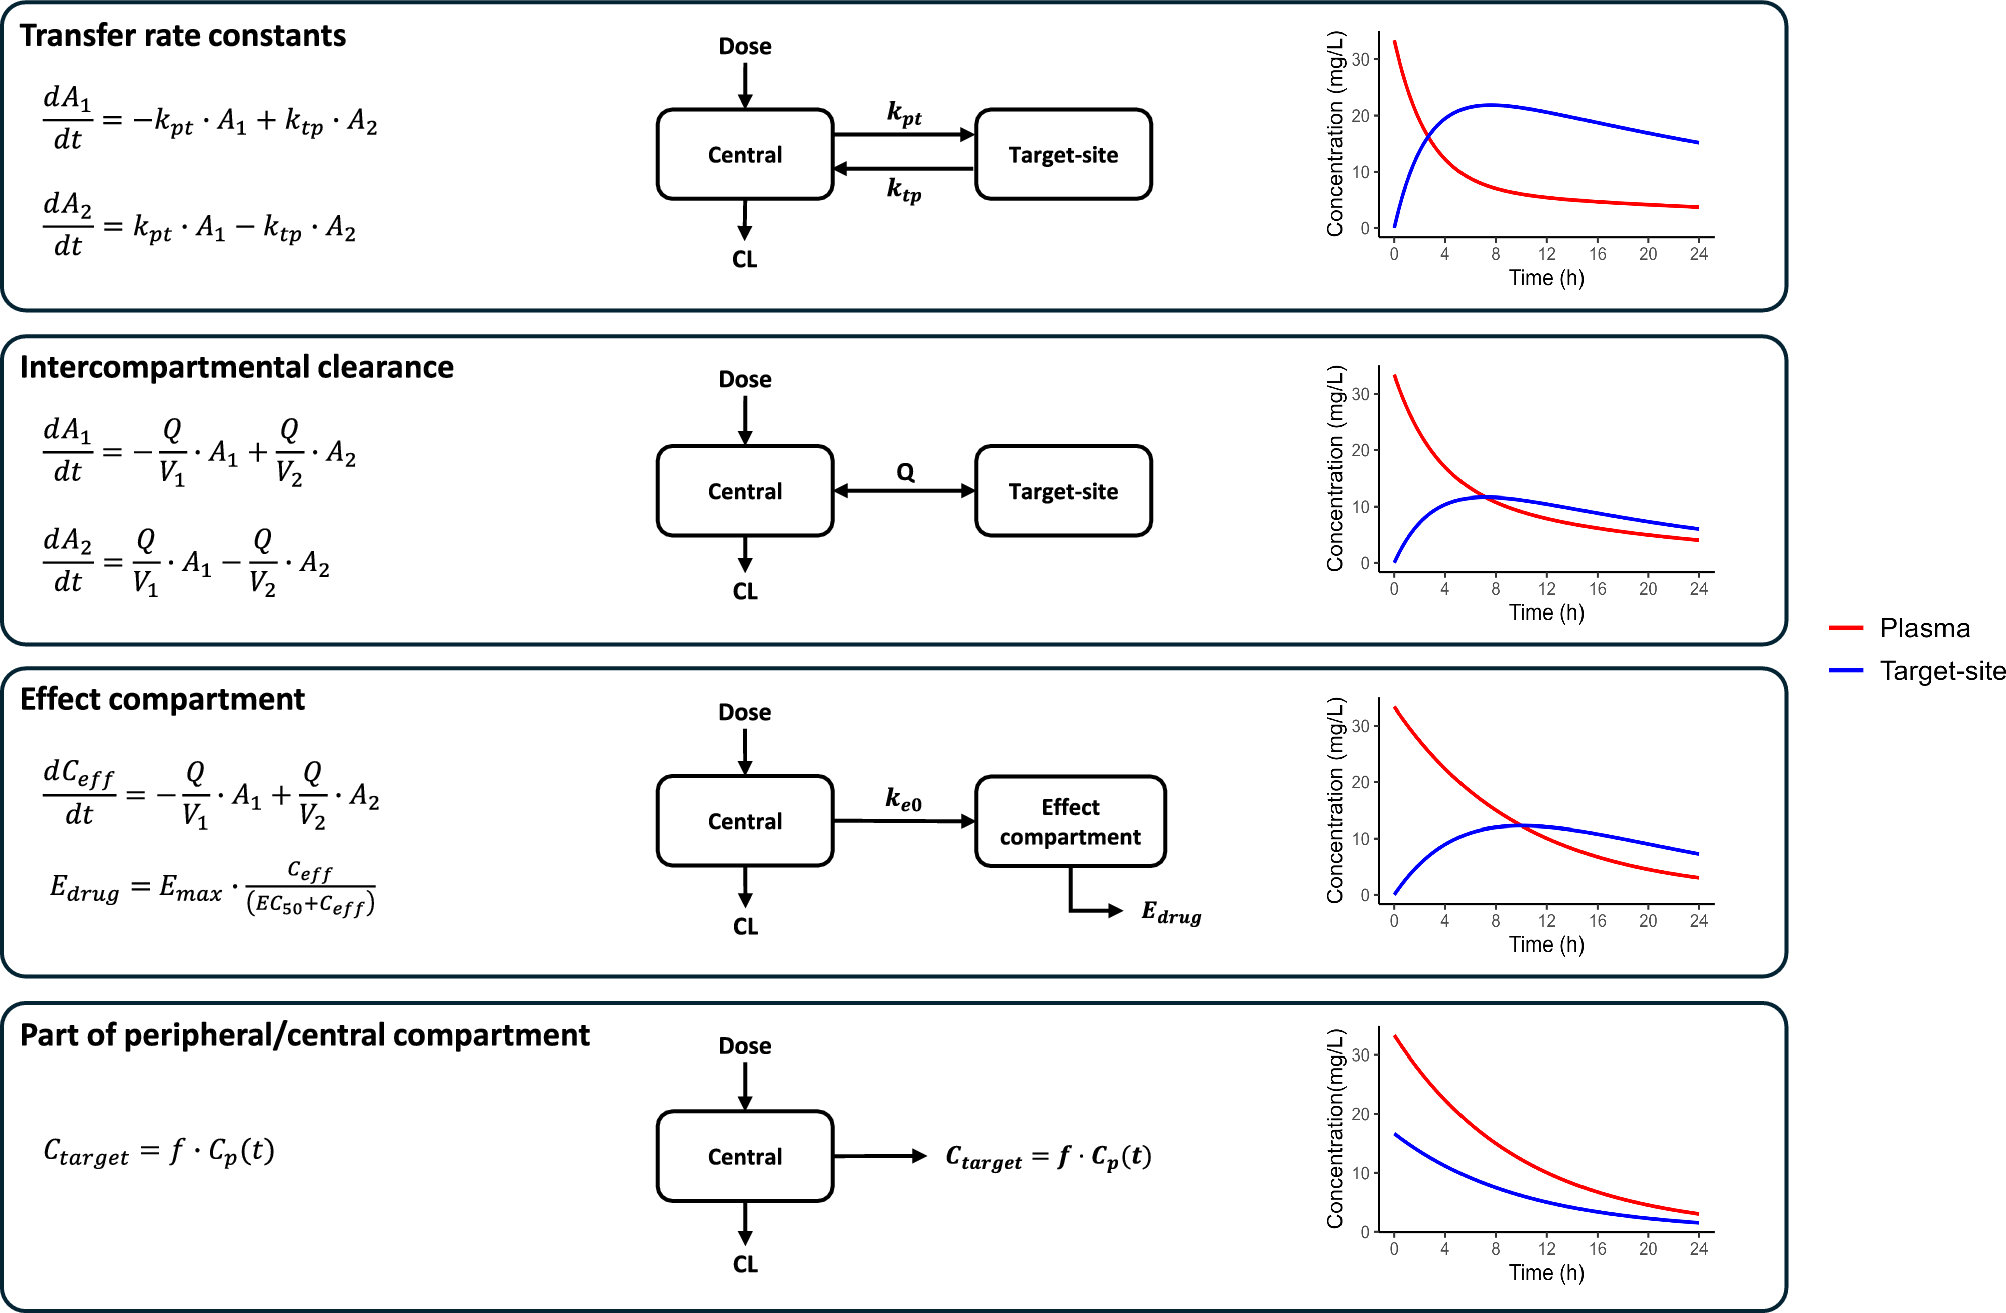
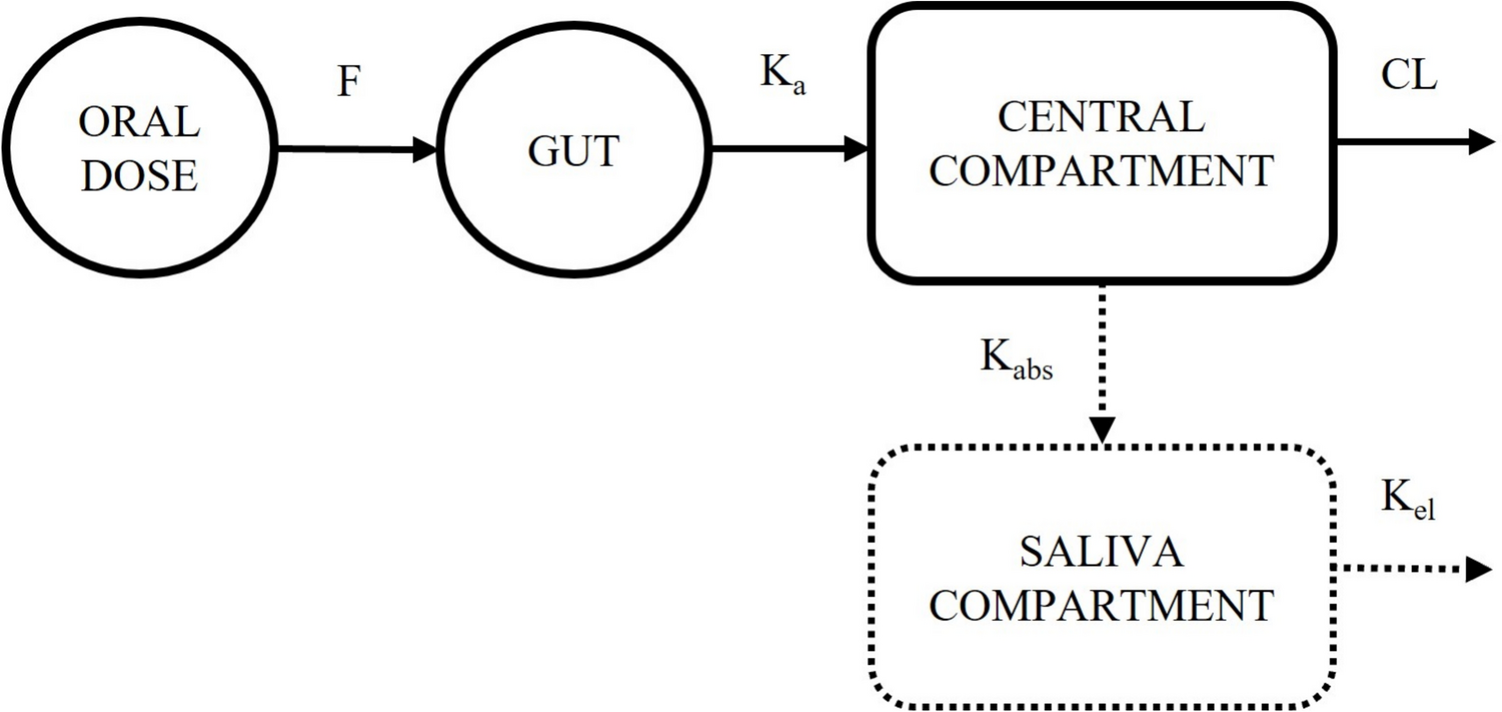
Next, the final plasma pharmacokinetic model was extended by incorporating a salivary bio-compartment, resulting in a combined model that simultaneously characterises levofloxacin pharmacokinetics in both plasma and saliva. Two different structural saliva models were evaluated: (1) a separate saliva compartment (Fig. 1) and (2) a central compartment with a scaling factor for saliva compartment (Fig. S1) [26, 27].
Fig. 1 The alternative text for this image may have been generated using AI.
The conceptual model for plasma and saliva pharmacokinetic of levofloxacin. CL central clearance, F oral bioavailability, Ka absorption rate constant, Kabs first-order saliva absorption rate, Kel elimination rate from saliva compartment. The solid lines in the central compartment represent the pharmacokinetic profile of levofloxacin in plasma, whilst the dotted lines in the saliva compartment represent a hypothetical effect compartment without a volume
To evaluate the effect of differences in body size, both body weight and fat-free mass were tested as body size descriptors using allometric scaling [28, 29]. Allometric models were tested using both fixed exponents (0.75 for clearance and 1 for volume of distribution) and estimated exponents. To further explain part of the variability in pharmacokinetic parameters, the effect of other covariates on those parameters was assessed (Supplementary Material S2). Covariates included age, sex, renal and hepatic function markers. Scatterplots of pharmacokinetic parameters versus covariates were examined, and only covariates with a strong correlation (r > 0.5) were carried forward into the base model. For the forward inclusion, a covariate was deemed significant if its addition reduced the objective function value by ≥ 3.84 points (p < 0.05, degree of freedom = 1). In backward elimination, a covariate was removed from the full model if its deletion increased the objective function value by ≥ 6.63 points (p < 0.01, degree of freedom = 1). An automatic search process of covariates was implemented by a stepwise covariate modelling application in Perl-speaks-NONMEM.
For an internal evaluation, the final model was examined through numerical criteria (e.g., changes in the objective function value, precision of parameter estimates, shrinkage of interindividual variability and residual unexplained variability as well as condition number) and visual criteria (e.g. goodness-of-fit plot and visual predictive check plot [30]). We adopted a sampling importance resampling technique in Perl-speaks-NONMEM [31] to compute the median and 95% confidence intervals (CIs) of the parameter estimates and compare those values with the final model estimates. A samples/resamples (M/m) ratio of 5000/1000 was used [31].
2.4 Simulation of Limited Sampling StrategiesTo illustrate the utility of the developed popPK model, multiple simulations were conducted. First, the current saliva sampling strategy (samples collected at 0, 2, and 5 h post-dose) was evaluated for its ability to predict plasma AUC24 of levofloxacin using Bayesian maximum a posteriori (MAP) estimation. Then alternative saliva sampling strategies were investigated to identify timepoints that could accurately predict plasma AUC24.
2.4.1 Predictive Performance of the Current Saliva Sampling StrategyTo assess saliva-based predictions, MAP estimation was applied to 3-point saliva concentrations (0, 2, 5 h), and imputed full plasma profiles were used to calculate AUC24 via the trapezoidal rule (Fig. S2). To calculate reference plasma AUC24 estimates, the same principle was applied using 3-point plasma data as Bayesian priors. Paired t-tests compared saliva-based and reference plasma AUC24 estimates. A bias of ± 20% was deemed clinically acceptable for TDM purposes [32, 33]. Computational details of the simulations were presented in Supplementary Material S4.1.
2.4.2 Alternative Saliva Sampling StrategiesOne-, two-, and three-point saliva sampling strategies (n = 18) were explored using candidate timepoints from 0 to 24 h (including 6, 8, 10, 12, 14, and 16 h) (Fig. S3). For timepoints beyond the observed concentrations (0, 2, and 5 h), Bayesian MAP estimation was used to impute saliva concentrations. Simulated data were then used to evaluate predictive accuracy for plasma AUC24 under each strategy. Paired t-tests again compared saliva-based and reference AUC24 estimates, and an acceptable bias threshold was also set at 20%. Details were described in Supplementary Material S4.2.
Comments (0)