
Remember me
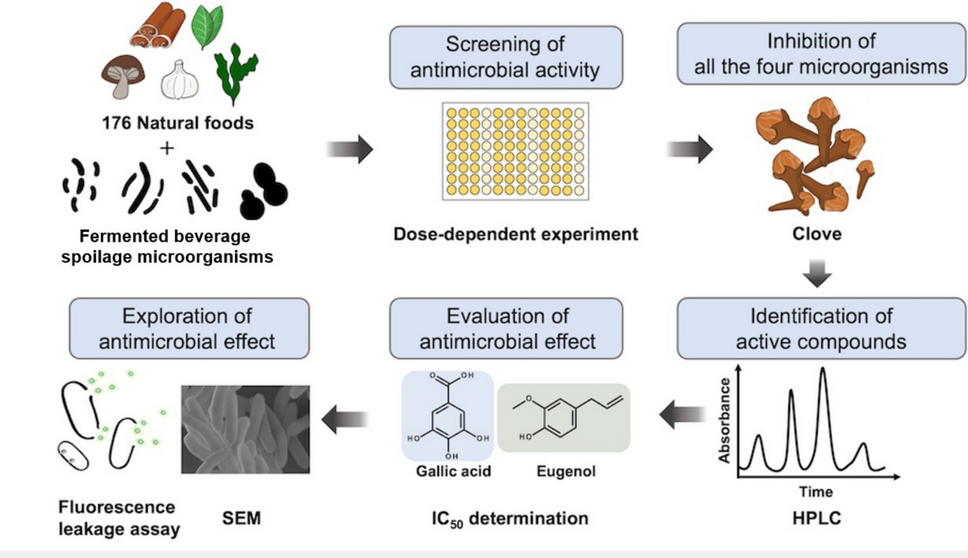
In the initial screening, the results obtained from the hot-water extracts demonstrated that 14 natural food extracts, including clove and cardamom, were effective against L. brevis at 7500 µg/mL. Similarly, 69 extracts, including mace and thyme, were effective against S. vineae at the same concentration, whereas 70 extracts, including mace and garlic, were effective against P. frisingensis, and nine extracts, including garlic and chives, were effective against S. cerevisiae var. diastaticus at 7500 µg/mL. Conversely, 50% ethanol extracts of clove, hop, and galangal showed an inhibitory effect on L. brevis, whereas 121 extracts were effective against S. vineae, 37 were effective against P. frisingensis, and 21 were effective against S. cerevisiae var. diastaticus.
Moreover, several extracts could inhibit the growth of two or three different microorganisms. Notably, among the two extraction methods employed here, only the extract derived from clove effectively inhibited the growth of all four tested beer spoilage microorganisms (Table S1).
Dose-dependent effects of the extractsAmong the six extracts selected for further evaluation, only the hot-water extract of clove was effective in inhibiting the growth of all four tested microorganisms (L. brevis, S. vineae, P. frisingensis, and S. cerevisiae var. diastaticus) in a concentration-dependent manner (Fig. 1). The inhibitory effect increased with increasing extract concentration. Notably, the crude extract of clove at concentrations as low as 750 μg/mL effectively inhibited the growth of the Gram-positive S. vineae and Gram-negative P. frisingensis (Fig. 1B, C), with a significant difference (P < 0.05) observed vs. the control. However, maca and milk thistle extracts did not exhibit antimicrobial activity under the tested conditions (Fig. 1).
Fig. 1
Dose–response effects of hot-water extracts of clove, cinnamon, bilberry, ginkgo, maca, and milk thistle against L. brevis (A), S. vineae (B), P. frisingensis (C), and S. cerevisiae var. diastaticus (D), evaluated by measuring optical density (OD600) after 3, 6, 6, and 2 days of incubation, respectively. Only the hot-water extracts that were effective in the initial screening were further evaluated. The results are presented as the mean ± standard error of three independent experiments (n = 3). Asterisks indicate significant differences compared with the control (0 µg/mL). Statistical significance was evaluated by one-way ANOVA followed by Tukey’s post hoc test. * (P < 0.05); ** (P < 0.01); *** (P < 0.001); **** (P < 0.0001)
HPLC analysis of the potential antimicrobial agents of cloveTwo peaks at 15.8 min and 35.6 min with the highest peak intensities were observed in the HPLC analysis of clove (Fig. 2A). Co-injection experiments with standard compounds confirmed that both peaks stemmed from clove constituents. Notably, peak 1 at 15.8 min corresponded to gallic acid, which exhibited hydrophilic properties consistent with the methanol concentration in the mobile phase (Fig. 2B). Peak 2 at 35.6 min was identified as eugenol, a hydrophobic compound, as the methanol concentration had reached its maximum (Fig. 2C). These results indicate that gallic acid and eugenol are major detectable constituents of the clove extract under the present analytical conditions (Fig. 2). Furthermore, HPLC fractionation indicated that fractions corresponding to gallic acid and eugenol exhibited antimicrobial activity, whereas the remaining detectable fractions showed no measurable inhibitory activity under the tested conditions (Fig. S2).
Fig. 2
High-performance liquid chromatography (HPLC) analysis of gallic acid and eugenol in clove hot-water extract (7500 µg/mL). A Chromatogram of the clove hot-water extract. B Chromatogram of the clove hot-water extract co-injected with standard gallic acid (peak 1, retention time = 15.8 min). C Chromatogram of the clove hot-water extract co-injected with standard eugenol (peak 2, retention time = 35.6 min)
Comparison of antimicrobial effects between potential antimicrobial agents extracted from clove and commercially available preservativesEugenol exhibited remarkable antimicrobial activity against L. brevis, S. vineae, P. frisingensis, and S. cerevisiae var. diastaticus, with half-maximal inhibitory concentration (IC50) values of 110, 180, 130, and 250 µg/mL, respectively (Fig. 3, Table 2). Gallic acid also demonstrated antimicrobial activity against L. brevis (IC50 = 3,000 µg/mL), S. vineae (IC50 = 400 µg/mL), and P. frisingensis (IC50 = 91 µg/mL), but was not effective against S. cerevisiae var. diastaticus. The gallic acid-related antioxidant propyl gallate also demonstrated a significant inhibitory effect against L. brevis (IC50 = 130 µg/mL), S. vineae (IC50 = 100 µg/mL), P. frisingensis (IC50 = 29 µg/mL), and S. cerevisiae var. diastaticus (IC50 = 1200 µg/mL). Compared with commercially available preservatives, potassium sorbate showed IC50 values of 1300, 1400, 160, and 110 µg/mL against L. brevis, S. vineae, P. frisingensis, and S. cerevisiae var. diastaticus, respectively. In contrast, sodium benzoate showed IC50 values of 360, 240, 76, and 220 µg/mL against the same microorganisms, respectively (Fig. 3, Table 2). The results showed that gallic acid, eugenol, and propyl gallate exhibited antimicrobial activity in acidic environments with IC50 values comparable to those of commercial preservatives, under the tested in vitro conditions, indicating their potential applicability.
Fig. 3
Dose–response curves of eugenol, gallic acid, and propyl gallate against L. brevis (A), S. vineae (B), P. frisingensis (C), and S. cerevisiae var. diastaticus (D). The commercially available preservatives potassium sorbate and sodium benzoate were used for comparison. ●, eugenol; ■, gallic acid; ▲, propyl gallate; ♦, potassium sorbate; ▼, sodium benzoate. The results are presented as the mean ± standard error of three independent experiments (n = 3). Curves were fitted by non-linear regression (four-parameter logistic model) to determine IC50 values
Mechanistic analysesScanning electron microscopy (SEM) evaluation of the morphology of treated microorganismsThe morphological changes of the target microorganisms were observed using SEM to characterize the mechanism underlying the effect of the active compounds on the cells. As shown in Fig. 4A–D, the untreated cells exhibited a typical bacillus fungal morphology with a smooth and intact surface. In turn, the cells of the positive control were visibly disrupted (arrows) (Fig. 4E–H).
Fig. 4
SEM images of L. brevis, S. vineae, P. frisingensis, and S. cerevisiae var. diastaticus treated with 4 × IC50 of gallic acid, eugenol, or propyl gallate for 2 h. Scale bar, 1 µm. A–D untreated control, E–H treated with Triton X-100, I–L treated with gallic acid, M–P treated with eugenol, and Q–T treated with propyl gallate
L. brevis treated with gallic acid, eugenol, and propyl gallate exhibited numerous small perforations and wrinkles on their surface (arrows), resulting in cellular damage (Fig. 4I, M, Q). S. vineae treated with gallic acid displayed severe wrinkling on their surface, whereas treatment with eugenol and propyl gallate led to wrinkling and lysis of the outer cell membrane (arrows) (Fig. 4J, N, R). Gallic acid, eugenol, and propyl gallate altered the cell morphology of P. frisingensis, as many malformed cells were observed, and there were wrinkles on the cell surface (arrows) (Fig. 4K, O, S). Notably, S. cerevisiae var. diastaticus cells treated with gallic acid exhibited no changes in morphology compared with naturally grown cells (arrows) (Fig. 4L), which is consistent with the results of the IC50, indicating that gallic acid has no inhibitory effect on S. cerevisiae var. diastaticus (Fig. 3, Table 2). In contrast, eugenol caused significant damage to S. cerevisiae var. diastaticus cells, and cells treated with propyl gallate exhibited melting features on the surface (arrows) (Fig. 4P, T).
Taken together, these SEM observations indicate the presence of morphological changes consistent with cell envelope perturbation, although they do not alone establish a definitive membrane-disruptive mechanism.
Fluorescence leakage assayBy measuring changes in fluorescence intensity, it was possible to assess the effects of different compounds on the cell membrane (Fig. 5A). The comparison of the fluorescence leakage induced by the compounds with that of the positive control allowed the quantification of the effect of the compounds on the cell membranes of the target microorganisms (Fig. S3). After treating L. brevis with 4 × IC50, 2 × IC50, and IC50 concentrations of gallic acid, emission rates of 30%, 14%, and 11% were observed, respectively (Fig. 5B). In comparison, the emission rates of S. vineae under the same treatment conditions were 16%, 15%, and 6%, respectively (Fig. 5C). In particular, when P. frisingensis and S. cerevisiae var. diastaticus were treated with a 4 × IC50 concentration of gallic acid, the emission rate only decreased to 3.0%. However, the treatment of P. frisingensis with different concentrations of gallic acid yielded significant differences, implying that gallic acid disrupted the cell membrane of P. frisingensis, although the effect was marginally significant. In turn, treatment of S. cerevisiae var. diastaticus did not yield significant differences between concentrations (Fig. 5D, E).
Fig. 5
Membrane perturbation evaluated using a fluorescence leakage assay (A). Fluorescence emission rates of L. brevis (B), S. vineae (C), P. frisingensis (D), and S. cerevisiae var. diastaticus (E) treated with 4 × IC50, 2 × IC50, or IC50 of each compound (gallic acid, eugenol, or propyl gallate). The IC50 values (µg/mL) are indicated in Table 2. The results are presented as the mean ± standard error of three independent experiments (n = 3). Asterisks indicate significant differences between groups. Statistical significance among different concentration groups was evaluated by one-way ANOVA followed by Tukey’s post hoc test for multiple comparisons. * (P < 0.05); ** (P < 0.01); *** (P < 0.001); **** (P < 0.0001); n.s. (no significant difference)
Under similar experimental conditions, treatment of L. brevis, S. vineae, and P. frisingensis with 4 × IC50 concentrations of eugenol resulted in emission rates of 36%, 25%, and 24%, respectively, indicating a tendency toward a decrease with decreasing concentrations (Fig. 5). For S. cerevisiae var. diastaticus, the emission rates were 24%, 21%, and 23% after treatment with 4 × IC50, 2 × IC50, and IC50 concentrations of eugenol, respectively (Fig. 5D).
In addition, the emission rates were 56%, 42%, 35%, and 49% after treatment of L. brevis, S. vineae, P. frisingensis, and S. cerevisiae var. diastaticus with 4 × IC50 concentrations of propyl gallate, respectively, also indicating a decreasing trend with decreasing concentration (Fig. 5).
Overall, these fluorescence leakage results demonstrate measurable but moderate membrane perturbation, suggesting that membrane effects contribute to the antimicrobial activity of the tested compounds but are unlikely to represent the sole mechanism of action.
The fluorescence intensity of the sample treated with the addition of 0.125% Triton X-100 to the microbial solution was used as the positive control.
MIC and MBC valuesMIC measurements (Table 3) indicated that eugenol exhibited MIC values of approximately 1000 µg/mL against L. brevis, 500 µg/mL against P. frisingensis, and 500 µg/mL against S. cerevisiae var. diastaticus. In contrast, gallic acid showed weaker antimicrobial activity, with an MIC of approximately 6000 µg/mL against L. brevis and 800 µg/mL against P. frisingensis. The MIC of gallic acid against S. cerevisiae var. diastaticus could not be determined within the tested concentration range (IC50 > 7500 µg/mL). The MIC for S. vineae could not be determined because reproducible growth suitable for MIC assessment was not achieved under the experimental conditions used in the present study.
Table 3 MIC and MBC values (µg/mL) of eugenol and gallic acid against L. brevis, P. frisingensis, and S. cerevisiae var. diastaticusaMBC measurements (Table 3) were determined for L. brevis only and were 1000 µg/mL for eugenol and 6000 µg/mL for gallic acid. MBC values were not assessed for the other tested microorganisms. For both compounds, the MIC and MBC values against L. brevis were identical under the present assay conditions.
Comments (0)