
Remember me

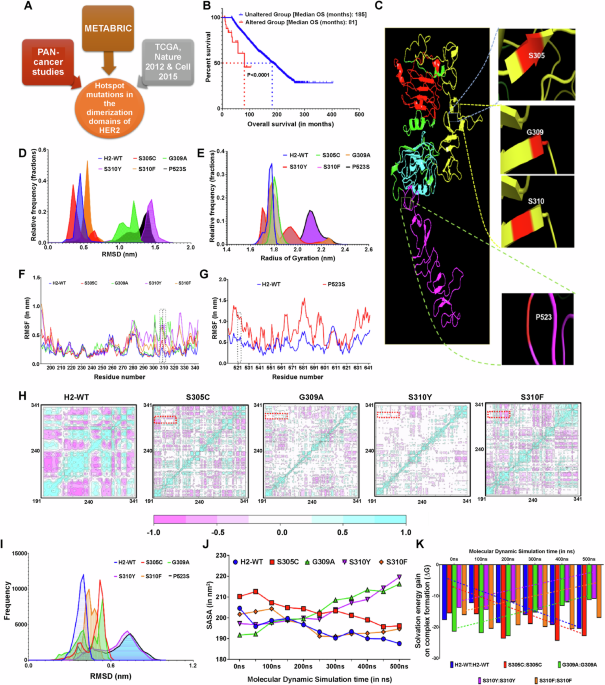
The prevalent mutations in the dimerization domains of HER2 and HER3 were identified using a comprehensive analysis of multiple tumor tissue databases enlisted in the “Materials and Methods” section (Fig. 1A). For HER2 dimerization domains, five hotspot mutations were identified, namely S305C, G309A, S310Y, S310F in domain II, and P523S in domain IV. We noted that mutations like S310Y and S310F (frequency ranging from 0.5% to 1.8%) are much more prevalent than other mutations i.e., S305C, G309A and P523S (frequency ranging from 0.01% to 0.1%) (Supplementary Table 3). Further, it was found that around 22% of the patients harboring these mutations were HER2-amplified (Supplementary Table 4). Interestingly, HER2, PIK3CA and PTEN mutations are mutually exclusive in BC patients (Supplementary Fig. S1A). Notably, patients harboring these mutations (n = 57) exhibited significantly reduced overall survival compared to HER2 wild-type (H2-WT) (n = 2936) (81 vs 185 months; P < 0.0001) (Fig. 1B). To analyze the 2-dimensional structural changes induced by these mutations, three standard tools, Panther [33], Provean [34], and Mupro [32], were employed. All dimerization domain mutants were found to be detrimental to the stability of HER2 structure, except for S305C, which did not destabilize the flanking amino acid chain (Fig. 1C and Supplementary Table 5).
Fig. 1: Structural and mechanistic insights into hotspot HER2 dimerization domain mutations (DDMs).
A Schematic representing the analysis pipeline of The Cancer Genome Atlas BC cohorts to identify the hotspot HER2 DDMs. B Kaplan–Meier curves comparing the overall survival between patients with wild-type HER2 (H2-WT) breast cancer (BC) (unaltered group, n = 2936) and those with HER2 DDMs (altered group, n = 57) demonstrated a hazard ratio of 0.04803 (95% confidence interval (CI): 0.01193–0.1934). C 3D protein structure model of HER2 in open form showing location of the five identified hotspot mutations. D Frequency distribution plot representing root mean square deviation (RMSD) frequency distribution of the monomer structures during 1 μs molecular dynamic simulation (MDS). E Frequency distribution plot of radius of gyration showing stable conformation for H2-WT and S305C, and unstable conformation for G309A, S310Y, and P523S. F, G Charts comparing root mean square fluctuations during MDS between H2-WT and domain II mutations (F); H2-WT and domain IV mutation (G). H Diagonal cross-correlation matrix analysis showing correlated (blue) and anti-correlated (pink) movements during simulation. I RMSD frequency distribution plot of respective homodimer structures during 500 ns MDS. J Line graph representing solvent accessible surface area estimated during simulation for H2-WT and DDMs. K Graph showing solvation gain on complex formation. Dashed trendlines indicate the trend of ΔG values of H2-WT and its DDMs during simulation.
Further insights into the 3D structural changes were obtained through long-term molecular dynamic simulation (MDS). Simulation results for H2-WT and S305C mutation revealed stable 3D structures, as evidenced by narrow root mean square deviation (RMSD) distribution (Fig. 1D). In contrast, G309A, S310Y, and P523S structures exhibited high fluctuations, indicated by broader RMSD distribution. Additionally, G309A, S310Y, S310F, and P523S caused drastic conformational changes, as demonstrated by their extensively broad radius of gyration (Rg) distribution (Fig. 1E). Interestingly, some of these point mutations caused a higher degree of instability in the flanking residues compared to H2-WT or S305C, suggesting a potential disruption to conventional HER2:HER2 interactions (Fig. 1F, G). Subsequent diagonal cross-correlation matrix analysis of the top three principal components highlighted that G309A and S310Y mutations compromised the structural integrity of the flanking residues in the H2-WT structure (Fig. 1H). A substantial shift from −1.0 to 0.0 in the anti-correlated movement in G309A and S310Y structures further suggested a probable disruption in the binding pocket essential for HER2:HER2 homodimer formation.
To further elucidate the impact of atomic changes induced by HER2 DDMs on their anticipated homodimer formation, we performed docking studies using energy-minimized structures of H2-WT, S305C, G309A, S310Y, S310F, and P523S on the HADDOCK server [36]. These complexes were then simulated for up to 500 ns each, with the H2-WT homodimer exhibiting the least RMSD fluctuation. Slightly broader RMSD frequency distribution highlighted the marginally less stable nature of the S305C:S305C homodimers. Interestingly, an extended and broad distribution suggested the instability of G309A, S310Y, and P523S homodimers (Fig. 1I). Further insights were obtained by analyzing the solvent accessible surface area (SASA) during the 500 ns simulations. The H2-WT and S305C homodimers showed a decrease of ~25 nm2 and 21 nm2, respectively, suggesting the closure of the dimer interface. In contrast, an increase of ~19 nm2 and 20 nm2 in the SASA for G309A and S310Y homodimers, respectively, suggested unstable dimer formation (Fig. 1J). Conversely, a slight decrease of ~5 nm2 in SASA for S310F dimer suggested a relatively unstable homodimer. Analyzing the total number of interactions with stabilized dimers revealed an increasing trend for H2-WT and S305C, while G309A and S310Y mutants showed a reverse trend (Supplementary Fig. S1B). The major stabilizing bond (hydrogen bond) involved in the stabilization of HER2:HER2 homodimers was comparatively less in number in all mutants studied (Supplementary Fig. S1C). Highly negative solvation energy gain on complex formation values (ΔG) during simulation for H2-WT and S305C highlighted the thermodynamic favorability of these homodimers. However, a decreasing trend in the negative values for G309A, S310Y, and S310F indicated thermodynamically unfavorable homodimers for these mutants (Fig. 1K).
Specific HER2 DDMs drive major change in receptor interaction dynamics from HER2:HER2 to HER2:HER3To validate the in silico observations, we formulated a hypothesis that HER2 DDMs, particularly G309A, S310Y, and P523S, may induce receptor switching from HER2:HER2 homodimer to HER2:HER3 heterodimer. To test this hypothesis, in vitro proximity ligation assay (PLA) was performed using a HER2-low cell line (MCF-7) after transiently overexpressing H2-WT or its DDM expression plasmids. Interestingly, cells expressing G309A, S310Y, S310F, and P523S mutations exhibited a significantly higher number (P < 0.0001) of HER2:HER3 puncta/cell compared to cells expressing H2-WT or S305C (Fig. 2A, B). These results strongly support the hypothesis that HER2 DDMs, specifically G309A, S310Y, and P523S, induce substantial structural changes in HER2, rendering HER2:HER2 homodimer formation unfeasible. Furthermore, defined secondary structure of proteins analyses revealed disruption in the secondary structures of HER2 during MDS for G309A and S310Y DDMs (Supplementary Fig. S2A–E).
Fig. 2: HER2 dimerization domain mutations (DDMs) induce receptor switching in breast cancer cells.
A Representative immunofluorescence photomicrographs of MCF-7 cells overexpressing wild-type HER2 (H2-WT) or DDMs, showing HER2:HER3 PLA puncta (red) after heregulin-1β stimulation. Scale bar: 10 μm. B Graph showing quantified number of puncta as in (A). Each dot represents a field with at least 5 cells. C Schematic depicting the establishment method of H2-WT or DDM expressing cell lines using HER2-high AU-565 and HER2-low ZR-75-1 cells. D Co-immunoprecipitation result using HER2 mAb in AU-565 cells. BO: bead only control, meaning lysate without HER2 mAb. Side panel showing immunoblot analysis for phospho- and pan-HER2 and HER3 in AU-565 cells. SS-Control: serum starved BC cells, EV: empty pc-DNA3.1 plasmid vector. E Reverse co-immunoprecipitation (co-IP) using HER3 mAb in ZR-75-1 cells showing physical interaction of H2-WT and DDMs with HER3 in presence of heregulin-1β ligand; side panel shows immunoblot analysis for phospho- and total HER2 and HER3 levels in ZR-75-1 cells. F Immunofluorescence photomicrographs showing HER2:HER3 PLA puncta (red) in ZR-75-1 cells with stable overexpression of H2-WT or DDMs after heregulin-1β stimulation; cross-stained for F-actin (green) and DAPI (blue); scale bar: 20 μm. G Graph showing average numbers of puncta counted as in (F). H PLA assessment results in ZR-75-1 cells for HER2:pHER2 homodimer in the absence of a ligand. I Graph showing average numbers of puncta counted as in (H). Each dot represents a field with at least 5 cells. Error bars represent ± standard deviation; *P < 0.05; **P < 0.01; ***P < 0.001, ****P < 0.0001; ns non-significant.
Subsequently, to validate the phenotypic effects of the observed receptor switching in BC cells, we established clonal cell lines overexpressing HER2 or one of its DDM transgene by plasmid transfection in ZR-75-1 (another HER2-low cell line). Additionally, in a HER2-high cell line (AU-565), we established a stable endogenous HER2 knockdown clone using lentiviral 3’-UTR transduction, followed by stable overexpression of S305C, S310Y, S310F, and P523S mutation (Fig. 2C). Co-immunoprecipitation (co-IP) results using AU-565 clonal cells clearly showed that G309A, S310Y, and P523S mutations indeed preferred HER3 as a binding partner, whereas H2-WT or the S305C mutation continued to form the homodimers (Fig. 2D). Interestingly, the observed lower amount of bound HER3 in case of S310F mutant suggests that this mutant retains its ability to form the homodimer to some extent. These results were further corroborated by checking phospho-HER3 expression in cells expressing G309A, S310Y, S310F, and P523S after heregulin-1β stimulation. The shift in the interaction dynamics of HER2 due to HER2 DDMs was also validated by performing co-IP and western blot analysis in the BT-474 cell line (another HER2-high BC cell line), (Supplementary Fig. S3A). Similarly, reverse co-IP was performed in ZR-75-1 cells stably overexpressing H2-WT or its DDMs, where cells expressing G309A, S310Y, S310F, and P523S mutations showed a strong physical interaction with HER3 in the presence of the ligand (Fig. 2E). However, no detectable interaction with HER3 was observed for H2-WT and S305C expressing cells. A substantial increment in p-HER3 expression further confirmed that G309A, S310Y, S310F, and P523S mutants form stable HER2:HER3 dimers.
PLA was also performed to delineate the HER2:HER2 homodimer or HER2:HER3 heterodimer formation in the presence and absence of the heregulin-1β ligand. Results revealed that ZR-75-1 cells expressing H2-WT and S305C formed ~15 and 13 puncta/cell, whereas G309A, S310Y, S310F, and P523S expressing cells exhibited significantly higher number of HER2:HER3 puncta/cells (~86 (P < 0.001), ~87 (P < 0.0001), ~65 (P < 0.001), and ~83 (P < 0.001), respectively) (Fig. 2F, G). The volume of individual HER2:HER3 puncta was also found to be significantly larger (P < 0.0001) in the mutant expressing cells (Supplementary Fig. S3B). In the absence of the ligand, ~77 and 71 HER2:pHER2 puncta/cell were observed in H2-WT and S305C overexpressing cells, respectively. Additionally, HER2:pHER2 puncta in H2-WT and S305C cells appeared significantly larger (P < 0.0001) than the cells expressing other mutants (Fig. 2H, I and Supplementary Fig. S3C). Similarly, in engineered 3’UTR endogenous knockdown AU-565 cells overexpressing wild-type or DDMs, higher numbers of HER2:HER3 puncta were observed in S310Y, S310F, and P523S expressing cells as compared to H2-WT and S305C expressing cells (Supplementary Fig. S3D).
HER2 DDMs induce alterations in receptor dimerization, leading to downstream signaling switchTransient over-expression of H2-WT and its DDMs in both HER2-low (ZR-75-1 and MCF-7) and HER2-high (AU-565 and BT-474) cell lines revealed a notable receptor switch from HER2:HER2 to HER2:HER3 interaction in cells expressing G309A, S310Y, and P523S mutations. This altered interaction dynamics was found to induce a downstream signaling switch. Furthermore, ZR-75-1 and AU-565 cells with stable overexpression of G309A, S310Y, and P523S mutants exhibited high p-AKT levels after ligand stimulation. In contrast, p-ERK levels were high in cells expressing H2-WT and S305C mutation (Fig. 3A and Supplementary Fig. S4A). The cells expressing S310F mutant, which formed both HER2:HER2 and HER2:HER3 dimer, exhibited evident activation of both ERK and AKT in immunoblot analysis.
Fig. 3: Receptor switching due to HER2 dimerization domain mutations (DDMs) in breast cancer cells changes downstream signaling.
A Western blot showing phospho- and panAKT, phospho- and panERK level in ZR-75-1 cells with overexpression of H2-WT and the DDMs as marked. HER2 and α-tubulin control blots were shown as well. Heatmap showing ERK activation measured using p-ERK bioluminescence resonance energy transfer (BRET) sensor (B) and AKT activation measured using p-AKT BRET sensor (C) after heregulin-1β stimulation in ZR-75-1 cells overexpressing wild-type HER2 (H2-WT) and DDMs. Each cell represents the mean of 3 replicates. D, E Representative array and heatmap showing the fold-change in phosphorylated proteins in H2-WT and its DDMs expressing cells. Respective arrays involved candidate proteins of MAPK and AKT signaling cascade. F Heatmap showing the corresponding transcript level measured for MAPK and AKT signaling molecules in H2-WT and its DDMs harboring patients with breast cancer; each column represents a patient from METABRIC dataset. G Co-immunoprecipitation result using HER2 mAb showing physical interaction specificity of HER2 DDMs with HER3 after HER3-TRIM-ing in ZR-75-1 clonal cells as marked. Loading amount was one-fifth of the amount used for immunoprecipitation; BO: bead only. Bottom immunoblot panels showing levels of phospho- and total AKT and ERK in H2-WT and its DDMs expressing cells after ligand stimulation and HER3-TRIM-ing; Control-SS: serum starved ZR-75-1 cells, EV: pcDNA-3.1 empty vector.
Furthermore, we evaluated p-AKT and p-ERK status by utilizing bioluminescence resonance energy transfer (BRET) phospho-sensors previously developed by our group for assessing ERK and AKT activation [42]. Here, use of these BRET sensors aided in live cell assessment of the dynamic signaling rewiring in HER2 DDMs expression condition. Upon heregulin-1β stimulation (10 ng/mL), H2-WT and S305C mutant expressing cells exhibited no significant increase in the p-ERK BRET sensor. Notably, G309A, S310Y, and P523S expressing cells also did not reveal a dramatic increase in the p-ERK BRET readings (Fig. 3B). Despite no substantial increment in the p-ERK sensor readings, H2-WT and S305C expressing cells showed an already elevated BRET ratio of the p-ERK sensor compared to other mutants. These results suggest that ERK signaling is activated by HER2 homodimer in a ligand-independent manner. In contrast, following heregulin-1β stimulation p-AKT sensor revealed a significant enhancement in AKT signaling in G309A, S310Y, and P523S mutants by ~6-fold, 6.9-fold, and 7-fold, respectively (Fig. 3C). Interestingly, a marginal increase in p-AKT readings in H2-WT and S305C expressing cells post-ligand stimulation suggests a preference for ERK signaling activation in these cells. S310F-harboring cells exhibited ~4-fold activation in ERK signaling and 4.5-fold activation in AKT signaling post-ligand treatment. Further, majority of the mutations studied showed peak activation within 5 min, except for H2-WT and S305C cells, where ERK activation showed activation within 1 min.
Although trastuzumab robustly attenuates ligand-independent HER2–HER3 signaling by suppressing basal HER2 phosphorylation and downstream PI3K/AKT pathway activation [43], it does not impede ligand-induced HER2:HER3 heterodimerization. Heregulin engagement of HER2:HER3 effectively drives receptor dimerization and downstream AKT signaling. Therefore, p-AKT and p-ERK BRET sensors were employed to fully evaluate the effect of trastuzumab treatment on H2-WT and its DDMs-expressing cells after heregulin stimulation. Results showed that trastuzumab treatment led to a dose-dependent inhibition in p-AKT and p-ERK signaling in H2-WT expressing cells (P < 0.0001; P < 0.001 respectively). In S310F mutant expressing cells, trastuzumab treatment inhibited AKT (P < 0.001) and ERK (P < 0.01) signaling, although the extent was not as substantial as that observed in H2-WT and S305C expressing cells. In contrast, G309A, S310Y, and P523S expressing cells exhibited intrinsic resistance to trastuzumab treatment (Supplementary Fig. S4B, C).
To provide further evidence on the differential activation status, human AKT and MAPK pathway phosphorylation arrays were employed (Fig. 3D, E). The S305C MAPK profile resembled H2-WT, showing strong p-ERK, p-MEK, and p-MSK2 activation, whereas G309A, S310Y, S310F, and P523S displayed lesser or no p-ERK induction. In contrast, the AKT array revealed elevated p-AKT in G309A (~2.6-fold), S310Y (~4.7-fold), S310F (~1.4-fold), and P523S (~2.4-fold) compared to H2-WT. Contrary to S305C cells showed only minor (~1.5-fold) increases, G309A and S310Y cells exhibited marked increase in p-PTEN (~3.8 and 10-fold) and p-P70S6K (~4.9 and 10.46-fold), confirming robust AKT signaling.
To strengthen the understanding of signaling switch induced by HER2 DDMs, transcriptome, and protein expression for BC patients, the METABRIC and Firehose Legacy datasets respectively, were analyzed. Notably, in METABRIC, similar to H2-WT (data not presented), patients harboring S305C mutation exhibited high expression of genes associated with the ERK signaling, while patients harboring S310F, G309A, and P523S mutations displayed elevated expression levels of genes associated with AKT signaling (Fig. 3F). Moreover, Firehose Legacy dataset showed a similar trend suggesting that these mutations preferentially interact with HER3, leading to the activation of PI3K-AKT signaling cascade (Supplementary Fig. S4D). We also found that HER2-high patient cohort from METABRIC showed higher expression of genes associated with the ERK signaling, which was not observed in HER2-low patient cohort (Supplementary Fig. S4E). To validate the shift in HER2 interaction dynamics following G309A, S310Y, S310F, and P523S mutations, we employed the ‘TRIM-ing’ mediated direct protein knock down methodology. Here, endogenous total HER3 protein was removed to confirm the specificity of HER2:HER3 heterodimer formation in G309A, S310Y, and P523S mutant HER2-expressing cells. Results revealed that under the HER3-TRIM-ing condition, heregulin-1β stimulation failed to induce physical interaction with HER3 in these mutant expressing cells. Moreover, a dramatic decrease in p-AKT levels was observed in G309A, S310Y, P523S, and S310F expressing cells, establishing the specific link between HER2:HER3 interaction and subsequent AKT signal activation. H2-WT and S305C expressing cells continued to form HER2:HER2 homodimers, and no change in p-ERK level was observed upon HER3 knockdown. This indicates that both H2-WT and S305C signal relies on HER2 homodimerization to activate the MAPK/ERK pathway, reflecting conventional, ligand-independent HER2 signaling behavior in these contexts (Fig. 3G).
Interaction with HER3 in cells expressing HER2 DDMs trigger intrinsic resistance to HER2-targeted therapyProliferation assay of ZR-75-1 cells expressing HER2 mutants revealed that G309A (P < 0.001), S310Y (P < 0.01), and P523S (P < 0.001) expressing BC cells were significantly more proliferative than H2-WT and S305C expressing BC cells, suggesting that BC cells harboring these mutations may be more aggressive in nature (Fig. 4A). Furthermore, short-term cell survival assessment revealed that mutants interacting with HER3 (G309A, S310Y, and P523S expressing cells) were resistant to trastuzumab (first-line of therapy) and neratinib (last line of therapy). However, H2-WT and S305C expressing cells remained highly sensitive to trastuzumab (P < 0.0001; P < 0.001) or neratinib (P < 0.0001; P < 0.001) (Supplementary Fig. S5A). Corroborating these results, G309A, S310Y, and P523S expressing BC cells were non-responsive to these drugs in a long-term survival assessment. Conversely, H2-WT expressing cells exhibited high sensitivity to trastuzumab (P < 0.01) and neratinib (P < 0.001). Similarly, S305C was highly responsive to trastuzumab (P < 0.001) and neratinib (P < 0.01). S310F expressing cells were slightly less sensitive to trastuzumab (P < 0.01) and neratinib (P < 0.01) than H2-WT and S305C expressing cells (Fig. 4B and Supplementary Fig. S5B). In the soft agar assay, G309A, S310Y, and P523S mutants were also resistant to trastuzumab treatment (Fig. 4C).
Fig. 4: Breast cancer cells expressing G309A, S310Y, and P523S induce intrinsic resistance to HER2-personalized medicines.
A Graph showing proliferation rate measured at every 24 h for 5 days in ZR-75-1 cells overexpressing wild-type HER2 (H2-WT) and its dimerization domain mutations (DDMs). The error bars represent 5 replicates per timepoint for each mutation. Graphs showing the long-term clonogenic survival potential of H2-WT and its DDMs expressing ZR-5-1 cells (B) and AU-565 cells (E) in the presence or absence of trastuzumab. The error bars represent 4 replicates per timepoint for each mutation. C Graph showing the 3D anchorage-independent growth of ZR-75-1 cells expressing H2-WT and its DDMs in the presence of trastuzumab. The error bars represent 3 replicates per timepoint for each mutation (D) Graph showing proliferation of H2-WT and its DDMs expressing cells. The error bars represent 10 fields per timepoint for each mutation. Representative photomicrographs and green fluorescence images depict proliferation of H2-WT and P523S expressing AU-565 cells at days 1, 3, and 5. F Graphs showing percentage of early and late apoptosis in ZR-75-1 cells expressing H2-WT or other DDM studied after trastuzumab treatment. The graph is representative of 3 replicates. Western blots of p-HER2, pan-HER2, cleaved PARP, and α-tubulin performed after treatment with high doses of trastuzumab (G) and neratinib (H) using AU-565 cells stably expressing H2-WT or DDMs. Error bars for all experiments represent ± standard deviation; *P < 0.05; **P < 0.01; ***P < 0.001 ****P < 0.0001; ns non-significant.
Similar results were found in AU-565 HER2 mutants over-expressing cells, wherein S310Y (P < 0.01) and P523S (P < 0.01) expressing cells demonstrated aggressive growth compared to H2-WT and S305C expressing cells (Fig. 4D). AU-565-S310Y (P < 0.0001; P < 0.0001) and AU-565-P523S (P < 0.001; P < 0.0001) cells exhibited resistance to both trastuzumab and neratinib, respectively, when compared to AU-565-H2-WT and AU-565-S305C expressing cells (Fig. 4E and Supplementary Fig. S5C). Annexin-propidium iodide (PI) assessment of ZR-75-1 cells expressing H2-WT and its DDMs underscored the resistance of G309A, S310Y, and P523S expressing cells even at elevated doses of trastuzumab (200 μg/mL and 400 μg/mL) (Fig. 4F and Supplementary Fig. S5D). Together, these results suggest that due to HER2:HER3 heterodimer formation, these cells are lesser dependent on HER2:HER2 signaling. Validating these findings, we also evaluated cleaved PARP levels in AU-565-H2-WT and some of the DDM expressing cells following treatment with trastuzumab (200 ng/mL and 400 ng/mL) and neratinib (20 nM and 40 nM). A pronounced increase in cleaved PARP levels was observed in H2-WT and S305C expressing cells in a dose-dependent manner, indicating efficient cellular apoptosis. However, S310Y and P523S expressing cells exhibited resistance to both the HER2-targeted drugs (Fig. 4G, H).
To compare HER2:HER3 interaction before and after trastuzumab treatment, PLA analysis was performed, which showed non-significant changes in red puncta formation in cells expressing DDMs. These results provide further evidence to our previous findings showing G309A, S310Y, and P523S are intrinsically resistant to trastuzumab, whereas S310F expressing cells formed fewer (~55 puncta/cell) puncta (Fig. 5A, B). Interestingly, it was found that H2-WT cells when treated with trastuzumab, resulted in reduced number of HER2:HER3 puncta. Although this observation didn’t reach statistical significance, it may indicate that HER2:HER3 interaction naturally occurs in H2-WT cells, but the cells are not dependent on that signaling. To unravel the underlying mechanism of reduced drug sensitivity in the DDM expressing cells under neratinib treatment, we performed immunoblot analysis across all lines developed using ZR-75-1 and AU-565 cells. Upon neratinib treatment, cells showed substantial attenuation in the p-HER2, p-ERK and p-AKT expressions in H2-WT and S305C expressing ZR-75-1 cells, and a slight attenuation in S310F cells. Meanwhile, G309A, S310Y, and P523S expressing cells showed no change in expression for the above activation marker, confirming the intrinsic resistant nature of these cells (Fig. 5C). To further validate, H2-WT or DDM expressing AU-565 cells were also treated with neratinib for 12 h and 24 h. These results revealed similar information about neratinib drug sensitivity of H2-WT and S305C expressing cells, a moderate sensitivity of S310F but an intrinsic resistance phenotype of S310Y and P523S cells, emphasizing inefficient neratinib inhibitory effect when signaling operates through HER2:HER3 hetero-dimer (Fig. 5D).
Fig. 5: Trastuzumab and neratinib treatment remained ineffective in cells expressing HER2 dimerization domain mutations (DDMs).
A Immunofluorescence images comparing HER2:HER3 PLA puncta (red) after trastuzumab treatment (300 μg/mL) for 24 h in ZR-75-1 cells stably expressing H2-WT, G309A, S310Y, S310F or P523S mutation. Scale bar: 20 μm B Graph showing the number of puncta counted from images as in (A); “+/-” represent trastuzumab treatment. Error bars represent ± standard deviation; ns non-significant. Each dot represents a field with at least 5 cells. C Western blots showing levels of phospho- and pan-HER2, HER3, AKT, and ERK, along with α-tubulin loading control in ZR-75-1 cells after neratinib treatment. D Immunoblots showing levels of phospho- and pan-HER2, HER3, AKT, and ERK, along with α-tubulin loading control in AU-565 cells expressing H2-WT, S305C, S310Y, S310F and P523S, after treatment of different doses of neratinib for 12 and 24 h. Pan-blots (total) are used for quantification of the respective phospho-protein in both (C, D).
BC tumors expressing G309A, S310Y and P523S DDMs are insensitive to HER2-targeted therapeutics and metastasize to distant organs in vivoFor preclinical evaluation, we used previously developed firefly luciferase-labeled ZR-75 cells over-expressing H2-WT, S310F, and P523S to perform bioluminescence imaging (BLI) guided preclinical evaluation of orthotopic tumor growth and trastuzumab treatment efficacy (Supplementary Fig. S6A). H2-WT over-expressing cells showed a remarkable ~104-fold (P < 0.001) decrease in average radiance values after receiving 3 weekly doses of trastuzumab (30 mg/kg intra-peritoneal injection per week), indicating substantial tumor growth reduction. Interestingly, tumor volume regression persisted even after treatment cessation, suggesting the efficacy of trastuzumab in tumor regression (Fig. 6A, B, Supplementary Fig. S6B). The S310F over-expressing BC tumors responded to the first dose of trastuzumab as indicated by ~10-fold decrease in average radiance values. However, compared to H2-WT expressing cells, these cells depicted lesser sensitivity over time (Fig. 6C, D, Supplementary Fig. S6B). In contrast, P523S expressing BC cells displayed intrinsic resistance to trastuzumab therapy, as no significant change in average radiance values between the untreated and trastuzumab-treated groups (Fig. 6E, F, Supplementary Fig. S6B). Notably, P523S and S310F expressing cells exhibited significant aggressiveness compared to H2-WT expressing cells. Post-treatment immunoblot analysis of the tumors revealed trastuzumab-induced dramatic reduction in p-HER2 levels only in the H2-WT tumor group, with no effect observed in S310F and P523S tumor groups (Fig. 6G).
Fig. 6: Analysis of in vivo therapeutic response of trastuzumab in orthotropic breast tumors.
A Representative bioluminescence images of H2-WT tumor-bearing mice in untreated and treated arms. B Graph representing quantitative photonic signal (average radiance) from tumor site of the mice over time. C Representative bioluminescence images of S310F tumor-bearing mice in untreated and treated arms. D Graph representing quantitative photonic signal (average radiance) from tumor site of the mice over time. E Representative bioluminescence images of P523S tumor-bearing mice in untreated and treated arms. F Graph representing quantitative photonic signal (average radiance) from tumor site of the mice over time. Error bars represent ± standard deviation for five mice/group. G Western blots showing levels of p-HER2, pan-HER2, p-HER3, and pan-HER3 measured from harvested H2-WT, S310F, and P523S tumor samples treated or untreated with trastuzumab. H Graph showing measured average radiance values from metastatic nodules in the harvested critical organs like lungs, liver, bone, and brain at the end point of the above three mice cohorts.
Further, we assessed in vivo metastasis in orthotopic tumor-bearing mice using BLI imaging as detailed in the previous section. In H2-WT tumor-bearing mice, we observed 100% metastasis in lungs and bone, 80% in liver, and 40% in the brain. Notably, trastuzumab treatment significantly reduced metastasis to the lungs (P < 0.01), liver (P < 0.05), bone (P < 0.01), and brain (P < 0.05) (Fig. 6H and Supplementary Fig. S6C, D). Interestingly, S310F mutant bearing tumor exhibited augmented metastatic incidence to these organs compared to the H2-WT group. Trastuzumab treatment significantly decreased the average radiance of lung (P < 0.05) and liver (P < 0.05) metastases, and dramatically reduced bone and brain metastasis. Consistent with our earlier observations, P523S mutant expressing cells demonstrated the highest metastatic loads in all major distant organs among the tested groups.
HER2 DDMs interacting with HER3 are more invasive in nature but remain sensitive to tucatinibResults accumulated so far suggest that HER2:HER3 heterodimer leading to AKT signaling drives higher proliferation in G309A, S310Y, S310F, and P523S mutant harboring BC cells. To evaluate whether these cells possess altered metastatic phenotypes, we assessed their invasion and collective migration abilities. H2-WT and S305C expressing ZR-75-1 cells exhibited ~20% wound closure, which was dramatically inhibited after trastuzumab and neratinib treatment (Fig. 7A and Supplementary Fig. S7A, B). Interestingly, G309A, S310Y, and P523S expressing cells healed wounds at a much faster rate within the same time, i.e., ~61% (P < 0.0001), ~65% (P < 0.0001), and ~70% (P < 0.0001) respectively. S310F overexpressing cells demonstrated ~10% (P < 0.01) higher migratory capacity than H2-WT cells. Treatment with HER2-targeted regimen led to a slight drop in the migratory capabilities of these cells. We also explored the impact of ERK or AKT inhibition on invasiveness using respective inhibitors on ZR-75-1-HER2 DDMs expressing cells. H2-WT and S305C mutant expressing cells exhibited dependence on HER2:HER2 homodimer regulated ERK signaling, resulting in a significant decrease of invasive potential for both H2-WT and S305C cells (P < 0.0001) upon ERK inhibition (Fig. 7B, C). Validating the signaling switch from ERK to AKT in G309A, S310Y, and P523S cells due to HER2:HER3 heterodimer prevalence, we found that only AKT inhibition caused ~10-fold (P < 0.0001), ~12-fold (P < 0.0001), and ~15-fold (P < 0.0001) decrease in the invasive potential, respectively. Notably, the invasiveness of S310F mutant harboring cells was also diminished with ERK and AKT inhibition. However, significant inhibition was observed with AKT inhibition, suggesting that although these cells exhibit activation of both ERK and AKT signaling pathways, their dependence primarily lies in AKT signaling mediated by HER2:HER3 heterodimer.
Fig. 7: Effect of HER2 dimerization domain mutations (DDMs) on cell invasion and migration properties.
A Graph showing collective migratory capabilities of wild-type HER2 (H2-WT) or DDM expressing ZR-75-1 cells. G309A, S310Y, and P523S mutant expressing cells exhibit nearly complete wound closure within 48 h, indicating enhanced migratory potential. The graph is representative of 3 biological replicates. These cells remain unresponsive to neratinib treatment, showing no change in wound closure capabilities. B Representative photomicrographs of CalceinAM stained H2-WT or DDM expressing ZR-75-1 cells showing matrigel invasive capabilities in absence or presence of p-AKT and p-ERK inhibitors. The graph is representative of 3 biological replicates (C) Heatmap showing the quantified total cell fluorescence/field of results as in (B). Corrected total cell fluorescence values were compared between untreated and treated conditions, ns-non-significant; **P < 0.01; ***P < 0.001 ****P < 0.0001. D Annexin V/PI-stained flow cytometry results showing H2-WT or the DDMs expressing cells before and after tucatinib treatment. E Representative photomicrographs showing matrigel invasive capabilities of H2-WT or the DDM expressing cells with or without tucatinib treatment. F Z-Score heatmap of H2-WT, S310Y and P523S mutant expressing cells against newer regimens of HER2 targeted therapy.
Recently, the Food and Drug Administration (FDA) approved tucatinib for use in metastatic HER2 + BC. A report highlighted the efficacy of tucatinib in inhibiting signaling pathways driven by both HER2:HER2 and HER2:HER3 interactions [44]. Short-term cell viability assessment indicated that tucatinib significantly inhibits the proliferation of H2-WT or the DDM expressing cells with comparable IC50 [IC50 range: 5.8–23.5 nM] (Supplementary Fig. S8A, B). Treatment with escalating doses of tucatinib significantly reduced the clonogenic potential of H2-WT and all mutants expressing cells (P < 0.0001) (Supplementary Fig. S8C). Apoptosis assessment after tucatinib treatment in these cell lines revealed a notable increase from ~1.9 ± 1.2% to ~36.63 ± 4.39% in early apoptotic cells, as well as late apoptotic cells from 2.3 ± 0.5% to ~25.62 ± 3.09%, confirming the efficacy of tucatinib in inhibiting both cases where HER2:HER2 homodimer and HER2:HER3 heterodimer signaling drives the cellular phenotype (Fig. 7D). Interestingly, the average cell migratory potential of G309A, S310Y, S310F, and P523S expressing cells was reduced from ~85% ± 7.8% to ~3% ± 0.08% (P < 0.0001) after tucatinib treatment (Supplementary Fig. S8D, E). The disruption of driver signaling after tucatinib treatment led to ~6.5-fold (P < 0.01), ~7.9-fold (P < 0.001), and ~ 8.2-fold (P < 0.001) decrease in the invasive potential of G309A, S310Y, and P523S expressing cells, respectively (Fig. 7E, Supplementary Fig. S8F).
Further, using H2-WT and the two most prevalent extracellular domain mutations (S310Y and P523S) cell lines, we have tested additional HER2 targeted drugs used in clinical practice. Consistent with the reported result in HER2-overexpressing models [45], reasonably good TDM1 response was observed in case of H2-WT and S310Y cell, whereas P523S showed a positive score, indicating lesser drug sensitivity (Supplementary Fig. S8G). By analyzing T-DM1, T-DXd, and Phesgo treatment response against the above three cell lines, the Z-score index suggests that both H2-WT and S310Y cells have reasonably good sensitivity for all these regimens, except for P523S, which showed less sensitivity to T-DXd treatment (Fig. 7F). Integrating all these results, it appears that the presence of P523S mutation in HER2 overexpressing BC cells potentiate higher treatment failure to the majority of the currently practicing HER2 drug candidates.
Comments (0)