
Remember me
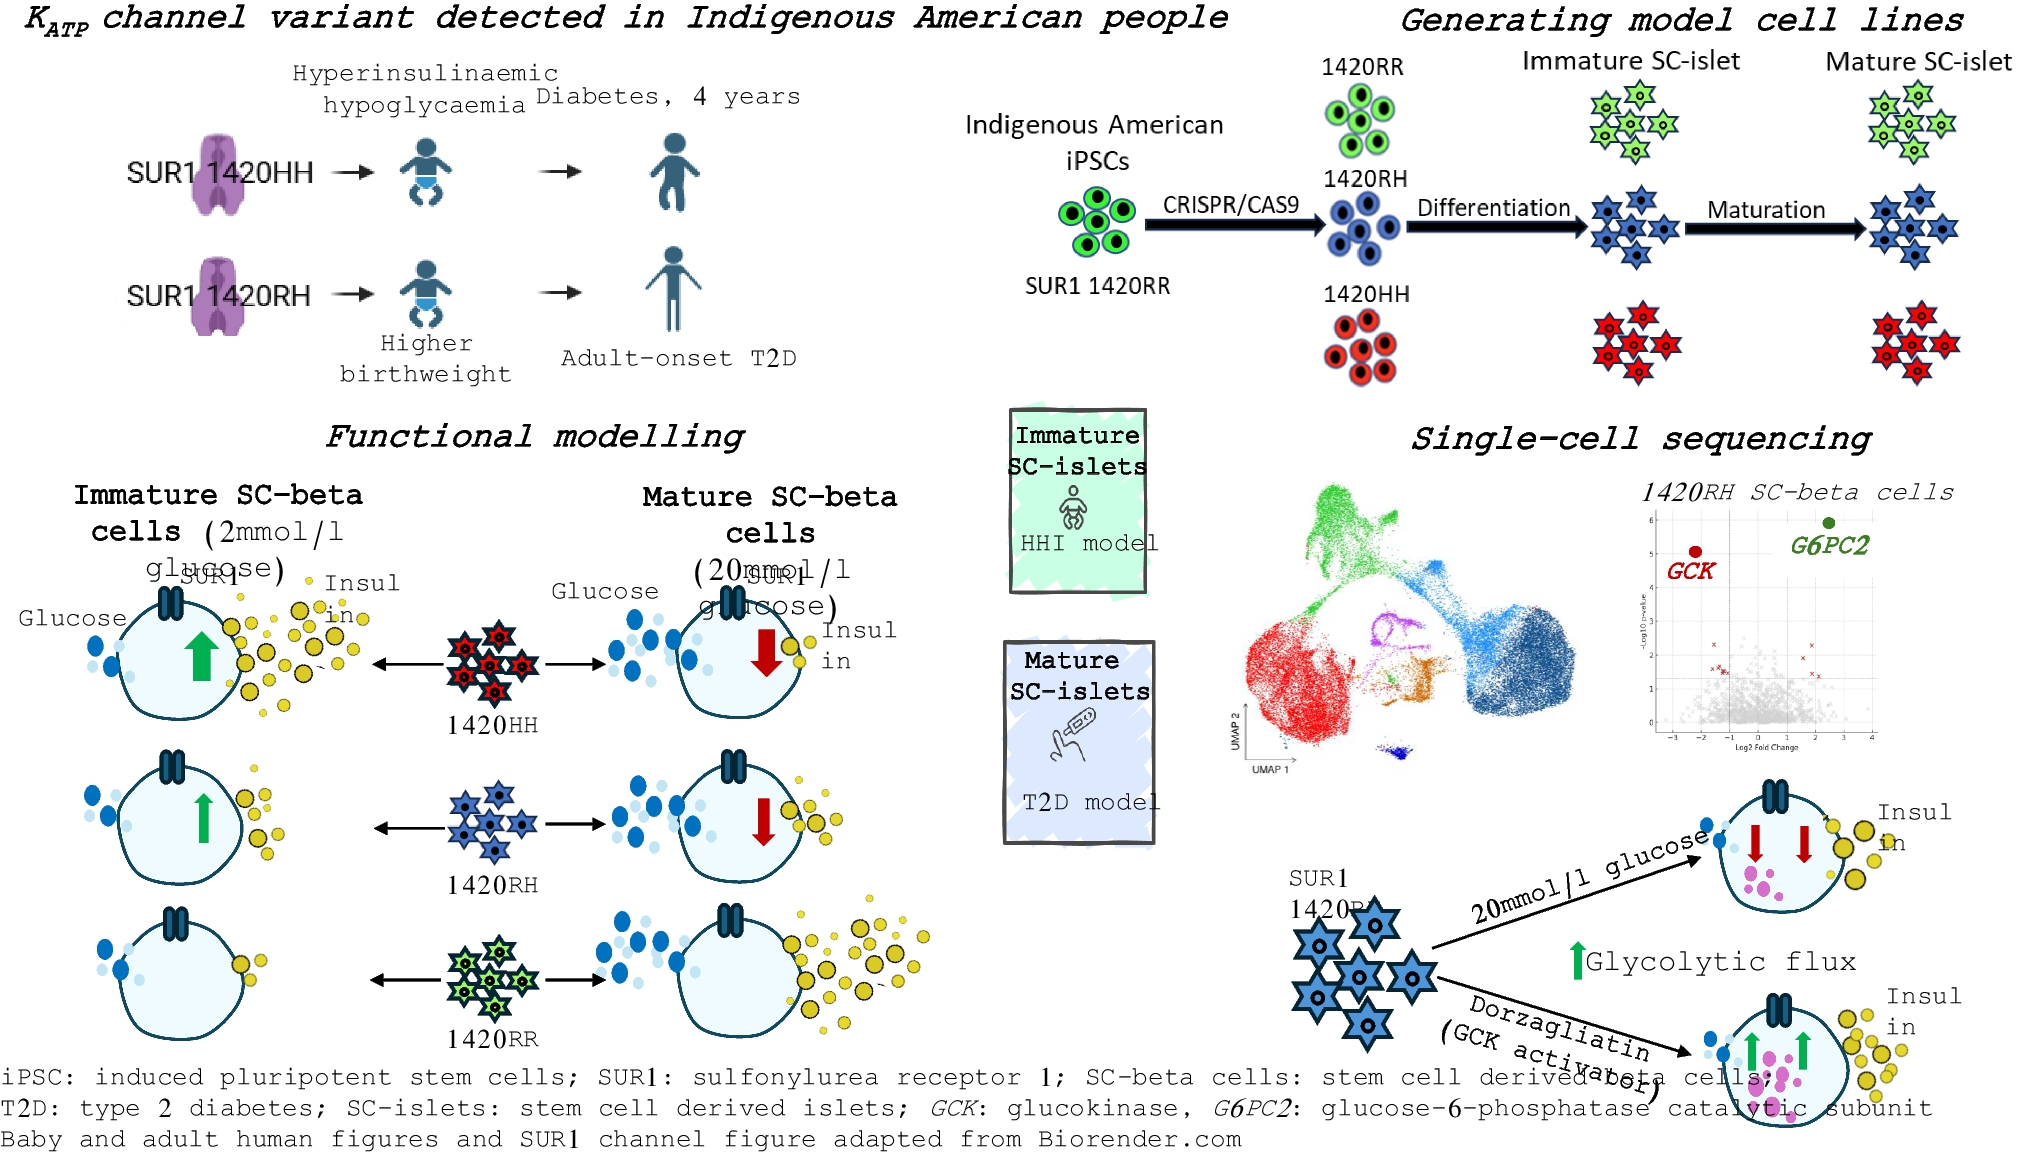
The human iPSC line HT273A was derived from an Indigenous American individual homozygous for the Arg (R; reference allele) at position 1420 of SUR1. We used CRISPR-cas9 to introduce the His-allele (H) at position 1420 (changing nucleotide G to A at NC_000011.9: g.17417205) and derived nine isogenic cell lines with all three genotypes (IS1 cell lines: 2 1420RR, 4 1420RH, 3 1420HH) by single-cell cloning (Fig. 1a). This ensured that all nine cell lines had undergone similar stress and culture condition during derivation. To further increase the reliability of our system, we used another iPSC line (HT261B) derived from an unrelated Indigenous American individual heterozygous for the variant (1420RH). Using CRISPR-Cas9 we derived a second set of nine isogenic cell lines with the three genotypes (Fig. 1a, IS2: 3 1420RR, 3 1420RH, 3 1420HH). These 18 cell lines were then used in different independent experiments to generate glucose-responsive SC-islets using a modified seven-stage differentiation protocol (Fig. 1b). For each differentiation, efficiency was monitored by real-time PCR analysis of islet developmental markers (Fig. 1c, ESM Figs. 4–6) and by flow cytometry analysis of pancreatic progenitor (PP) formation (stage 4 day 4 [S4D4]). Flow cytometry identified a median of 93.9% PDX1+ cells and 72.2% PDX1+ NKX6-1+ cells; the differentiation efficiency did not differ by genotype and was similar for both IS1 and IS2 cell lines (Fig. 1d). Consistent with previous reports that KATP channel variations do not affect PP generation [13], no significant increase in ABCC8 or KCNJ11 expression was observed relative to iPSCs (ESM Fig. 4a, b). Taken together, these results indicate that the SUR1 R1420H variation does not alter PP generation.
Immature SUR1 1420HH and 1420RH SC-islets show hyperinsulinaemia and are responsive to diazoxideThe PP cells were further differentiated towards the pancreatic endocrine lineage; by day 20 (stage 6 day 7 [S6D7]) of differentiation, we observed a robust increase in the expression of islet-specific genes including INS, GCG and SST (ESM Fig. 5a, b). The differentiation efficiency was comparable between the three genotypes (Fig. 1c and ESM Figs 5, 6). These S6D7 immature SC-islets are non-glucose responsive and are comparable with fetal islets [29]. Because the one individual carrying SUR1 1420HH had HHI and individuals with the 1420RH genotype had higher birthweights suggestive of fetal hyperinsulinaemia, we used these immature SC-islets to model the effects of R1420H on insulin secretion in utero and during infancy. A d-GSIS assay confirmed that these immature SC-islets did not have a strong response to high glucose (20 mmol/l) but were responsive to KCl (30 mmol/l) (Fig. 2a, d). Immature 1420HH SC-islets had 3.4-fold (IS1, Fig. 2b, p<0.001) and 4.2-fold (IS2, Fig. 2e, p=0.001) higher insulin secretion rates in low glucose (2 mmol/l) than the 1420RR immature SC-islets despite having a similar insulin content (IS1, Fig. 2c; IS2, Fig. 2f). Immature 1420RH SC-islets also had higher insulin secretion rates than 1420RR SC-islets but this difference was not statistically significant (IS1, 2.2-fold, p=0.12; IS2, 2.3-fold, p=0.12). Similar results were seen when data were normalised to total insulin content (ESM Fig. 7). We then assessed whether immature SC-islets with the His-allele were diazoxide responsive and, interestingly, immature SC-islets (both IS1 and IS2) with all three genotypes responded to diazoxide by reducing insulin secretion in both low and high glucose conditions (Fig. 2a, d). This suggests that this model could be used for screening therapeutic agents that may prevent HHI and that infants homozygous for the SUR1 R1420H variation would benefit from diazoxide use to reduce their hyperinsulinaemia.
Fig. 2
SUR1 1420HH and 1420RH immature SC-islets display insulin hypersecretion during basal glucose conditions and are diazoxide responsive (see also ESM Fig. 7). (a, d) Insulin secretion from immature SC-islets (S6D7) during d-GSIS assays (perifusion). IS1 differentiations 1–4 (a) (green line, 1420RR [n=6]; blue line, 1420RH [n=5]; red line, 1420HH [n=6]) and IS2 differentiations 5–7 (d) (green line, 1420RR; blue line, 1420RH; red line, 1420HH [all n=3]). Conditions were as follows: minutes 1–14, 2 mmol/l glucose (2G); minutes 15–50, 20 mmol/l glucose (20G); minutes 51–55, 2 mmol/l glucose; minutes 56–62, 2 mmol/l glucose + 100 µmol/l diazoxide; minutes 63–67, 2 mmol/l glucose; minutes 68–74, 20 mmol/l glucose + 100 µmol/l diazoxide; minutes 75–78, 2 mmol/l glucose; minutes 79–85, 2 mmol/l glucose + 30 mmol/l KCl. Data are presented as mean ± SEM. (b, e) Basal insulin secretion (during minutes 1–12) from IS1 immature SC-islets (b) and IS2 immature SC-islets (e). **p<0.01, ***p<0.001. Data are presented as mean ± SEM. n, as for (a) and (d), respectively. (c, f) Total insulin content in the IS1 immature SC-islets (c) and IS2 immature SC-islets (f) used for the perifusion assays. Data are presented as mean ± SEM. n, as for (a) and (d), respectively. LG, low glucose (2 mmol/l glucose)
SC-islet maturation, composition and hormone contentTo model the temporal changes in insulin secretion due to the SUR1 R1420H variation after childbirth and during adulthood, we further differentiated the S6D7 immature SC-islets to a more adult-like mature stage (stage 7 week1 [S7W1] and stage 7 week 2 [S7W2]). We first compared the maturation efficiency by assessing the expression of maturation markers, hormone content and islet composition in these mature SC-islets. During S7W1 and S7W2, there was a significant upregulation in the expression of islet maturation marker genes (GCK, GLP1R, PCSK1, SLC2A2 and G6PC2) and hormone genes (INS, GCG and SST) relative to S6D7 immature SC-islets, while NEUROG3 expression (essential for endocrine commitment of PP cells) was significantly reduced (Fig. 3a). The change in gene expression in S7W1 and S7W2 mature SC-islets relative to immature SC-islets did not differ by genotype (ESM Fig. 8). The insulin and glucagon contents of S7W2 SC-islets were comparable with those of adult islet preparations [17] and had a favourable proinsulin/insulin ratio (<0.1 for IS1 and <0.2 for IS2) indicating proper insulin processing, and differed by genotype only in IS1 1420RH SC-islets wherein a significantly higher insulin content (difference in mean ± SEM=2.8 ± 1.1 µg of insulin/µg of DNA, p=0.03) was observed compared with IS1 normal SC-islets (Fig. 3b–d).
Fig. 3
SC-islet maturation, composition and hormone content (see also ESM Figs 8 and 9). (a) Fold change in mRNA expression of select maturation markers at S7W1 (day 27) and S7W2 (day 34) of differentiation relative to mRNA expression levels in immature SC-islets (S6D7). IS1 cells (differentiations 2–6): green circles, 1420RR (n=7); blue circles, 1420RH (n=6); red circles, 1420HH (n=4). IS2 cells (differentiations 5–7): green triangles, 1420RR; blue triangles, 1420RH; red triangles, 1420HH (all n=3). **p<0.01 and ***p<0.001 for S6D7 vs S7W2 cells after correction for multiple testing (Šídák–Bonferroni method). Data are presented as mean ± SD. Two data points (G6PC2 1420RH and G6PC2 1420HH >8.0) are not represented in the figure for scaling purposes. (b) Insulin content in S7W2 mature SC-islets. IS1 cells (differentiations 1–6): green bars, 1420RR (n=8); blue bars, 1420RH (n=7); red bars, 1420HH (n=4). IS2 cells (differentiations 5–7): green bars, 1420RR; blue bars, 1420RH; red bars, 1420HH (all n=3). *p<0.05. Data are presented as mean ± SD. (c, d) Glucagon content (c) and proinsulin/insulin ratio (d) in S7W2 mature SC-islets. IS1 cells (differentiations 2–6): green bars, 1420RR (n=7); blue bars, 1420RH (n=6); red bars, 1420HH (n=4). IS2 cells (differentiations 5–7): green bars, 1420RR; blue bars, 1420RH; red bars, 1420HH (all n=3). Data are presented as mean ± SD. (e, f) Representative flow cytometry plots for INS/NKX6-1 staining (e) and INS/GCG staining (f) in mature SC-islets (S7W2, day 34) generated from IS1 and IS2 1420RR, 1420RH and 1420HH cell lines. Representative plots for INS/NKX6-1 and INS/GCG from different differentiations are shown
The proportion of functional SC-beta cells (INS+NKX6-1+ cells) was also not statistically different among the isogenic SC-islets with the three genotypes (ESM Fig. 9c, e); however, there was a notable difference when comparing the proportion of SC-beta cells between the IS1 and IS2 cell lines (median, IS1: 1420RR=47.6%; 1420RH=59.5%; 1420HH=51%; and median, IS2: 1420RR=24.2%; 1420RH=27.2%; 1420HH=23.3%) (Fig. 3e, f and ESM Fig. 9g, h). The Indigenous community from which the IS1 and IS2 cell lines were derived is known to have common variation in the KCNQ1 gene, a well-established locus for type 2 diabetes, where more than half of the community carries KCNQ1 risk alleles that affect beta cell mass and have a notable impact on type 2 diabetes risk [22, 30, 31]. Sanger sequencing across the KCNQ1 region in the IS1 and IS2 parental lines revealed that IS1 is homozygous for the KCNQ1 non-risk alleles and IS2 is heterozygous for the KCNQ1 type 2 diabetes risk alleles. This suggests that the difference in SC-beta cell proportion may be driven by key genomic variability (e.g. variants in the KCNQ1 locus) between IS-1 and IS-2 rather than experimental variability, underscoring the importance of comparing isogenic cell lines to avoid bias introduced by additional genomic variation between individuals. The proportion of GCG+ cells were also similar among the SC-islets with the three genotypes (ESM Fig. 9d, f). Taken together, these results indicate proper generation of mature SC-islets with all three genotypes.
SUR1 1420HH and 1420RH SC-islets have lower or no insulin secretory response to glucose and tolbutamideNext, we performed d-GSIS assays to assess insulin secretory responses from these S7W1 (day 27) and S7W2 (day 34) mature SC-islets. A significant reduction in basal insulin secretion (2 mmol/l stimulation) was observed in IS1 mature SC-islets (S7W2) compared with immature SC-islets (2.9-fold reduction in 1420RR [p<0.001], 3.3-fold in 1420RH [p=0.07] and 3.1-fold in 1420HH [p=0.001] mature SC-islets); however, the 1420RH (1.5-fold, p=0.05) and 1420HH (3.0-fold, p=0.008) mature SC-islets had a greater basal insulin secretion rate than normal 1420RR SC-islets (Fig. 4a and ESM Fig. 10a, b). Increasing the glucose concentration from 2 mmol/l to 20 mmol/l resulted in a biphasic insulin secretory response from both S7W1 and S7W2 1420RR and 1420RH SC-islets but only a weak first-phase response from 1420HH SC-islets. 1420RR SC-islets had stronger response to glucose than either 1420RH or 1420HH SC-islets (Fig. 4b and ESM Fig. 10c, d). No significant increase in either the first- or the second-phase insulin secretory response was seen in 1420HH SC-islets after maturation (day 27 and day 34, Fig. 4c), while both the normal 1420RR SC-islets (first-phase SI=8.1, second-phase SI=8.5) and 1420RH SC-islets (first-phase SI=4.4, second-phase SI=2.7) had a significantly higher SI after maturation (S7W2, day 34) compared with immature SC-islets (Fig. 4c; 1420RR, p<0.001 for both first and second phases; 1420RH, p=0.001 for first phase and p=0.01 for second phase). The AUC for insulin secretion from mature SC-islets during the high glucose phase increased from S7W1 to S7W2 for the 1420RR SC-islets (1.9-fold increase, p<0.001) and 1420RH SC-islets (1.5-fold increase, p=0.03) but there was no increase for 1420HH SC-islets (Fig. 4d). The corresponding AUC was significantly greater for the 1420RR SC-islets compared with 1420RH SC-islets at both S7W1 (0.54 vs 0.37 [insulin secretion AUC as a % of total insulin], p=0.03) and S7W2 (1.04 vs 0.56, p<0.001) (Fig. 4d,) suggesting an impaired insulin secretory response to glucose from 1420RH SC-islets as well.
Fig. 4
SUR1 1420HH and 1420RH mature SC-islets have a lower insulin secretory response to glucose and tolbutamide (see also ESM Fig. 10). Insulin secretion during d-GSIS assays (perifusion) from mature SC-islets (S7W1 and S7W2). Conditions were as follows: minutes 1–14, 2 mmol/l glucose (2G); minutes 15–44, 20 mmol/l glucose (20G); and minutes 45–50, 20G + 100 µmol/l tolbutamide. IS1-S7W1 (differentiations 1–4): 1420RR, n=5; 1420RH, n=5; 1420HH, n=4. IS1-S7W2 (differentiations 1–4): 1420RR, n=6; 1420RH, n=5; 1420HH, n=4. IS2-S7W1 and -S7W2 (differentiations 5–7): 1420RR, n=3; 1420RH, n=3; 1420HH, n=3. For (a–k): green, 1420RR; blue, 1420RH; red, 1420HH. *p<0.05, **p<0.01, ***p<0.001. (a, e) Insulin secretion/min during the first 12 min (2G) from IS1 SC islets (a) and IS2 SC-islets (e) at S7W1 (day 27) and S7W2 (day 34). Insulin secretion from S6D7 immature SC-islets (day 20) is also shown. Data are presented as mean ± SEM. (b, f) Biphasic insulin secretory response to 20G, shown as SI (fold increase in insulin secretion compared with secretion when stimulated with 2G [first 12 min]), during the first 44 min (minutes 1–14 with 2G and minutes 15–44 with 20G) using S7W1 (day 27) and S7W2 (day 34) IS1 SC-islets (b) and IS2 SC-islets (f). Data are presented as mean ± SEM. Insulin secretory response from S6D7 (day 20) immature SC-islets is also shown for comparison. (c, g) SI during first-phase (minutes 15–24), second-phase (minutes 25–44) and combined stimulation with 20G at S6D7, S7W1 and S7W2 from IS1 SC-islets (c) and IS2 SC-islets (g). Data are presented as mean ± SD. (d, h) Insulin secretion as AUC during 20G stimulation using S7W1 and S7W2 IS1 SC-islets (d) and IS2 SC-islets (h). Data are presented as mean ± SEM. (i) insulin secretion from immature and mature IS1 SC-islets with the three genotypes when stimulated with either 2G or 20G. (j, k) Insulin secretory response (SI) to tolbutamide (T) from S7W2 IS1 SC-islets (j) and IS2 SC-islets (k). Data are presented as mean ± SD. Avg, average; %TI, percent of total insulin
Consistent with a lower proportion of functional beta cells, the IS2 SC-islets also had lower insulin secretory response to glucose. However, directionally comparable results were seen from these SC-islets as well when comparing the effect of the SUR1 R1420H variation on insulin secretory response to glucose (Fig. 4e–h and ESM Fig. 10e–h).
Our d-GSIS results suggest that the 1420RH and 1420HH SC-islets have higher insulin secretion in response to both low glucose and high glucose when they are immature, and upon maturation there is a tighter regulation of insulin secretion in low glucose condition (Fig. 4i). However, in contrast to 1420RR SC-islets, the 1420RH and 1420HH SC-islets secrete a lower per cent of their insulin content and either have lower or no insulin secretory response, respectively, to glucose challenge after maturation (Fig. 4i). These results provide experimental evidence that an insulin secretory defect is the primary cause for the higher type 2 diabetes risk in individuals with the SUR1 1420RH variation.
We then tested whether our model could be used for testing therapeutic agents for improvement of insulin secretory response from islets with the KATP channel LoF variations. For this, we assessed the effect of the KATP channel blocker tolbutamide on insulin secretion from mature SC-islets. As expected, the 1420RR SC-islets had increased insulin secretion (SI=31.5), while the 1420RH (SI=13.2) and 1420HH SC-islets (SI=1.9) had a significantly lower or no response to tolbutamide (Fig. 4j, k and ESM Fig. 10).
Heterozygous 1420RH SC-islets have blunted response to increasing glucose concentrationImmature heterozygous 1420RH SC-islets display mild hyperinsulinaemia but after maturation have lower insulin secretory response to maximal glucose. Therefore, we examined the response of these SC-islets to a range of glucose concentrations. When the mature 1420RH SC-islets were challenged with a range of glucose concentrations (5.5–25 mmol/l), we observed a blunted insulin secretory response to increasing glucose concentrations compared with the 1420RR SC-islets (Fig. 5a, b and ESM Fig. 11). The first-phase SI was significantly lower for the 1420RH SC-islets at all glucose concentrations, with larger differences seen at higher concentrations compared with 1420RR SC-islets (Fig. 5c and ESM Fig. 11m, n) while the second-phase response was significantly different only at 25 mmol/l glucose concentration (Fig. 5d and ESM Fig. 11o).
Fig. 5
Mature SUR1 1420RH SC-islets have a blunted response to increasing glucose concentrations (see also ESM Fig. 11). S7W2 IS1 SC-islets (days 35–40, differentiations 3–5) were used for testing the effect of different glucose concentrations on the insulin secretory response by d-GSIS. The flow-through was collected every minute and assayed for insulin by ELISA. (a, b) Insulin secretory responses to different glucose concentrations from normal 1420RR (a, n=3) and heterozygous 1420RH (b, n=3) SC-islets. SC-islets were perifused with 2 mmol/l glucose (2G, minutes 1–7) followed by 5, 8, 11, 16.7 or 25 mmol/l glucose (minutes 8–24). Data are presented as mean ± SEM. (c, d) SI during first-phase (c, minutes 9–16) and second-phase (d, minutes 17–24) insulin secretion from normal 1420RR (green, n=3) and heterozygous 1420RH (blue, n=3) SC-islets stimulated with different glucose concentrations. Data are presented as mean ± SD. *p<0.05, **p<0.01, ***p<0.001
Heterozygous 1420RH SC-islets respond to GCK activator dorzagliatinThe lower insulin secretory response to increasing glucose concentrations could be due to reduced glycolytic flux resulting in lower ATP production and lower insulin secretion. GCK acts as the primary glucose sensor and its activity is a crucial determinant of ATP production in pancreatic beta cells [32]. To examine whether activation of GCK in the 1420RH SC-islets could improve insulin secretory response to glucose, the SC-islets were treated with the GCK activator dorzagliatin (25 μmol/l) during d-GSIS. Stimulation with high glucose in the presence of dorzagliatin resulted in a slight leftward shift of the first-phase insulin secretory curve, indicative of GCK activation (Fig. 6a–c). Dorzagliatin, in the presence of 11 mmol/l glucose (Fig. 6a, d, IS1 cells) or 20 mmol/l glucose (Fig. 6b, e, IS1 cells) resulted in improved first-phase insulin secretory response from 1420RH SC-islets (first-phase SI=7.3-fold and 3.9-fold [p=0.01] with and without dorzagliatin + 11 mmol/l glucose, respectively [Fig. 6d]; first-phase SI=9.0-fold and 5.5-fold [p=0.13] with and without dorzagliatin + 20 mmol/l glucose, respectively [Fig. 6e]). In contrast, dorzagliatin had a minimal effect on non-glucose-responsive 1420HH SC-islets (first-phase SI=2.3-fold and 1.9-fold with and without dorzagliatin + 20 mmol/l glucose, respectively [Fig. 6e]). Similar results were seen with mature SC-islets generated from IS2 cell lines (that have a lower proportion of SC-beta cells) as well when challenged with 20 mmol/l glucose in the presence of dorzagliatin (Fig. 6c, f).
Fig. 6
Mature 1420RH SC-islets respond to dorzagliatin. For testing the effect of dorzagliatin, S7W2 IS1 SC-islets (a, b, d, e) and IS2 SC-islets (c, f) were used. SC-islets were perifused with KRB containing 2 mmol/l glucose (2G, minutes 1–14) followed by 11 mmol/l glucose (11G) or 20 mmol/l glucose (20G, minutes 15–44) with or without 25 µmol/l dorzagliatin (DZG). The flowthrough was assessed for insulin secretion every minute. (a) Insulin secretory response (SI) from S7W2 IS1 heterozygous 1420RH SC-islets (differentiations 4–6) when treated with 11G glucose in the presence (dashed blue line) or absence (solid blue line) of DZG. The response from normal SC-islets (1420RR, green line) in the absence of DZG is shown as a reference. 1420RR, n=3; 1420RH, n=3. Data are presented as mean ± SEM. (b, c) Insulin secretory response from S7W2 IS1 (b) and IS2 (c) heterozygous 1420RH and homozygous 1420HH SC-islets when treated with 20G glucose in the presence (dashed blue line, 1420RH; dashed red line, 1420HH) or absence (solid blue line, 1420RH; solid red line, 1420HH) of DZG. The response from normal SC-islets (1420RR, green line) in the absence of DZG is shown as a reference. IS1 (differentiations 3–6): 1420RR, n=5; 1420RH, n=4; 1420HH, n=3. IS2 (differentiation 6 and 7): 1420RR, n=2; 1420RH, n=2; 1420HH, n=2. Data are presented as mean ± SEM. (d) First-phase peak, first-phase (minutes 15–22) and second-phase (minutes 23–44) SI during d-GSIS using S7W2 IS1 heterozygous 1420RH SC-islets (n=3) challenged with 11G in the presence (light blue bar) or absence (blue bar) of DZG. The SI of normal SC-islets (1420RR, n=3, green bar) in the absence of DZG is shown as a reference. Data are presented as mean ± SD. (e, f) First-phase peak, first-phase (minutes 15–22) and second-phase (minutes 23–44) SI during d-GSIS using S7W2 IS1 (e) and IS2 (f) heterozygous 1420RH and homozygous 1420HH SC-islets challenged with 20G in the presence (light blue bars, 1420RH; light red bars, 1420HH) or absence (blue bars, 1420RH; red bars, 1420HH) of DZG. The SI of normal SC-islets (1420RR, green bars) in the absence of DZG is shown as a reference. IS1 (differentiations 3–6): 1420RR, n=5; 1420RH, n=4; 1420HH, n=3. IS2 (differentiation 6 and 7): 1420RR, n=2; 1420RH, n=2; 1420HH, n=2. Data are presented as mean ± SD. *p<0.05
Transcriptome comparison of individual SC-islet cell types by SUR1 R1420HWe next looked at the transcriptomic changes that may explain the lower/no insulin secretory response to glucose in mature 1420RH and 1420HH SC-islets. Due to the known heterogeneity of islets (derived directly from humans or generated as SC-islets), we employed single-cell RNA-seq (scRNA-seq) to compare transcriptomes of pure population of SC-beta and SC-alpha cells from S7W4 (day 48) mature SC-islets with all three genotypes (ESM Fig. 12). We acquired scRNA-seq data from 35,593 cells generated from four independent differentiations using nine IS2 cell lines. We used Seurat for data processing and clustering and performed an unbiased differential gene expression analysis. The top 100 differentially expressed genes in each cluster was used for cell type assignment and these were consistent with the core identity genes for SC-beta, SC-alpha, iPSC-derived delta (SC-delta) and enterochromaffin cell types as reported by Schmidt et al [33] (see ESM Table 5). The identified SC-islet cell types included SC-alpha cells (30.7%), SC-beta cells (30.01%), duct-like cells (4.4%), SC-delta cells (1.3%) and proliferating cells (3.2%) (Fig. 7a–c). There was also a population of DPP4+/ALDH1A1+ cells (14.6%) that expressed several alpha cell markers but did not express GCG; however, this population did not differ by genotype and was classified as DPP4+/ALDH1A1+ cells (Fig. 7d, e). Consistent with previous single-cell sequencing reports of SC-islets, we also observed a population of cells that were positive for INS but expressed the enterochromaffin markers TPH1 and FEV (Fig. 7a–c). These cells were classified as enterochromaffin cells (15.7%). A higher number and proportion of SC-beta cells were recovered from 1420RR SC-islets after standard quality control (38.2% in 1420RR vs 21.2% in 1420RH vs 29.2% in 1420HH) but this difference was not statistically significant and was not consistent among the four separate differentiations (Fig. 7d, e). The proportions of the other cell types recovered from the four differentiations were also not statistically different between the normal SC-islets and KATP channel variant SC-islets (Fig. 7e and ESM Fig. 13a); however, we did observe a greater proportion of MKI67+ proliferating cells in SC-islets with the KATP channel variation (2.16% vs 3.6% vs 4.05% in 1420RR, 1420RH and 1420HH SC-islets, respectively). Islets generated from iPSCs may also contain polyhormonal SC-beta and SC-alpha cells (ESM Fig. 13b) that co-express INS and GCG [33]. We identified a small percentage (3.5%) of INS+/GCG+ cells and the distribution of these polyhormonal cells did not differ by genotype. In total, our clustering analysis identified 10,683 SC-beta cells and 10,937 SC-alpha cells that expressed core beta cell and alpha cell identity markers and had low expression of core markers of other SC-islet cell types (Fig. 7f). Before further analysis, INS+/GCG+ polyhormonal cells were removed from both the SC-beta and the SC-alpha cluster resulting in 10,621 SC-beta cells and 10,232 SC-alpha cells.
Fig. 7
Single-cell transcriptome analyses of S7W4 (day 48) IS2 SC-islets (see also ESM Table 5). (a) UMAP of 35,593 cells clustered and colour coded to indicate seven distinct cell types. (b) Feature plots showing expression (log1P SCT normalised counts) of representative marker genes for each cell type (INS, GCG, TPH1, KRT19, SST, MKI67). (c) Scaled expression heatmap showing the top differentially expressed genes (DEGs) for each cluster compared with all other clusters. (d) Bar graph showing the number of cells in each cluster by genotype. (e) Bar graph showing the percentage of cells in each cluster by genotype/clone and by different differentiations (IS2 differentiations 1–4). (f) Violin plots showing expression (log1P SCT normalised counts) of core markers of other islet cell types in the designated SC-alpha and SC-beta cluster. EC, enterochromaffin
Differentially expressed genes in SC-beta cells and SC-alpha cells with R1420H KATP channel variationNext, differential gene expression comparisons were performed for both SC-beta and SC-alpha cells separately as follows: 1420HH vs 1420RR cells; and 1420RH vs 1420RR cells. To account for differences in gene expression due to variation in differentiation efficiency occurring in samples with the same R1420H genotype, ‘sample’ was used as a latent variable. We identified 36 and 75 upregulated (p<0.05, log2 fold change [log2FC] >0.2) and 30 and 42 downregulated genes (p<0.05, log2FC <−0.2) in 1420HH SC-beta and SC-alpha cells, respectively (ESM Table 6). In 1420RH SC-beta and SC-alpha cells, 61 and 40 upregulated and 75 and 29 downregulated genes were identified, respectively (ESM Table 6). Alternatively, we took advantage of the fact that the cells were sourced from different differentiations and were generated using different clonal cell lines for each genotype. Differential gene expression analysis was performed separately for each of the four differentiations and genes that were significant in at least three of the four differentiations and the combined analysis (without adjustment for ‘sample’, log2FC >0.2 or log2FC < −0.2) were identified (ESM Tables 7, 8). Only genes that were common in both analyses were considered dysregulated (shown as enlarged red circles in Fig. 8a, b, d, e; see also ESM Tables 7, 8).
Fig. 8
Dysregulated genes in SC-beta and SC-alpha cells with SUR1 1420RH and 1420HH variation (see also ESM Tables 6–10). Data from single-cell sequencing of SC-islets from four independent differentiations using nine isogenic IS2 cell lines (three cell lines for each genotype). (a, b, d, e) MA plots showing upregulated and downregulated genes in homozygous 1420HH SC-beta cells (a) and SC-alpha cells (d) and in heterozygous 1420RH SC-beta cells (b) and SC-alpha cells (e) compared with normal 1420RR SC-beta and SC-alpha cells, respectively. Dysregulated genes are highlighted as larger red circles. Three data points are not represented in the figure for scaling purposes: MEG3 in (b); and NPW and SST in (d). (c, f) Modified four-way plots comparing the log2FC of all significant genes (sample adjusted p<0.05) in homozygous 1420HH vs heterozygous 1420RH SC-beta cells (c) and homozygous 1420HH vs heterozygous 1420RH SC-alpha cells (f). Dysregulated genes that are directionally consistent in both 1420HH and 1420RH are in the upper right and lower left quadrants. Red circles, genes identified as dysregulated in both 1420HH and 1420RH cells; green circles, genes identified as dysregulated in only 1420HH cells; blue circles, genes identified as dysregulated in only 1420RH cells. (g, h) Log2FC of glycolytic genes and G6PC2 (g) and immediate early response genes (h) in SC-beta cells from individual differentiations (black) and combined analysis (red) from the homozygous 1420HH vs normal 1420RR SC-beta cell differential gene expression analysis (open circles) and the heterozygous 1420RH vs normal 1420RR SC-beta cell differential gene expression analysis (closed circles). Avg, average
In total, we identified 40 and 81 genes in the 1420HH SC-beta and SC-alpha cells, respectively, that were dysregulated, while 59 and 27 dysregulated genes were identified in 1420RH SC-beta and SC-alpha cells, respectively. The majority of the dysregulated genes were directionally consistent (upregulated in both 1420HH and 1420RH cells or downregulated in both 1420HH and 1420RH cells) and only few discrepant dysregulated genes were observed in both SC-beta and SC-alpha cells (Fig. 8c, f and ESM Tables 9, 10). Interestingly, GCG was dysregulated in all four comparisons but was discrepant between SC-beta and SC-alpha cells; GCG was directionally consistent and downregulated in both 1420HH and 1420RH SC-alpha cells but upregulated in both 1420HH and 1420RH SC-beta cells (Fig. 8c, f).
Consistent with our previous results, genes involved in glucose metabolism were dysregulated (Fig. 8g). Key glycolytic genes, GCK, GAPDH, GPI and TPI1 were downregulated in 1420RH SC-beta cells while G6PC2, a pancreatic beta cell-specific isoform of glucose 6-phosphatase catalytic subunit, which opposes the action of GCK and negatively regulates insulin secretion, was upregulated in both 1420RH and 1420HH SC-beta cells (Fig. 8g). Although bulk RNA data from islets are not always consistent with single-cell sequencing results due their inherent heterogenous nature, we also observed directionally consistent and significant changes in gene expression of G6PC2, GCK and GAPDH in real-time PCR using RNA from independent differentiations (ESM Fig. 14). Among the other consistently dysregulated genes in SC-beta cells were the members of the S100 family, S100A13, S100A6 and S100A11, which are involved in Ca+ signalling/binding and the immediate early response genes, FOS, FOSB, JUN, JUNB, JUND, EGR1 and NR4A1 (Fig. 8a–c, h). Among the SC-alpha cell dysregulated genes, the top gene was ID1, which was upregulated in KATP channel variant alpha cells. CRH, a human alpha cell gene [34] was also one of the top upregulated genes in 1420HH SC-alpha cells (Fig. 8d) and was consistently upregulated in all four differentiations (ESM Table 8). CRH was also upregulated in the 1420RH SC-alpha cells, but the effect was smaller and was only significant in two out of four differentiations. Real-time PCR for both S100A13 and CRH from independent differentiations were directionally consistent but not statistically significant (ESM Fig. 14).
Comments (0)