Moth breeding
We bred oleander hawkmoths Daphnis nerii under controlled temperature and humidity conditions at the greenhouse facility on the National Centre for Biological Sciences campus in Bangalore, India. We reared the larvae on freshly cut leaves of Nerium oleander L., their natural diet, and allowed them to pupate in a netted container filled with sawdust. After emergence, we fed the adult moths with approximately 33% sugar solution ad libitum before conducting experiments. For the behavioral and neuroanatomical experiments, we used moths that were at least one day old and actively flying within their holding chambers. For the scanning electron microscopy, we used 2–3 day old moths as their scales were easier to remove.
Characterization of flight initiation mediated by cephalic bristles.High-speed videography
To tether the moths, we first descaled a small region on the dorsal surface of their scutum and affixed neodymium magnets of 3 mm diameter using cyanoacrylate glue (Evobond®). These magnets were then attached to magnets of opposite polarity at the tip of a rigid metal rod, thus tethering the moth to the rod. We allowed the moths to adapt to dark conditions for at least 30 min before the beginning of each experiment. To stimulate the cephalic bristle region, we delivered air pulses of 250 ms duration through a solenoid valve connected to an air cylinder with a pressure regulator (Fig. 1A). A customized circuit controlled the opening and closing of the solenoid valve. To measure the approximate airspeed required to elicit flight, we used a hotwire Mini anemometer (Kurz 490S, Kurz Instruments Inc., Monterey, CA, USA). Due to some backpressure in the solenoid valve, the speed of the air pulse changes dynamically with time. Hence, the exact airspeed of the air pulse that elicits flight could not be precisely determined, but coarse estimates of the magnitude of the air pulse ranged between 1–6.5 m s−1. Although typically our experiments involved three successive trials for each moth with 45 min of inter-trial interval, we analyzed only the first trial in the experiments described here, as we were unsure about how long the effects of the first trial persist on later trials (Supplementary Table 1).
We filmed the flight initiation responses of the moths from a lateral view at 3000 frames per second and an exposure time of 300 μs using a single high-speed camera (Phantom v7.1, Vision Research, Wayne, NJ, USA; Fig. 1B i-iv). The wingbeat frequency of Daphnis nerii is about 30 Hz, thus the frame rate captured the flight behavior with sufficiently high temporal resolution. To determine the latency of the onset of movement of various appendages following stimulus delivery, we digitized an array of points on the moth’s body using the open-source Tracker software (Tracker-Video analysis and modeling tool, GNU general public license, version 3). The data were analyzed and plotted using MATLAB 2016a (Mathworks Inc., California; Fig. 1C-D). When the moth was immobile, the time series displaying the position of an appendage contained baseline noise which is likely due to digitization error. We defined the onset of movement from the time instant when any change in position exceeded two standard deviations (i.e. 0.8 mm) above the baseline noise. From this time instant, we next determined the behavioral latency as the time duration between the onset of stimulus and the onset of each behavior.
Cephalic bristle ablation
To locate the regions in which cephalic bristles were present, we conducted a series of experiments in which we stimulated regions of the head of a tethered moth with tactile stimuli, and recorded their responsiveness to these stimuli. These regions were then mapped on the head of the moth, which provided general location for cephalic bristle stimulation and ablation (see Supplementary methods, Supplementary Fig. 1). To test if cephalic bristles were necessary for initiating flight upon air pulse stimulation, we systematically ablated all the scales and bristles in the cephalic bristle region using a toothbrush and followed the same protocol as in the flight initiation experiments using moths with intact bristles. We then filmed the response to loss of tarsal contact in the same moths, post-ablation.
Analysis and statistical tests
To avoid the effect of prior history of stimulation, we analyzed only the first trial for each moth. First, we used a one-sample Kolmogorov–Smirnov test to assess the normality of our data. Because the null hypothesis (that our data followed a Gaussian distribution) was rejected (p ≤ 0.05), we next used a non-parametric Wilcoxon rank sum test to compare the independent datasets that were not normally distributed. These tests allowed us to test the hypothesis that the two datasets were derived from the same population (e.g. Zar 1999).
Thermal imaging of moth thorax during flight initiation
To obtain an unhindered view of the dorsal thorax for thermal imaging, we tethered the moths ventrally. To achieve this, we first affixed a magnet between the meso- and meta-thoracic legs on the ventral surface of one-day old moths. We then allowed the moths to recover from this treatment for 30 min during which they were free to move around with the affixed magnet. A tether rod equipped with a magnet of opposite polarity then connected with the ventral magnet. The moths adapted to their ventral tethers for an additional period of 15 min. We maintained the room temperature at 25ºC, which was the starting temperature in all trials. To induce flight through stimulation of the cephalic bristle field, we directed a strong air current to the dorso-posterior ('crown') region of the head using a solenoid valve setup (Fig. 1A) and captured the resulting flight initiation movements at 600 fps with a high-speed camera (Vision Research, v7.1). The camera, positioned approximately orthogonal to the plane of wing movement (Fig. 2A), recorded these movements from the front, enabling us to quantify wing amplitude by measuring the projected angular excursion. To record endogenously-generated flights, we waited for the moths to initiate flight on their own accord which usually required us to wait between 5–20 min post-tethering. A warm-up phase usually preceded the flights (Fig. 2B-F). Simultaneous to the above recording, we filmed the dorsal thorax of the moth with a thermal camera at 60 fps (VarioCam HD 680, Infratech, Germany), as the moth warmed up and eventually flapped with large amplitudes.
To verify the internal calibration of the thermal camera, we measured the temperature of heated water using a clinical thermometer (Hicks Oval thermometer, Hicks Thermometers, Aligarh, India) while simultaneously filming it with the thermal camera. For high-speed filming, we used cool IR LED lights that did not register a rise in temperature when observed with the thermal camera, and also did not heat the tethered moth. The videos were digitized using the DLTdv8 digitization tool (Hedrick 2008).
Scanning electron microscopy (SEM) of cephalic bristles
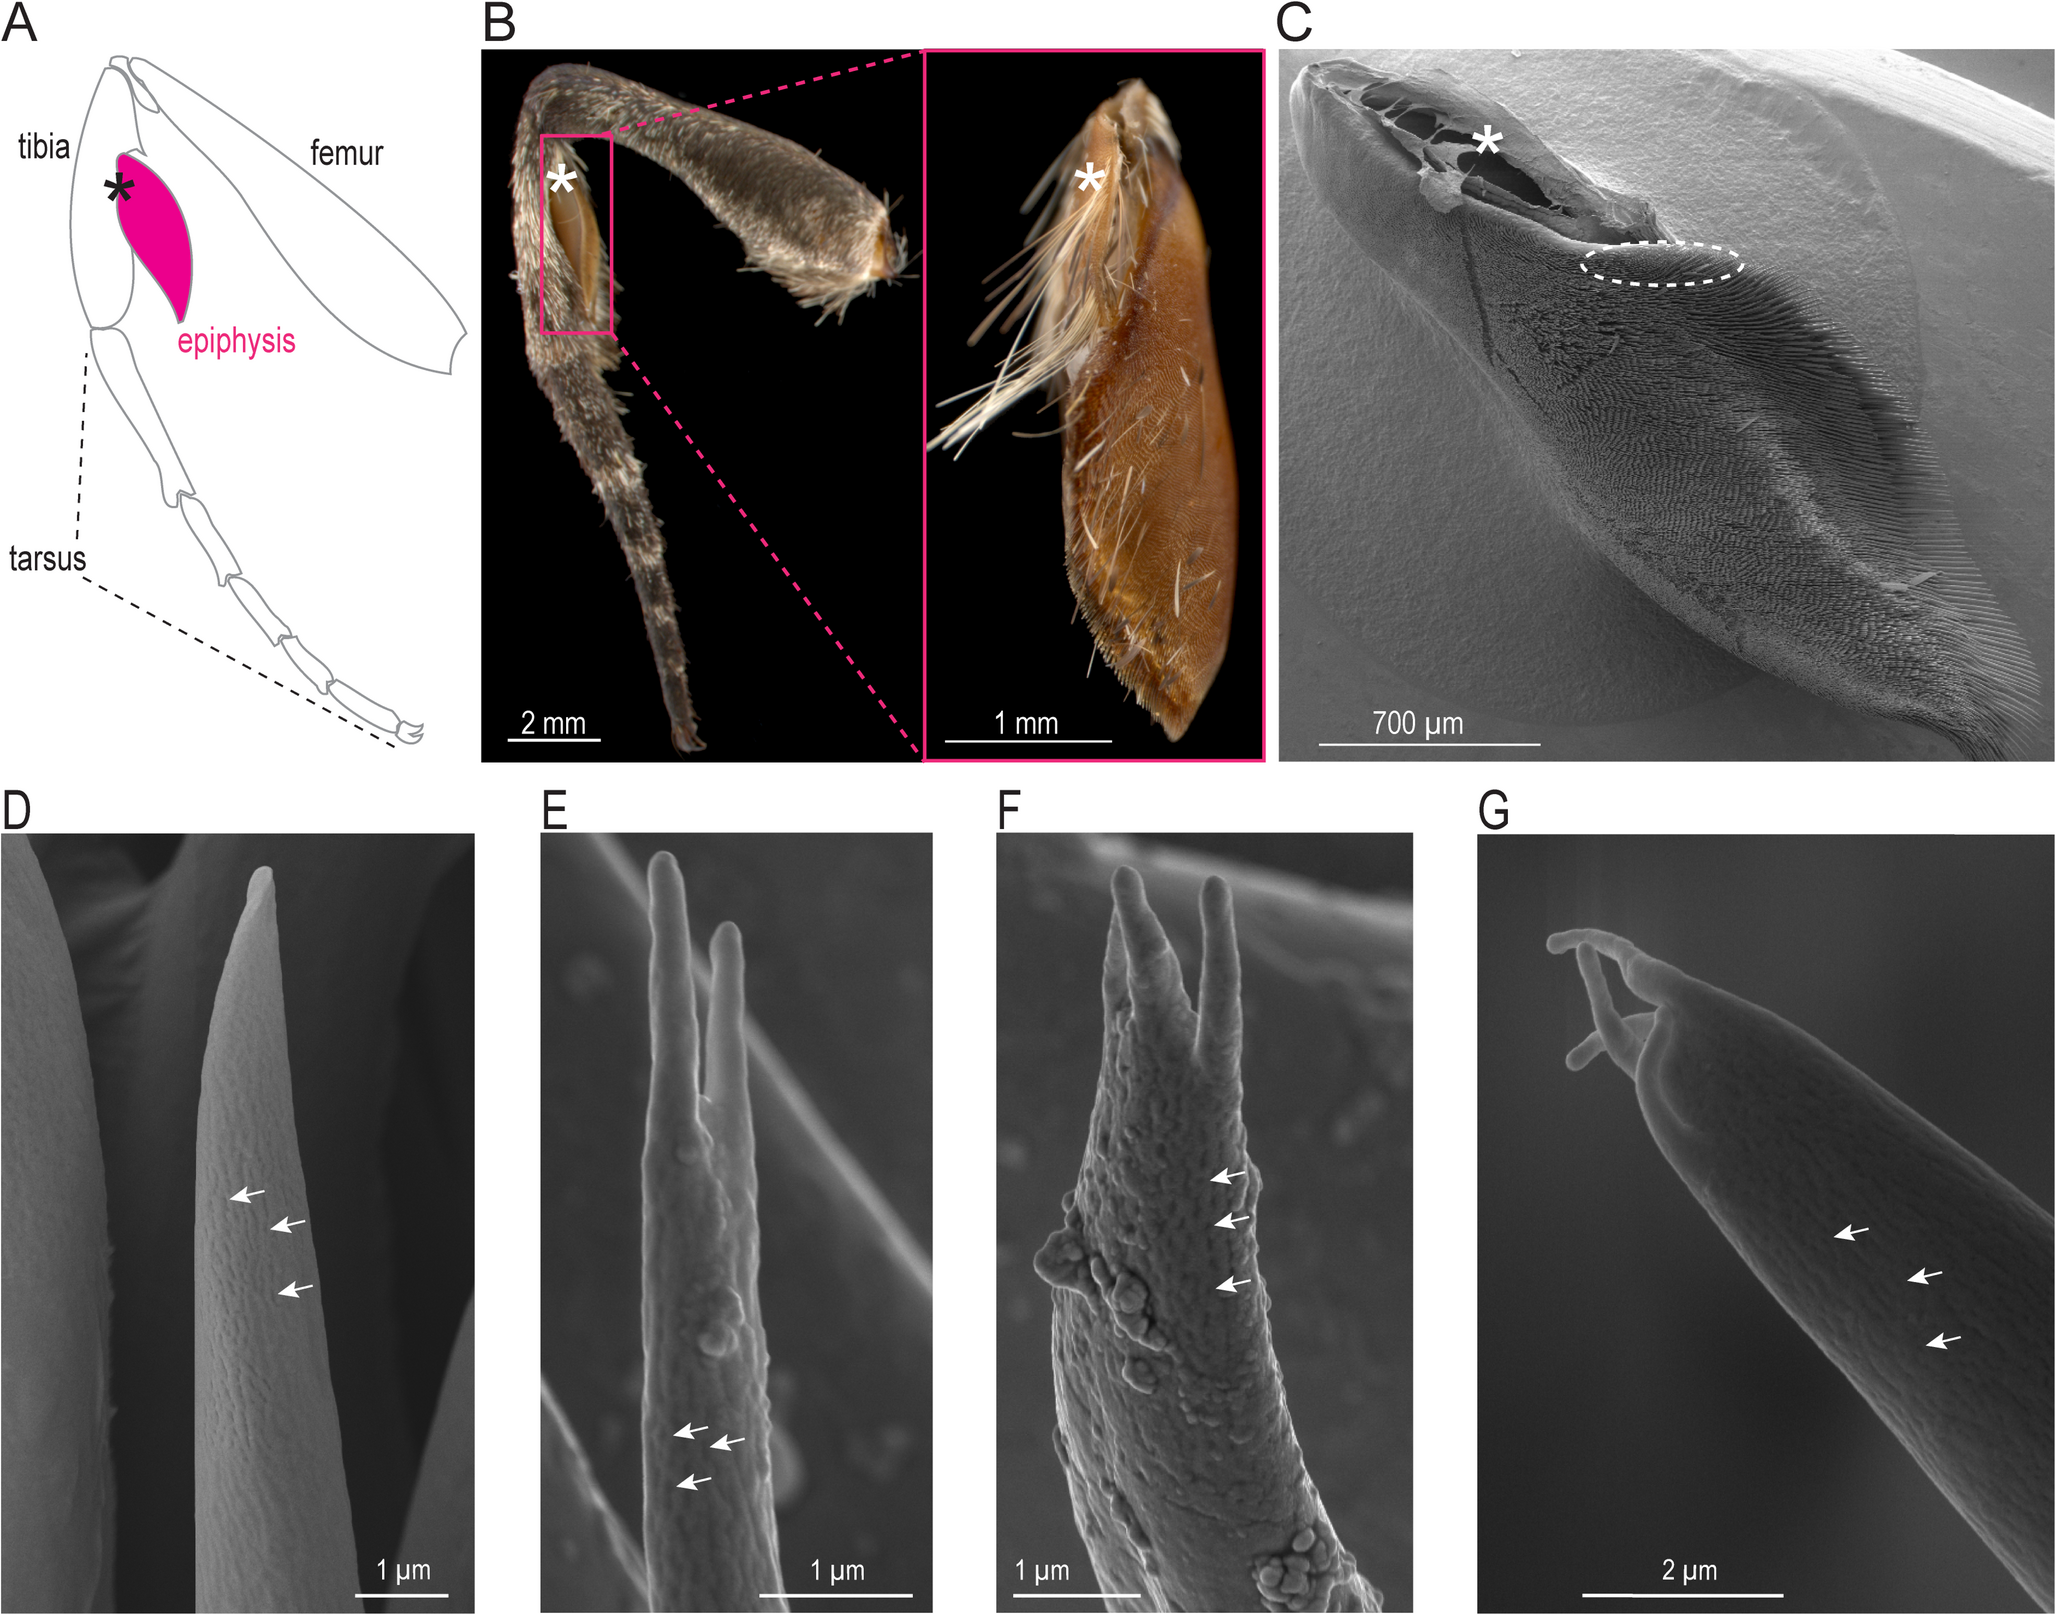
In Lepidoptera, the cephalic bristle fields (see Supplementary methods) underlie a heavily scaly cover. For scanning microscopy imaging of the bristles, we first removed only the scales while keeping the bristles intact. In slightly older (3–4 days old) moths, scales can be removed more easily than in younger moths simply by directing a sufficiently strong jet of air at their head. This method ensured the removal of the shallow-rooted scales, while retaining the mechanosensory bristles which are rooted more deeply (Fig. 3A-C). The heads were then fixed in 4% paraformaldehyde for 8 h, and gradually dehydrated by passing them through an ethanol series of 10–100% in 10% increments. The samples were dried using a critical point drying method (Leica EM CPD 300 Critical Point Dryer, Leica Microsystems, Wetzlar, Germany) to prevent distortions of the surface structures. Following this, we gold-coated the samples in a sputter coater (10 nm, Emitech K550X, Quorum Technologies Ltd, West Sussex, UK) and imaged them in Field Emission Scanning Electron Microscope (Zeiss Merlin Compact VP/Zeiss Gemini SEM, Germany).
Fluorescent labeling of cephalic mechanosensory afferents
To label the cephalic mechanosensors, we first anesthetized 1-day old hawkmoths by placing them in -23ºC for 5–8 min. The moths were then enclosed in a plastic syringe tube and immobilized using dental wax, dorsal side up. The scales and bristles in the cephalic region were completely removed. We dabbed the cephalic bristle field region with the fluorescent dye Alexa Fluor 488 (10,000 MW, Anionic, emission at 519 nm and excitation at 495 nm, D22910, Thermo Fisher Scientific) (Sant and Sane 2018). These dyes are cytoplasmic markers, and hence require active transport of the cytoplasm to spread throughout the neuron. Thus, the insect must be kept alive after dye fill to allow its penetration through the whole cell. However, due to neuronal injury, the distal processes begin to degenerate within the time needed to fully label the neurons, resulting in a blebbed appearance in their projections. This creates a trade-off between preserving the sample long enough to mark the entire neuron while avoiding excessive degeneration at the distal ends. The optimal duration for the fill, as determined through trial and error, was about 76–78 h in a hydrated chamber. We fed the moths at regular intervals with sugar water for the duration they were to be kept alive. The specimens were fixed by submerging them in 4% paraformaldehyde for 12–14 h. Following dissection, the brain was serially dehydrated through a graded ethanol series (50%, 60%, 75%, 90%, and twice in 100%), cleared with methyl salicylate, and mounted for imaging. The sample was then imaged using an Olympus FV1000 confocal microscope (Central Imaging and Flow Cytometry Facility, NCBS, Bangalore, India) at 10-60X magnification (Fig. 3 D-F).
Electromyogram recordings from flight muscles
Preparation: To determine the activity in the various flight muscles following cephalic bristle stimulation, we obtained electromyogram recordings from the steering and indirect flight muscles. The procedure for this is outlined below. Newly emerged (i.e. 8–10 h post-eclosion) moths were anesthetized by placing them at -23ºC for 5–8 min. Each moth was then immobilized with its ventral side-up in a customized plastic syringe tube, using dental wax. The thorax of the moth was descaled, and the legs were clipped to allow easy insertion of electrodes. The cut-ends of the legs were sealed with dental wax to avoid desiccation. Twisted pairs of silver wires with bare gold wire tip (12.5 μm thick) were used as electrodes. The recording electrode was inserted into any one of 4 types of flight muscles (basalar, subalar, upper axillary steering muscles, or the dorso-longitudinal indirect flight muscles) through a tiny hole made in the cuticle. After the animal was turned dorsal side up for recording, the reference electrode was placed on the surface of the thorax in saline surrounded by a wall of petroleum jelly outside the recording region. This preparation allowed us to record from the direct and the indirect flight muscles.
Stimulus: We stimulated the cephalic bristle in the crown region using a tactile stimulus delivered by a 3D printed circular disk of 1.67 mm diameter attached to the arm of a moving coil motor (Mechanical stimulator 300C-I, Aurora scientific Ontario, Canada; Fig. 4Ai). Upon delivering a step voltage stimulus to the indenter arm, the circular disk attachment touched the scales and bristles in the crown region thus physically stimulating the mechanosensors (Fig. 4A i-vi). After assessing the success of stimulation based on the feedback signal from the motor (Fig. 4B i) and the response from the corresponding muscle (Fig. 4A iii-vi), we fine-tuned the position of the indenter arm for all the subsequent trials. We delivered two kinds of stimulus protocols: a single step stimulus with a duration of 0.5 s and three steps of the same duration with an interval of 4.5 s between each step. For each moth, we recorded three trials of single-step and three trials of three-step stimuli for each muscle. We recorded the pre-stimulation baseline activity for 2 s before every stimulus. The precise instant of the stimulus could be registered using the force feedback signal from the motor when a contact with the bristles was made. We rested the moth for 25 min between trials to allow it to return to a quiescent state.
Analysis: We recorded from 8 individuals with 6 trials on each of the 4 muscle groups (i.e. total of 32 moths, 192 trials; case example in Fig. 4A i-vi). In each moth, we recorded from only one muscle. Of these, 110 trials were analysed (Axillary- 5 individuals, 28 trials, Basalar- 7 individuals, 25 trials, DLM (Dorso-longitudinal muscles)—7 individuals, 29 trials and Subalar-6 individuals, 28 trials). We excluded data if the recording showed unexpected fluctuations in the stimulus feedback signal during the resting phase or if the muscle displayed elevated spontaneous baseline activity that persisted post-stimulation, making it difficult to distinguish the stimulus effect. In such cases, there was strong likelihood that the head was in continuous contact with the indenter arm, which meant that continuous stimulation of the cephalic bristle elicited minor head movements despite immobilization of the neck joints.
Filtering and spike sorting: The raw data (Fig. 4B i,ii) were bandpass-filtered using a 3rd order Butterworth filter with cut-offs at 10 Hz and 500 Hz (Fig. 4B iii). In many cases, the response following the first step stimulus in a three-step protocol trial heavily overlapped with the occurrence of the next stimulus. To avoid ambiguity, we used a total length of 2.5 s of recording for all analyses which included the pre-stimulation period of 2 s and 0.5 s of stimulus duration. Using a custom-written program in MATLAB which incorporated a template matching algorithm, we detected the location of spikes in the record (https://github.com/chinmayeelm/EMG_spike_detection). We applied thresholds on the amplitude (> 5 mV) and width of the spike (2 ms-11 ms) on the identified spikes to eliminate potential non-spikes (For details of the methodology, please refer to Supplementary Methods). The number of templates used in this scheme depended on the variations in spike features. We eliminated any redundant overlapping matches resulting from spikes being identified by multiple templates. To measure latency, we used the first spike occurring after the onset of stimulus with amplitude larger than baseline spikes (Fig. 4B iv).


Comments (0)