
Remember me
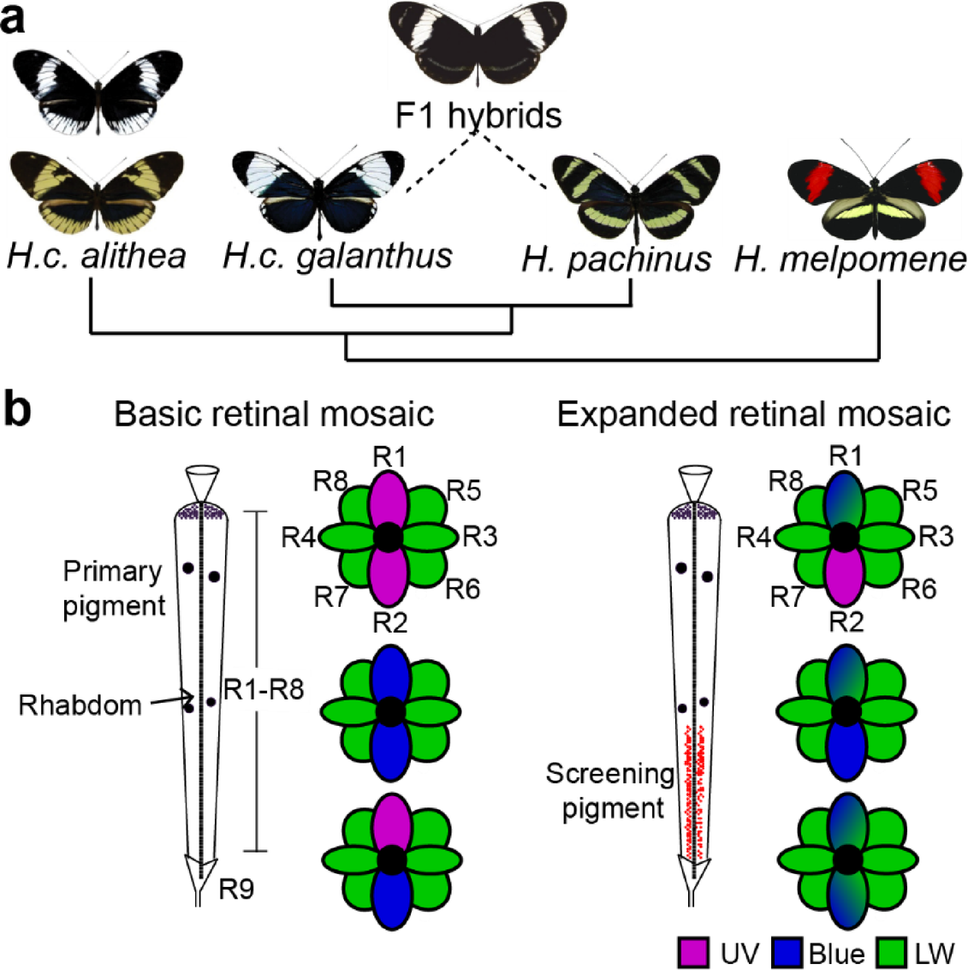

The butterflies used in this study were housed in a greenhouse at the University of Chicago that was regularly supplemented with new butterflies from breeders located in Ecuador (H. c. alithea) and Costa Rica (H. c. galanthus and H. melpomene). H. pachinus and F1 hybrid offspring of H. c. galanthus and H. pachinus crosses were reared in Panama and transported to the University of Chicago for experiments. All butterflies were at least 3 days old at the time of experiments.
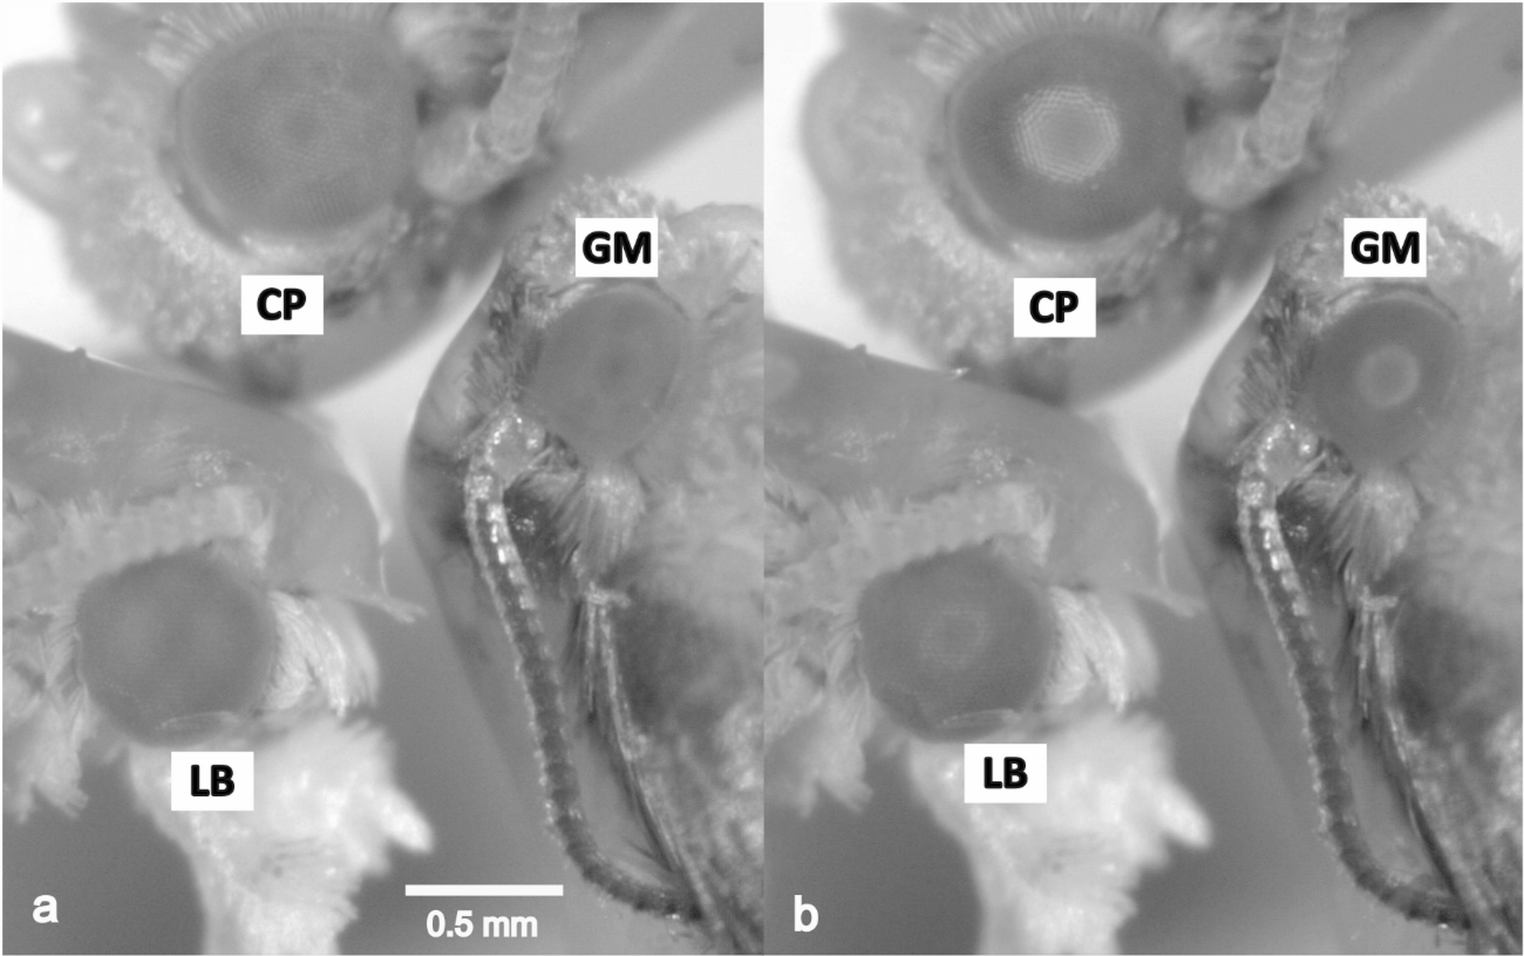
EyeshineEyeshine images were collected using a custom built epi-fluorescent microscope following a published design (Stavenga 2002). Collimated white light (DH-2000 S, Ocean Optics) was first expanded through a telescope (f = 40 and 80 mm, Edmund optics) and focused through a half-silvered mirror onto the butterfly eye through a 20X, 0.4 NA objective (Zeiss LD-Plan-Neofluar). The resulting eyeshine image was magnified using 80 and 20 mm lenses placed confocally with each other and photographed with a digital camera equipped with an infinity focused lens (Canon EOS Rebel T5). To capture an image, butterflies were restrained in a custom made collar using beeswax and placed on a rotating platform near the focal point of the imaging lens and the position was adjusted using three linear actuators. The butterfly was dark adapted for at least one minute before each image. After an image, the butterfly was rotated to a new, non-overlapping position along the dorsal-ventral axis of the eye.
We quantified the eyeshine distribution by counting the number of red and yellow ommatidia across the entire dorsal-ventral axis of the eye. For each butterfly we took 10–12 images that amounted to 3,686.9 ± 758.2 ommatidia and ~ 30% of the entire eye (Seymoure et al. 2015). Ommatidia were counted in each image blind to species, sex, eye location, and individual. A randomly selected 20% of the images were included twice to ensure repeatability, finding 1–2% differences in the proportion and total number of ommatidia counted. We report proportions based on the two most dorsal images and the ventral half. Results were qualitatively and quantitatively similar when different numbers of images were combined.
Eyeshine spectral reflectanceWe measured the spectral reflectance of individual red and yellow ommatidia using monochromatic light. We began with a reference photo with white light to classify each ommatidia as red or yellow. We then rerouted the white light through a monochromator (MonoScan-2000, Ocean Optics) and replaced the digital color camera with a monochromatic camera (Prosilica GX1050, Allied Vision Technologies). To ensure consistent illumination across stimuli, we measured the photon flux at each wavelength and normalized it relative to the mean flux across the spectral range. We empirically determined that a photon flux of 1.0 × 10¹⁵ photons produced monochromatic eyeshine images that filled the dynamic range of the camera. We then adjusted the shutter time for each wavelength to achieve this photon flux (6.6 ± 1.1 s). We validated this method by capturing images using a mirror in place of a butterfly eye. Pixel intensities were similar across all wavelengths, indicating that photon flux was similar and wavelength specific changes in camera sensitivity were negligible. Since white light stimuli quickly induce pigment migration and adaption of the eyeshine, we also performed control experiments by recording reflectance spectra before and after an extended exposure (15 minute) to low intensity monochromatic light, which showed measurements were stable and not affected by the longer shutter times used for this experiment.
For each butterfly, we measured reflectance spectra in the dorsal, middle, and ventral part of the eye. These were measured from 500 to 800 nm in 10 nm steps, with preliminary experiments showing no reflectance outside this range. Individual ommatidia were analyzed with ImageJ (Schindelin et al. 2012). We imported the series of monochromatic images as a z-stack, which allowed us to manually select the same ROI for each ommatidium and wavelength. The reflectance at each wavelength for each ommatidium was then defined as the average pixel intensity in the ROI. The images collected were 8-bit for intensity values and we excluded ommatidia from further analysis if the maximum intensity was less than 50% or greater than 95% of the cameras dynamic range.
ImmunohistochemistryWe stained thin cross-sections of the eye with antibodies against UV1, UV2, and blue opsins. The anti-blue opsin antibody was generated against the peptide INHPRYRAELQKRLPC in rabbits and was provided by Michael Perry (Perry et al. 2016). We created our own antibodies specific to UV1 and UV2 proteins. For UV1, the antibody was generated in guinea pigs against the peptide GLDSADLAVVPEC. For UV2, the antibody was generated in mouse against the peptide GLSSAELEFIPEC. Peptide synthesis, conjugation, immunizations, and affinity purification were performed by GenScript (USA).
Eyes were dissected in 0.01 M phosphate buffered saline (PBS) and then fixed at room temperature for 15 min in 4% paraformaldehyde in PBS. Eyes were washed 3 × 10 min in PBS and then cryoprotected overnight at 4 °C in 25% sucrose in PBS before sectioning at 14 μm on a cryostat. With the exception of some eyes that examined the most dorsal part of the eye, we targeted the ventral part of the middle eye for all experiments. After drying overnight, slides were first washed in chilled acetone for 5 min, 2 × 10 min in PBS, 2 × 10 min in 0.3% TritonX-100 in PBS (PBST), 1 × 5 min in 1% sodium dodecyl sulfate in PBST, and 3 × 10 min in PBST. Slides were then blocked for one hour in 1% bovine serum albumin in PBST. Primary antibody was applied overnight at 4 °C as 1:300 dilutions in blocking solution. The following day, slides were washed 5 × 10 min in PBST before applying the secondary antibody. Secondary antibodies (Abcam) were diluted 1:2000 in blocking solution and applied to the slides for 2 h at room temperature. These antibodies were goat anti-rabbit Alexafluor 488, donkey anti-guinea pig Alexafluor 555, and donkey anti-mouse Alexafluor 647. After staining, slides were finally washed 5 × 10 min in PBST and stored in Polymount (Fisher Scientific). Eye slices were imaged using a Zeiss LSM 510 confocal microscope using a 20X objective.
We quantified the distribution of ommatidial classes by counting the number of UV-UV, B-B, and UV-B ommatidia in each butterfly using an automated program. We first generated a binary mask for each antibody as well as one for the merged image. Ommatidia were automatically segmented and identified using the MATLAB function bwareafilt on the binary mask of the merged image. We overlayed these segmented ommatidia boundaries on the single channel masks and defined an ommatidium as opsin positive if at least 4% of the ommatidium was filled. This threshold best matched previously reported results for H. melpomene (McCulloch et al. 2017) and ensured that presumably LW expressing cells with low levels of co-expression were detected. We validated this program in two ways. First, we manually counted ommatidia for 8 butterflies, blind to the results of the automated program, and found an average difference of 4.1 ± 1.3% in the proportion of blue photoreceptors detected. For each eye, we also ran the program on 2–4 consecutive sections, each of which contained the same ommatidia. Proportions were averaged together across sections, and if the proportion of blue photoreceptors differed by more than 5% the individual was excluded from further analysis. The resulting distributions were analyzed using hierarchical clustering based on the Euclidean distance between the three ommatidial classes measured and using an average linkage function.
qPCRWe measured the relative difference in UV1 and UV2 mRNA expression using qPCR. Eyes were dissected from the butterfly and immediately placed in RNA-later and stored at −80°C. Before RNA extraction, eyes were washed 5 × 5 minutes in PBS. RNA was extracted and converted to cDNA using a Qiagen RT-PCR kit. UV1 primers were 5’-CGCTCACTGTGTGCTTCCTCTT-3’ and 5’-AGTCTTGCAAGCTACCGCGG-3’. UV2 primers were 5’-TACCGTGTGCTTCCTTTATGTTG-3’ and 5’-ACCCTTGCAAGCGATCGCAG-3’. We also tested for the LW opsin and elongation factor 1 alpha as controls for the quality of RNA extraction. Expression levels were measured in triplicate for each sample using iTaq SYBR Green Supermix (Bio-Rad, USA) and a CFX96 qPCR machine (Bio-Rad, USA), and results with standard deviations greater than 1 across the replicates were discarded and re-tested.
Comparing eyeshine and antibody stainingWe used a simple least squares approach to relate the proportion of red and yellow eyeshine to the proportion of UV-UV, B-B, and UV-B ommatidia we observed with antibody staining. This approach enabled us to estimate the proportion of blue expressing photoreceptors that co-express the LW opsin since all B photoreceptors in ommatidia with red eyeshine should co-express. For each group, we fit the following equation to our data:
$$ Yellow~eyeshine = UVUV + \left( \right)^ \cdot BB + \left( \right) \cdot UVB $$
where p is the probability that a blue cell co-expresses LW and is associated with the expanded mosaic and red screening pigment. (1-p)2 gives the probability that neither blue cell expresses LW, and (1-p) gives the probability that the only B cell does not co-express. Since the same butterflies were not always used for both eyeshine and antibody staining, we fit this equation using group averages.
Fig. 2
Example eyeshine images. The eyeshine was imaged across the entire dorsal-ventral axis of each butterfly eye. Shown here are a subset of the images for a single H. pachinus male. A red eyeshine is indicative that the ommatidium expresses a red screening pigment. The increased number visible in the ventral eye is due to a lower curvature of the eye that increases spatial resolution of the eye
Comments (0)