
Remember me

The age and sex distributions among the study groups were similar. The median age of the children in the tp-MBG group was 6.85 years [IQR: 4.25–10.925], and that in the ntp-MBG group was 7.60 years (IQR: 4.2–10.9). The ntp-MBG group included children with syndromes, acquired disorders, developmental disorders, and cerebral palsy as the underlying disease that resulted in feeding and swallowing issues. The demographic characteristics of all participants are presented in Table 1.
Table 1 Demographics of the sampleGroup Comparisons for the MBQ QuestionnaireThe group comparisons revealed a significant difference between the MBQ total mean scores of the ntp-MBG group (M = 64.69, SD = 19.10) and the tp-MBG group [(M = 41.52, SD = 9.39) t (198) = 10.810, p < 0.001]. Likewise, a significant difference was identified in the scores for the total score of the MBQ (food refusal avoidance behavior) between the ntp-MBG group (M = 28.32, SD = 10.11) and the tp-MBG group [(M = 17.79, SD = 6.15) t (198) = 8.894, p < 0.001]. Similarly, a significant difference was noted in the scores for the MBQ “food manipulation” total score between the ntp-MBG group (M = 12.37, SD = 4.11) and the tp-MBG group [(M = 7.81, SD = 1.58) t (198) = 10.342, p < 0.001)]. Similarly, there was a significant difference in the total score for the MBQ (mealtime aggression and distress) between the ntp-MBG group (M = 15.87, SD = 5.46) and the tp-MBG group (M = 10.54, SD = 2.15) (t (198) = 9.068, p < 0.001). Finally, a significant difference was shown in the scores for the ntp-MBG group (M = 5.41, SD = 2.73) and the tp-MBG group [(M = 3.19, SD = 0.52) t (198) = 7.983, p < 0.001] for the MBQ “choking, gagging and vomiting” total score (reported in Table 2).
Table 2 Comparison of means between study subgroups according to the diagnosis of feeding problems for the MBQ total score and its domainsGroup Effect for the MBQ QuestionnaireOne-way ANOVA was used to compare the scores of the MBQ questionnaire between the study subgroups that were split in accordance with the diagnosis of feeding problems. The analysis revealed a significant main group effect on the MBQ total mean score F (3, 196) = 43.586, p < 0.001; on the MBQ “food refusal avoidance behavior” total score F (3, 196) = 31.196, p < 0.001; on the MBQ “food manipulation” total score F (3, 196) = 36.744, p < 0.001; on the MBQ “mealtime aggression and distress” total score F (3, 196) = 30.158 p < 0.001; and on the MBQ “choking, gagging and vomiting” total score F (3, 196) = 39.850, p < 0.001. All the findings are outlined in Table 3.
Table 3 Group effect of means between study subgroups according to the diagnosis of feeding problems for the MBQ total score and its domainsOne-way ANOVA was also was conducted to evaluate the effects of group differences among the medical diagnosis subgroups. The analysis revealed a significant main group effect on the MBQ total mean score F (4, 195) = 30.329, p < 0.001; on the MBQ “food refusal avoidance behavior” total score F (4, 195) = 22.835, p < 0.001; on the MBQ “food manipulation” total score F (4, 195) = 27.306, p < 0.001; on the MBQ “mealtime aggression and distress” total score F (4, 195) = 21.680 p < 0.001; and on the MBQ “choking, gagging and vomiting” total score F (4, 195) = 28.413, p < 0.001. All the results are summarized in Table 4.
Table 4 Group effect of means between the study subgroups according to medical diagnosis subgroups for the MBQ total score and its four domainsGroup Comparisons for the MBQ Questionnaire Between Typical and Neurodevelopmental DisordersThe group comparisons revealed a significant difference between the MBQ total mean scores of the neurodevelopmental disorders group NVD-MBG group (M = 66.76, SD = 21.06) and the tp-MBG group [(M = 41.52, SD = 9.39) t (157) = 10.283, p < 0.001]. Likewise, a significant difference was identified in the scores for the total score of the MBQ (food refusal avoidance behavior) between the NVD-MBG group (M = 28.76, SD = 10.62) and the tp-MBG group [(M = 17.79, SD = 6.15) t (157) = 8.018, p < 0.001]. Similarly, a significant difference was noted in the scores for the MBQ “food manipulation” total score between the NVD-MBG group (M = 12.68, SD = 4.45) and the tp-MBG group [(M = 7.81, SD = 1.58) t (157) = 9.970, p < 0.001)]. Similarly, there was a significant difference in the total score for the MBQ (mealtime aggression and distress) between the NVD-MBG group (M = 16.47, SD = 5.92) and the tp-MBG group (M = 10.54, SD = 2.15) (t (157) = 9.030, p < 0.001). Finally, a significant difference was shown in the scores for the NVD-MBG group (M = 5.88, SD = 2.97) and the tp-MBG group [(M = 3.19, SD = 0.52) t (157) = 8.790, p < 0.001] for the MBQ “choking, gagging and vomiting” total score (Table 5).
Table 5 Comparison of means between study subgroups according to the diagnosis of feeding problems for the MBQ total score and its domainsReliability and Validity of the MBQ QuestionnaireCronbach’s alpha coefficient for the internal consistency of the MBQ’s total score was 0.944, with alpha coefficients ranging from 0.939 to 0.944. Test–retest reliability was assessed between the first and second administrations of the MBQ questionnaire. Specifically, a high degree of reliability was measured, with the ICC equal to 0.933 [95% CI: 0.918–0.946]. We subsequently ran Pearson’s correlation between the MBQ total score and the AYCE questionnaire’s total score to determine the former’s sensitivity against an external validity criterion. Specifically, the analysis revealed a strong positive correlation between them (r = 0.820, p < 0.001).
Reliability and Validity of the MBQ Questionnaire for the Neurodevelopmental Disorders GroupCronbach’s alpha coefficient for the internal consistency of the MBQ total score was 0.952, with alpha coefficients ranging from 0.949 to 0.953. The test–retest stability was estimated between the first and second administration of the MBQ questionnaire. Specifically, a high degree of reliability was measured, with the ICC equal to 0.971 [95% CI: 0.965–0.977]. We subsequently ran Pearson’s correlation between the MBQ total score and the AYCE questionnaire’s total score to determine the former’s sensitivity against an external validity criterion. Specifically, the analysis revealed a strong positive correlation between them (r = 0.907, p < 0.001).
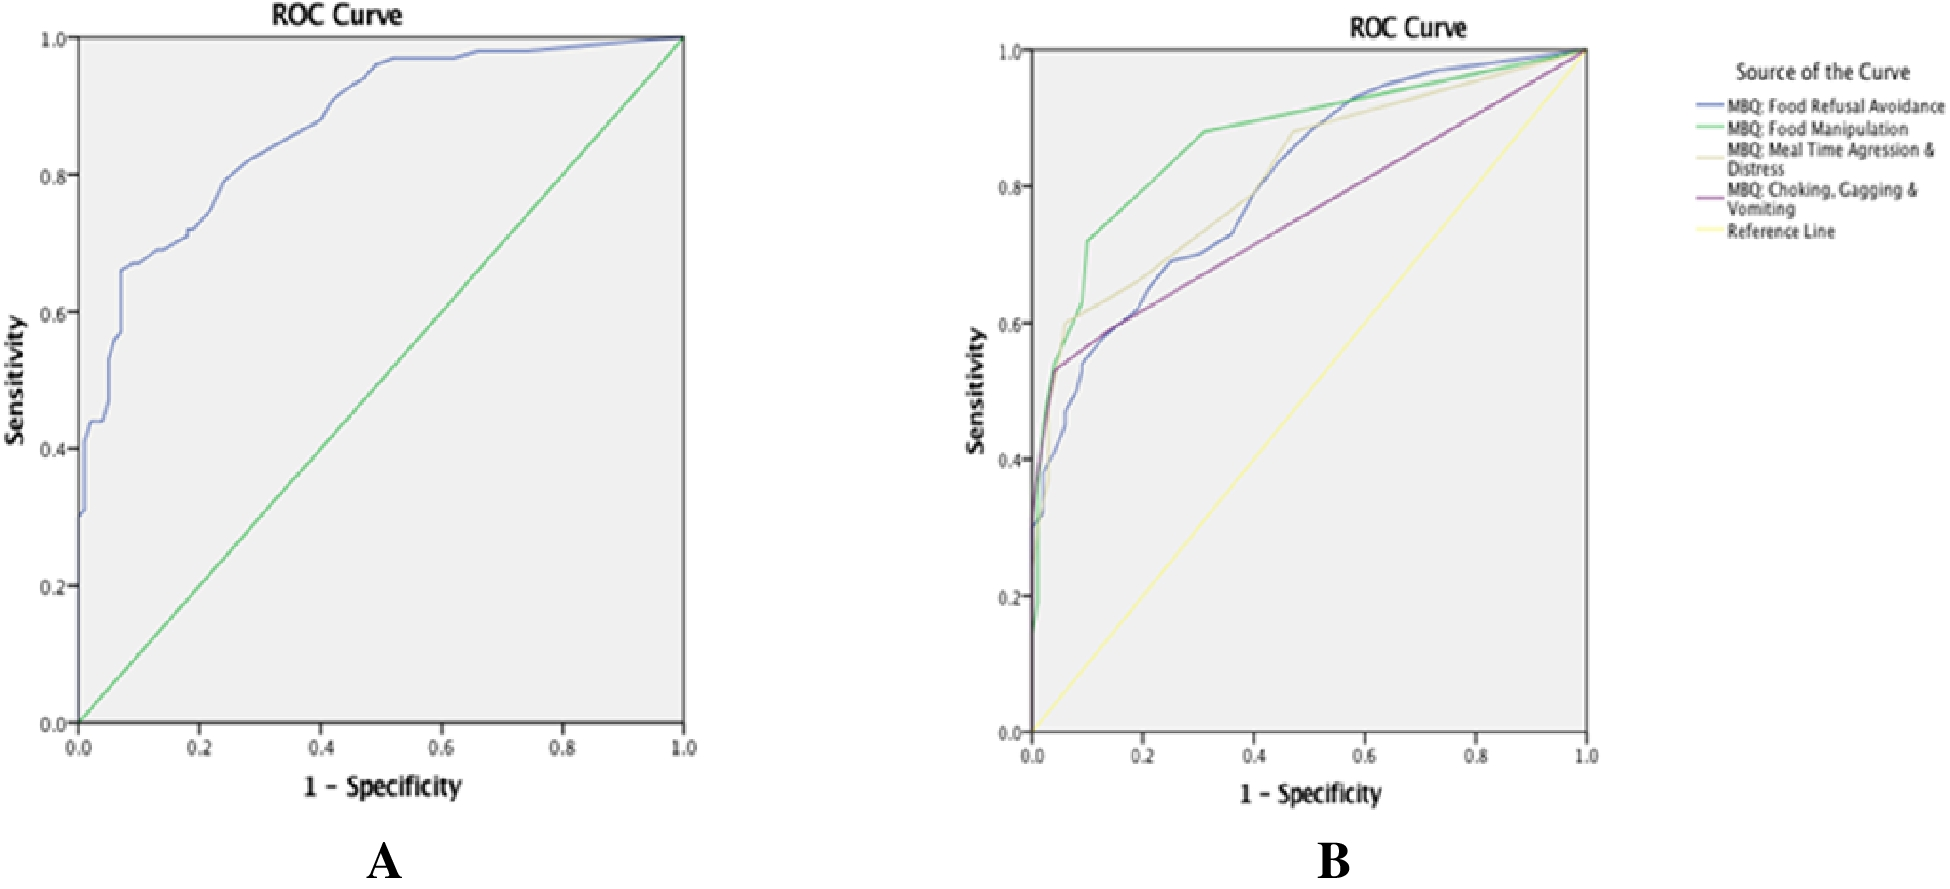
ROC Analysis for the MBQThe cutoff thresholds for the MBQ total and the concept validity were determined using ROC analysis. A statistically significant positive discrimination between the tp-MBG and ntp-MBG groups was revealed [AUC 0.870 (95% CI: 0.822–0.918), p < 0.001]. The cutoff point was 57.00, with a sensitivity of 0.660 and a specificity of 0.07 (Fig. 1A). The chosen MBQ cutoff of 57.00 represents the point on the ROC curve where the balance between sensitivity (0.66) and specificity (0.93) was judged optimal (AUC = 0.87). In practice, this means that a parent score of 57 or higher classifies their child as having “nontypical” mealtime behaviors. Clinically, the high specificity (93%) minimizes false positives—few children with typical behavior are wrongly flagged—so one can be confident that a score ≥ 57 very likely reflects genuine feeding difficulties. However, the more modest sensitivity (66%) means that about one-third of children with real issues will score below 57 and could be missed by this screen.
Fig. 1
Receiver operating characteristic (ROC) curve for the MBQ between the tp-MBG and ntp-MBG groups for (A) the total score and (B) the four domains
In practice, both PPV (positive predictive value) and NPV (negative predictive value) will vary with the true prevalence of feeding problems in different clinical settings. Hence, it is useful to recalculate them when one applies the MBQ in populations with higher or lower base rates. By reporting additional indices—such as PPV, NPV, and likelihood ratios—alongside sensitivity and specificity, clinicians can better translate an MBQ score into individual risk estimates and make informed decisions about who needs further assessment, intervention, or reassurance.
Additionally, a ROC analysis revealed a statistically significant positive difference between the tp-MBG and ntp-MBG groups for (a) “food refusal avoidance behavior” [AUC 0.808 (95% CI: 0.750–0.867), p < 0.001], with a cutoff point of 24.00 (sensitivity: 0.580 and specificity 0.09); (b) “food manipulation” [AUC 0.868 (95% CI: 0.817–0.919), p < 0.001], with a cutoff point of 10.00 (sensitivity: 0.720 and specificity 0.001); (c) “mealtime aggression and distress” [AUC 0.816 (95% CI: 0.757–0.875), p < 0.001], with a cutoff point of 14.00 (sensitivity: 0.600 and specificity 0.006); and (d) “choking, gagging and vomiting” [AUC 0.757 (95% CI: 0.688–0.825), p < 0.001], with a cutoff point of 4.00 (sensitivity: 0.590 and specificity 0.004 seen in Fig. 1B).
ROC Analysis for the MBQ Questionnaire for the Neurodevelopmental Disorders GroupThe cutoff thresholds for the MBQ total and the concept validity were determined using ROC analysis. A statistically significant positive discrimination between the tp-MBG and neurodevelopmental disorders groups was revealed [AUC 0.876, (95% CI: 0.820–0.931), p < 0.001]. The cutoff point was 57.00, with a sensitivity of 0.644 and a 1-specificity of 0.07 (see Supplementary 2, Figs. 3A & 3B).
Factor Analysis for the MBQ QuestionnaireA principal component factor analysis (PCA) was conducted on the 33-item questionnaire to explore the underlying factor structure. Principal axis factoring was used as the extraction method, with a varimax rotation. The Kaiser–Meyer–Olkin measure verified the sampling adequacy for the analysis, KMO = 0.887, which is above the acceptable limit of 0.3. Bartlett’s test of sphericity (p < 0.001) indicated that correlations between items were sufficiently large for CFA and that factor analysis may be useful to our data. The scree plot presented in Fig. 2 facilitated to determine the number of the identified components.
We subsequently looked at the scree plot to ascertain how many components were utilized in a PCA. After assessing the scree-plot data (Supplementary material 2, Fig. 2), we selected four principal components that accounted for most of the data variability. In addition to h2, which represented the percentage of each variable’s variance can be accounted for by the principal components (e.g., the underlying latent continua). Table 4 displays the factor loadings for each of the 33 items on the four factors. The following variables can be expressed by looking at the components that made up each of the four factors: factor 1 stands for inappropriate mealtime behaviors, factor 2 for aggressive mealtime behaviors, factor 3 for feeding and swallowing behaviors, and factor 4 for mealtime distress.
The initial eigenvalues showed that the four factors explained 50% of the variance. After rotation, the four factors explained 36.067%, 7.367%, 4.852%, and 4.646% of the variance, respectively. Factor loadings after rotation are presented in Table 6 (Supplementary material 2). The items that clustered on the same factors suggested that factor 1 represents Inappropriate Mealtime Behaviors, factor 2 represents Mealtime Aggressive Behaviors, factor 3 represents Feeding and Swallowing Behaviors, and factor 4 represents Mealtime Distress.
Confirmatory Factor Analysis for the MBQ QuestionnaireA CFA was conducted on the 31-item questionnaire; however, items 15 and 29 were excluded from the model, consistent with the approach reported by Berlin et al. (2010), to evaluate how well the data fit the underlying factor structure proposed in their study. The model converged normally after 56 iterations, with no numerical issues observed in the estimation process. Furthermore, the fit indices indicated a good model fit: CFI = 0.974, TLI = 0.971, and RMSEA p-value = 0.100.
All factors demonstrated good internal consistency, with an overall Cronbach’s alpha of 0.968 (95% CI [0.959, 0.976]). Specifically, F1 had an alpha of 0.910, F2 had an alpha of 0.785, F3 had an alpha of 0.820, and F4 had an alpha of 0.787. Pairwise Pearson correlation coefficients were calculated between the four factors, revealing statistically significant positive correlations between F1 and F2 (r = 0.930, p < 0.001), F1 and F3 (r = 0.960, p < 0.001), F1 and F4 (r = 0.780, p < 0.001), F2 and F3 (r = 0.989, p < 0.001), F2 and F4 (r = 0.907, < 0.005), and F3 and F4 (r = 0.857, p < 0.001).
Comments (0)