
Remember me

The study complies with all relevant ethical and regulatory standards, including the EU General Data Protection Regulation (GDPR) and the Medical Device Regulation (MDR, EU 2017/745). The model development was based on registry data, did not require ethical approval or informed consent, and was registered in Region Zealand’s research inventory (REG-102–2020). The collection of EHR data for model validation, as well as data collection for the prospective clinical cohort, and the prospective implementation of the algorithm was approved as a clinical quality improvement initiative by Zealand University Hospital’s institutional leadership (Approval ID: 10736955 and 11329111). Informed consent was formally waived, as permitted under Danish law for quality improvement projects. The AI decision support tool was developed and implemented in accordance with MDR Article 5(5), which governs inhouse medical device use in healthcare institutions, and fulfilled requirements for clinical performance, risk management and institutional oversight.
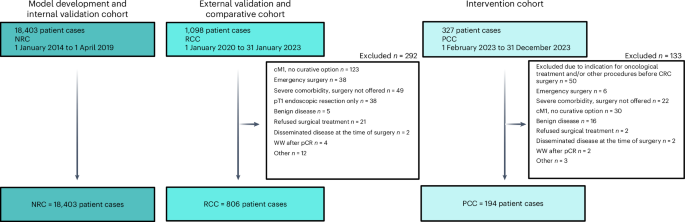
CohortsThis was a nonrandomized comparative cohort study consisting of three cohorts: an NRC, an RCC and a PCC.
The NRC consisted of data from the Danish Colorectal Cancer Group (DCCG), enriched with data from The Danish National Patient Register (DNPR), The Danish Prescription Registry (DPR) and the Register of Laboratory Results for Research (RLRR). These data were used for model development and internal validation. Data on all patients undergoing a curative intended surgery in an elective setting for adenocarcinoma of the colon and/or rectum in the period 1 January 2014 to 1 April 2019, was collected from the DCCG database20. DCCG is a nationwide clinical quality register, which covers more than 99% of patients operated for CRC in Denmark since 2001. The dataset was enriched with data on a patient level with nationwide prescription data since 1995 from DPR21, with nationwide data on biochemical and immunological biomarkers from RLRR since 2013–201522, and with trajectory data from public Danish hospitals from DNPR since 197723. The data sources were harmonized into the Observational Medical Outcomes Partnership (OMOP) common data model (CDM)24. A multidisciplinary team (MDT) of data scientists and medical doctors was responsible for transforming the registry data to the OMOP format, where source data were mapped to representative concepts in the OHDSI Standardized Vocabularies25 and tables, following a process of one medical doctor mapping the concept, another reviewing the mapping and suggesting updates to the initial mapper. Cases where the initial mapper and the reviewer doubted the solution or did not agree were flagged for plenary team discussion, where a decision was made. Clinicians and data scientists worked together to define an extract, transform and load logic to create a database, where an automated tool developed by the OHDSI community was used to identify potential data quality errors26.
The RCC was used for external validation of the model and as a comparative cohort against the PCC. Data were retrieved locally from EHR at the Department of Surgery at Zealand University Hospital in Denmark for all patients undergoing elective, curative-intent surgery for CRC from 1 January 2020 to 31 January 2023. To ensure accuracy and reliability, all collected data underwent monitoring, querying and validation by the senior investigator. Assessors who reviewed medical records received a structured introduction to the database before data entry. The primary investigator validated the first 20 records for each assessor. Any inconsistencies in data capture were discussed with the assessors and corrected accordingly. Thereafter one out of every ten records was checked randomly for ongoing validation. Assessors had regular opportunities to discuss cases with the primary investigators, and consensus was reached during panel discussions when needed. The PCC cohort was represented by all patients referred to the MDT meeting at Zealand University Hospital, Denmark, with suspected CRC who were deemed eligible for curative-intent surgery during the period from 1 February 2023 through 31 December. Patients scheduled for emergency surgery, defined as surgery within 72 h of the initial outpatient clinic visit and/or a preceding emergency department visit, as well as those patients requiring additional evaluation or procedures before elective CRC surgery were excluded. An AI-based risk prediction model for 1-year mortality, followed by personalized treatment pathways for perioperative optimization according to the predicted mortality risk, was implemented as standard treatment at Zealand University Hospital for all eligible patients on 1 February 2023. Thereby, the PCC cohort was used as an intervention cohort for a clinical trial. A prospectively maintained database, managed using an EHR form in REDCap27, was established to serve as the data source for the PCC cohort. Accuracy, reliability and validity were ensured in the same manner as for the RCC database.
Reporting on sex followed The Sex and Gender Equity in Research—SAGER guidelines28. In all three study cohorts, an adequate representation of both male and female patients was expected, as all patients diagnosed with CRC and eligible for elective, curative-intent surgery were included, representing the CRC population. No exclusions were made based on sex. Sex was recorded as biological sex based on registry or EHR data. Information on gender was not available and was not collected.
Problem-based learningA local panel consisting of colorectal surgeons, epidemiologists and data scientists was established to investigate drivers of poor postoperative trajectories and potential risk-reducing initiatives. Data from the DCCG on the NRC was used as the data foundation for the study due to its availability, validity and broad inclusion of valuable data for patients operated on for CRC. The panel agreed that identifying high-risk patients and introducing targeted interventions would be a high probability of success strategy. We used 1-year mortality as a surrogate for poor postoperative outcomes due to the high reliability of vital status available through the Danish Civil Registration System29 and the previous studies showing substantial differences in 1-year mortality after elective CRC surgery according to generic frailty indicators and correlation with postoperative morbidity30,31. The association between four prognostic factors, representing different aspects of health domains, age at time of surgery (<50 years, 50–59 years, 60–69 years, 70–79 years, ≥80 years), CC-Index groups (0, 1–2, 3–4, ≥5), WHO PS and UICC stage, and overall survival time was investigated using unweighted Kaplan–Meier curves and inspected visually. For each prognostic factor level, data were stratified further by whether at least one postoperative complication graded CD 2 or higher32 occurred. The correlations between prognostic factors were investigated using Spearman’s rank correlation coefficient for all complete pairs of variables.
Framework of the 1-year mortality prediction modelThe development of a prediction model to support decision-making in perioperative planning has been discussed and supported by representatives from the Danish Colorectal Cancer Patient Association, as part of the Enhanced Perioperative Oncology Consortium. The NRC cohort was used to develop the prediction model, using the standardized framework for developing clinical prediction models, PatientLevelPrediction33, which is interoperable with the OMOP format. The study used death within 1 year following surgery, defined as death from any cause between day 0 and day 365 from the date of surgery, as the outcome variable. In addition, risk groups were created based on a clinical request to guide perioperative optimization pathways. Patients were grouped by their predicted risk of 1-year mortality following surgery: ≤1%, >1 to ≤5%, >5 to ≤15%, or >15%, styled as group A, B, C and D. For each group the proportion of patients dying within 1 year after surgery was calculated for the model development, internal validation and external validation sets by risk group. Further, surgical complications graded as CD ≥3a and medical complications graded as CD ≥2 within 30 days were also reported for each risk group to support the clinical value of the risk groups.
Selecting covariates for the 1-year mortality prediction modelThe selection of candidate covariates was developed iteratively. Initially, a data-driven model was trained using age, sex and all conditions occurrences, drug exposures, procedure occurrences, observations and measurement values, with any event occurring within 30 days, 365 days, 1,825 days or any time before the index date. Variables were ranked based on their standardized mean difference and presented for clinicians, who identified thematic variables as a base to construct new input variables or keep them as is for the training of the clinical model (for example, combining codes that represent ischemic heart disease or diabetes mellitus, or keeping a measurement as it is). For laboratory measures, the candidate covariates were chosen based on routinely available blood tests performed preoperatively before elective cancer surgery at the center where the model would be implemented. The final candidate covariates were all designed to be feasible for clinicians to retrieve during the preoperative planning, either through the EHR system or during the preoperative outpatient clinic visit. The list of candidate covariates was reviewed by clinical personnel, who could request covariates not included through the initial process.
Sample size for the 1-year mortality prediction modelA post hoc calculation of the minimum sample size of patients needed to develop a clinical prediction model was performed using the method described by Riley et al.34 The calculation assumed 68 candidate covariates, that the model would explain 10% of the variability and the prevalence of the outcome would be 5.2%. The minimum number of patients needed to develop the model was 6,941 to develop a clinical prediction model with an acceptable difference in apparent and adjusted R-squared and margin of error in the estimation of the intercept of 0.05.
Missing dataMissing data were handled in three ways: for body mass index, clinical T category, clinical M category, alcohol consumption and smoking status, a specific code for missing values was used. For diagnosis, drug exposures and procedures, an absence of a positive code was considered as negative, having no option for missing. For continuous variables, missing values were imputed by the median value of the register data.
Development and validation of the 1-year mortality prediction modelA standardized framework for developing prediction models was used for model training and internal validation33. The registry data were stratified by outcome and split into a model development set containing 75% of the patients used for model development and an internal validation set containing 25% of the patients. The RCC was used for external validation, representing the population where the prediction model was to be implemented. The model was validated externally using the predicted and observed 1-year mortality and further investigated for clinical usefulness by investigating the incidence proportion of 1-year mortality, medical complications and surgical complications in predefined risk groups incrementally increasing the predicted risk of 1-year mortality. The RCC timeperiod did not overlap the NRC (development and internal validation), with the RCC (external validation) being more recent. Model development was done using the least absolute shrinkage and selection operator (LASSO) logistic regression as a statistical learner with fivefold crossvalidation in the model development set, implemented with cyclic coordinate descent algorithm to optimize the likelihood function35. The method allows for estimating an optimal hyperparameter based on the crossvalidation. For all covariates, the model used simple linear relationships. Feature selection was based on the property of the LASSO regression to shrink covariate coefficients to 0, thereby having no effect on the prediction36. Model performance was evaluated in the model development, internal validation and external validation sets. Calibration was evaluated using calibration-in-the-large and moderate calibration from a previously published framework37. Calibration-in-the-large was assessed using the ratio of observed events versus the expected number of predicted events, whereas moderate calibration was assessed visually using flexible calibration curves created with locally estimated scatterplot smoothing. Calibration curves were investigated only for evaluation sets containing at least 200 events and nonevents37. Discrimination was evaluated using the AUROC and sensitivity with a threshold value of 0.15. CIs for the calibration-in-the-large and calibration intercept were estimated based on 10,000 bootstrapped resamples. Reporting was done in accordance with the TRIPOD+AI guideline38 (checklist available in supplementary information).
Clinical implementation of the 1-year prediction modelTo accommodate the need for data storage, computational power and high-level security, the IT infrastructure was developed in a secure private cloud and hosted by the Danish National Life Science Supercomputing Center39. Consultant surgeons received secure cloud environment access through multifactor authentication. Data were extracted from patient EHR manually, and model output data were extracted and registered in the EHR.
The AI-based clinical decision support tool was developed and deployed as an inhouse software solution within Zealand University Hospital, adhering to the Medical Device Regulation (MDR, EU 2017/745, Article 5(5))40, which governs the development and use of medical software within healthcare institutions. Compliance with MDR 5(5) ensures that the system meets state-of-the-art validation, risk management and clinical governance requirements, supporting its safe and effective implementation in clinical practice.
All patients referred to the MDT meeting at Zealand University Hospital, Denmark, with suspected CRC during the period from 1 February 2023 through 31 December 2023, were risk stratified by a consultant surgeon before the MDT meeting. During the first outpatient visit, input data were modified, if necessary, according to eventual discrepancies in information used for initial risk assessment, and updated output data were imported into the patient’s EHR.
Individual treatment pathways according to risk profileThe individual treatment pathways were tailored according to the risk group of the patient. The risk group was allocated according to the prediction model risk profile A, B, C and D and used as a decision-making tool, enabling the possibility of adjusting the risk group based on clinical judgment when deemed necessary by colorectal surgeons. Individual treatment pathways were predefined based on the assigned risk group and consisted of interventions designed based on existing evidence within perioperative optimization in addition to standard postoperative protocol based on enhanced recovery after surgery protocols41. The individual interventions in a bundle class A, B, C or D were not picked by the clinicians at their discretion but were administered as a standardized bundle, including all the elements for the particular bundle. The intensity and frequency of interventions increased with the predicted 1-year mortality risk group. Due to the study’s complexity and the several interventions, a detailed description of interventions following CERT42 and TIDieR43 guidelines is provided in the Supplementary Information. Briefly, the main interventions in the preoperative period included interventions directed towards correcting iron deficiency anemia (intravenous iron supplementation), nutritional deficit (consultation by a dietician with use of specific protein supplementations), functional deficit (nonsupervised and supervised training according to risk profile), geriatric assessment and respiratory physiotherapy according to risk profile. The intraoperative interventions constituted goal-directed therapy protocols. For hemodynamic monitoring, lithium dilution cardiac output was utilized. Stroke volume and stroke volume variation were used to assess fluid responsiveness. Perfusion index and central venous oxygen saturation were used for decision support. Fluid therapy was administered according to the Danish Society of Anesthesiology and Intensive Care Medicine44. In the postoperative period, the main interventions constituted standardized discharge criteria from the postoperative care unit (POCU) after consultation with both the consultant anesthesiologist and the consultant surgeon according to risk profile. Patients in group D were admitted to the POCU for the first 24 h after surgery. All patients in group D were consulted by the operating surgeon and anesthesiologist within the first 2 h after surgery. Goal-directed therapy was continued during their stay at the POCU. Patients in group D were assisted individually by a nurse who was educated in the enhanced recovery after surgery protocol. Opioid-sparing pain management was applied for all patients; a transversus abdominis plane block or transmuscular quadratus lumborum block was administered if necessary. According to the risk profile, the patients were offered postoperative physiotherapy, delirium screening and nutritional intervention. All patients were discharged according to standardized criteria, including assessment for sufficient bowel function, mobility and pain control.
Before/after implementation of personalized perioperative treatmentTo assess the comparability of the RCC and the PCC, baseline characteristics were compared across key demographic and clinical variables. To further minimize selection bias, the same inclusion criteria and data sources were applied to both cohorts. A comparison of postoperative events between the PCC and RCC was used to investigate the association between the implementation of the personalized perioperative treatment supported by a clinical prediction model as a decision support tool. In the RCC cohort, perioperative optimization strategies were applied based on clinical judgment and MDT discussions with specific optimization efforts as reported previously2,45,46,47. The main elements of the optimization bundle were consistent between the two cohorts. With the implementation of the prediction model, a standardized decision support tool was introduced, ensuring a structured risk stratification process guiding intervention intensity according to predefined risk categories. The main outcome was the incidence proportion of severely complicated postoperative courses, defined as CCI > 20 within 90 days after CRC surgery. This specific cutoff value of CCI > 20 as a measure of clinical relevance for severely complicated postoperative courses was determined based on findings from a recent randomized clinical trial2. Further outcomes included the number of readmissions, defined as the count of all-cause unplanned admissions to a hospital lasting more than 24 h within 90 days after index surgery, the number of postoperative complications was defined as the count of adverse deviation from the expected postoperative course in the first 90 days postoperatively, and any medical complications, defined as any adverse deviation from the postoperative course associated, but not linked directly to the surgical procedure during the first 90 days postoperatively.
Statistical analysis of the clinical outcomes in the before/after comparisonContinuous variables are presented as medians with the first and third quartiles. Categorical variables are presented as counts and fraction percentages. Hypothesis testing was performed using regression models and chi-squared and Wilcoxon rank-sum tests. The agreement between the risk group suggested by the decision support tool and the risk group chosen by the clinicians in the PCC was reported using an unweighted Cohen’s kappa coefficient. Relationships between outcomes and variables were modeled using either a univariate model containing only treatment with the treatment paradigm as a binary variable, or a multivariable to account for the differences in risk group distribution, where both the treatment paradigm and the risk group were included as independent variables. The binary outcomes (CCI > 20 and any medical complications) were modeled using logistic regression, whereas count data (number of readmissions and number of complications) were modeled using a negative binomial regression. Two-tailed P values ≤ 0.05 were considered statistically significant.
Cost-effectiveness analysisHybrid decision tree and Markov model structureThe hybrid decision tree Markov (HDTM) model was developed to evaluate the short-term cost-effectiveness of personalized perioperative treatment compared to standard care with a time horizon of 1 year after surgery. The HDTM model simulated the expected costs and QALYs for a hypothetical cohort undergoing either the standard of care or the personalized perioperative treatment. Detailed information on the model cohort, transition probabilities, costs and utility scores for model states are available in Supplementary Information. The simulation was based on a hypothetical cohort of patients with a base case risk group distribution as the RCC. The HDTM assumed patients received postoperative bundle care according to risk group under the personalized perioperative treatment, while all patients’ standard of care was assumed in the standard-of-care arm to receive the same treatment. For the decision tree component of the model, the proportion of patients developing a complicated postoperative trajectory versus a noncomplicated postoperative trajectory was determined based on parameter estimates of the risk group and treatment effect. A complicated postoperative trajectory was defined as any patient with a complication graded 2 or above on the CD scale, as this corresponds to a CCI score of at least 20.9. For the Markov simulation, cycle length was set to 1 day (and repeated 365 times) with the health states (decision nodes) representing different levels of contact with the healthcare sector: ‘healthy (no contact),’ ‘inpatient visit,’ ‘outpatient visit,’ ‘general practitioner visit’ or ‘dead.’ The initial state was set to ‘inpatient’ for all patients on day 0. Transition probabilities were based on data from RCC and PCC with a relative increase in complicated trajectories of 5% in risk group A, 40% decrease in risk group B, 16% decrease in risk group C and 51% decrease in risk group D for the personalized perioperative treatment. Thus, the only difference between the personalized perioperative treatment and standard of care, aside from intervention costs, was the difference in distributions between uncomplicated versus complicated trajectories. A probabilistic sensitivity analysis was constructed to address the total parameter uncertainty, where the output was per risk strata complication combination for both the standard of care and the intervention strategy. Utilities were transformed into QALYs by adding the days alive during the study period. Based on the estimated costs and QALYs, the personalized perioperative treatment was evaluated against the standard of care, and the incremental cost-effectiveness ratio was calculated.
Costs and health effectsAn extended healthcare sector perspective was applied, including costs of inhospital care, outpatient care, general practitioner visits and prescription medicine. Discounting was not applied. Detailed information on costs and health effects is described in the Supplementary Information, together with Supplementary Tables 3–5. In summary, gross cost estimates for the model trajectories were based on the healthcare consumption of the NRC. All unit costs were valued using year 2023 prices. Danish Diagnose-Related Group tariffs were applied as unit costs for hospital care obtained from DNPR, whereas the unit cost of a general practitioner visit was set to the base tariff per visit based on the services and related tariffs between the Organization of General Practitioners and the Regional Board of Salaries and Fees for General practice. Costs of prescription medicine were estimated from the DPR using drug prices48. Costs associated with implementing the personalized perioperative treatment included costs associated with hosting the decision support tool, salary for system administrators, hourly wages for hospital staff and utensils used. Health effects were measured using QALYs and were based on utility scores derived from EQ-5D-5L questionnaires for 139 patients from the PCC. Relative decreases in utility were assumed for the inpatient state and all complicated trajectories. The health effects were assumed to be identical across the two treatment arms but with a different distribution of uncomplicated and complicated trajectories.
Reporting summaryFurther information on research design is available in the Nature Portfolio Reporting Summary linked to this article.
Comments (0)