Chemicals and animals
Unless otherwise noted, chemicals used in this study were purchased from Sigma-Aldrich St. louis, MO or Nacalai tesque Kyoto, Japan. Equine chorionic gonadotropin (eCG) and human chorionic gonadotropin (hCG) were purchased from Asuka Seiyaku.
C57BL/6NJ male mice (8–12 weeks old) and Crl: CD1 (ICR) female mice (3 wk old) were purchased from Jackson Laboratory Japan Yokohama-shi, Japan. Animals were housed in an environmentally controlled room with a 12-h light/dark cycle, a temperature of 23 ± 3 °C, and free access to laboratory food (MF; Oriental Yeast Co., Ltd Tokyo, Japan.) and tap water. All animal experimental procedures were reviewed and approved by the Animal Care and Use Committee of Hiroshima University (C23-36) and conducted according to regulations.
Western blotting
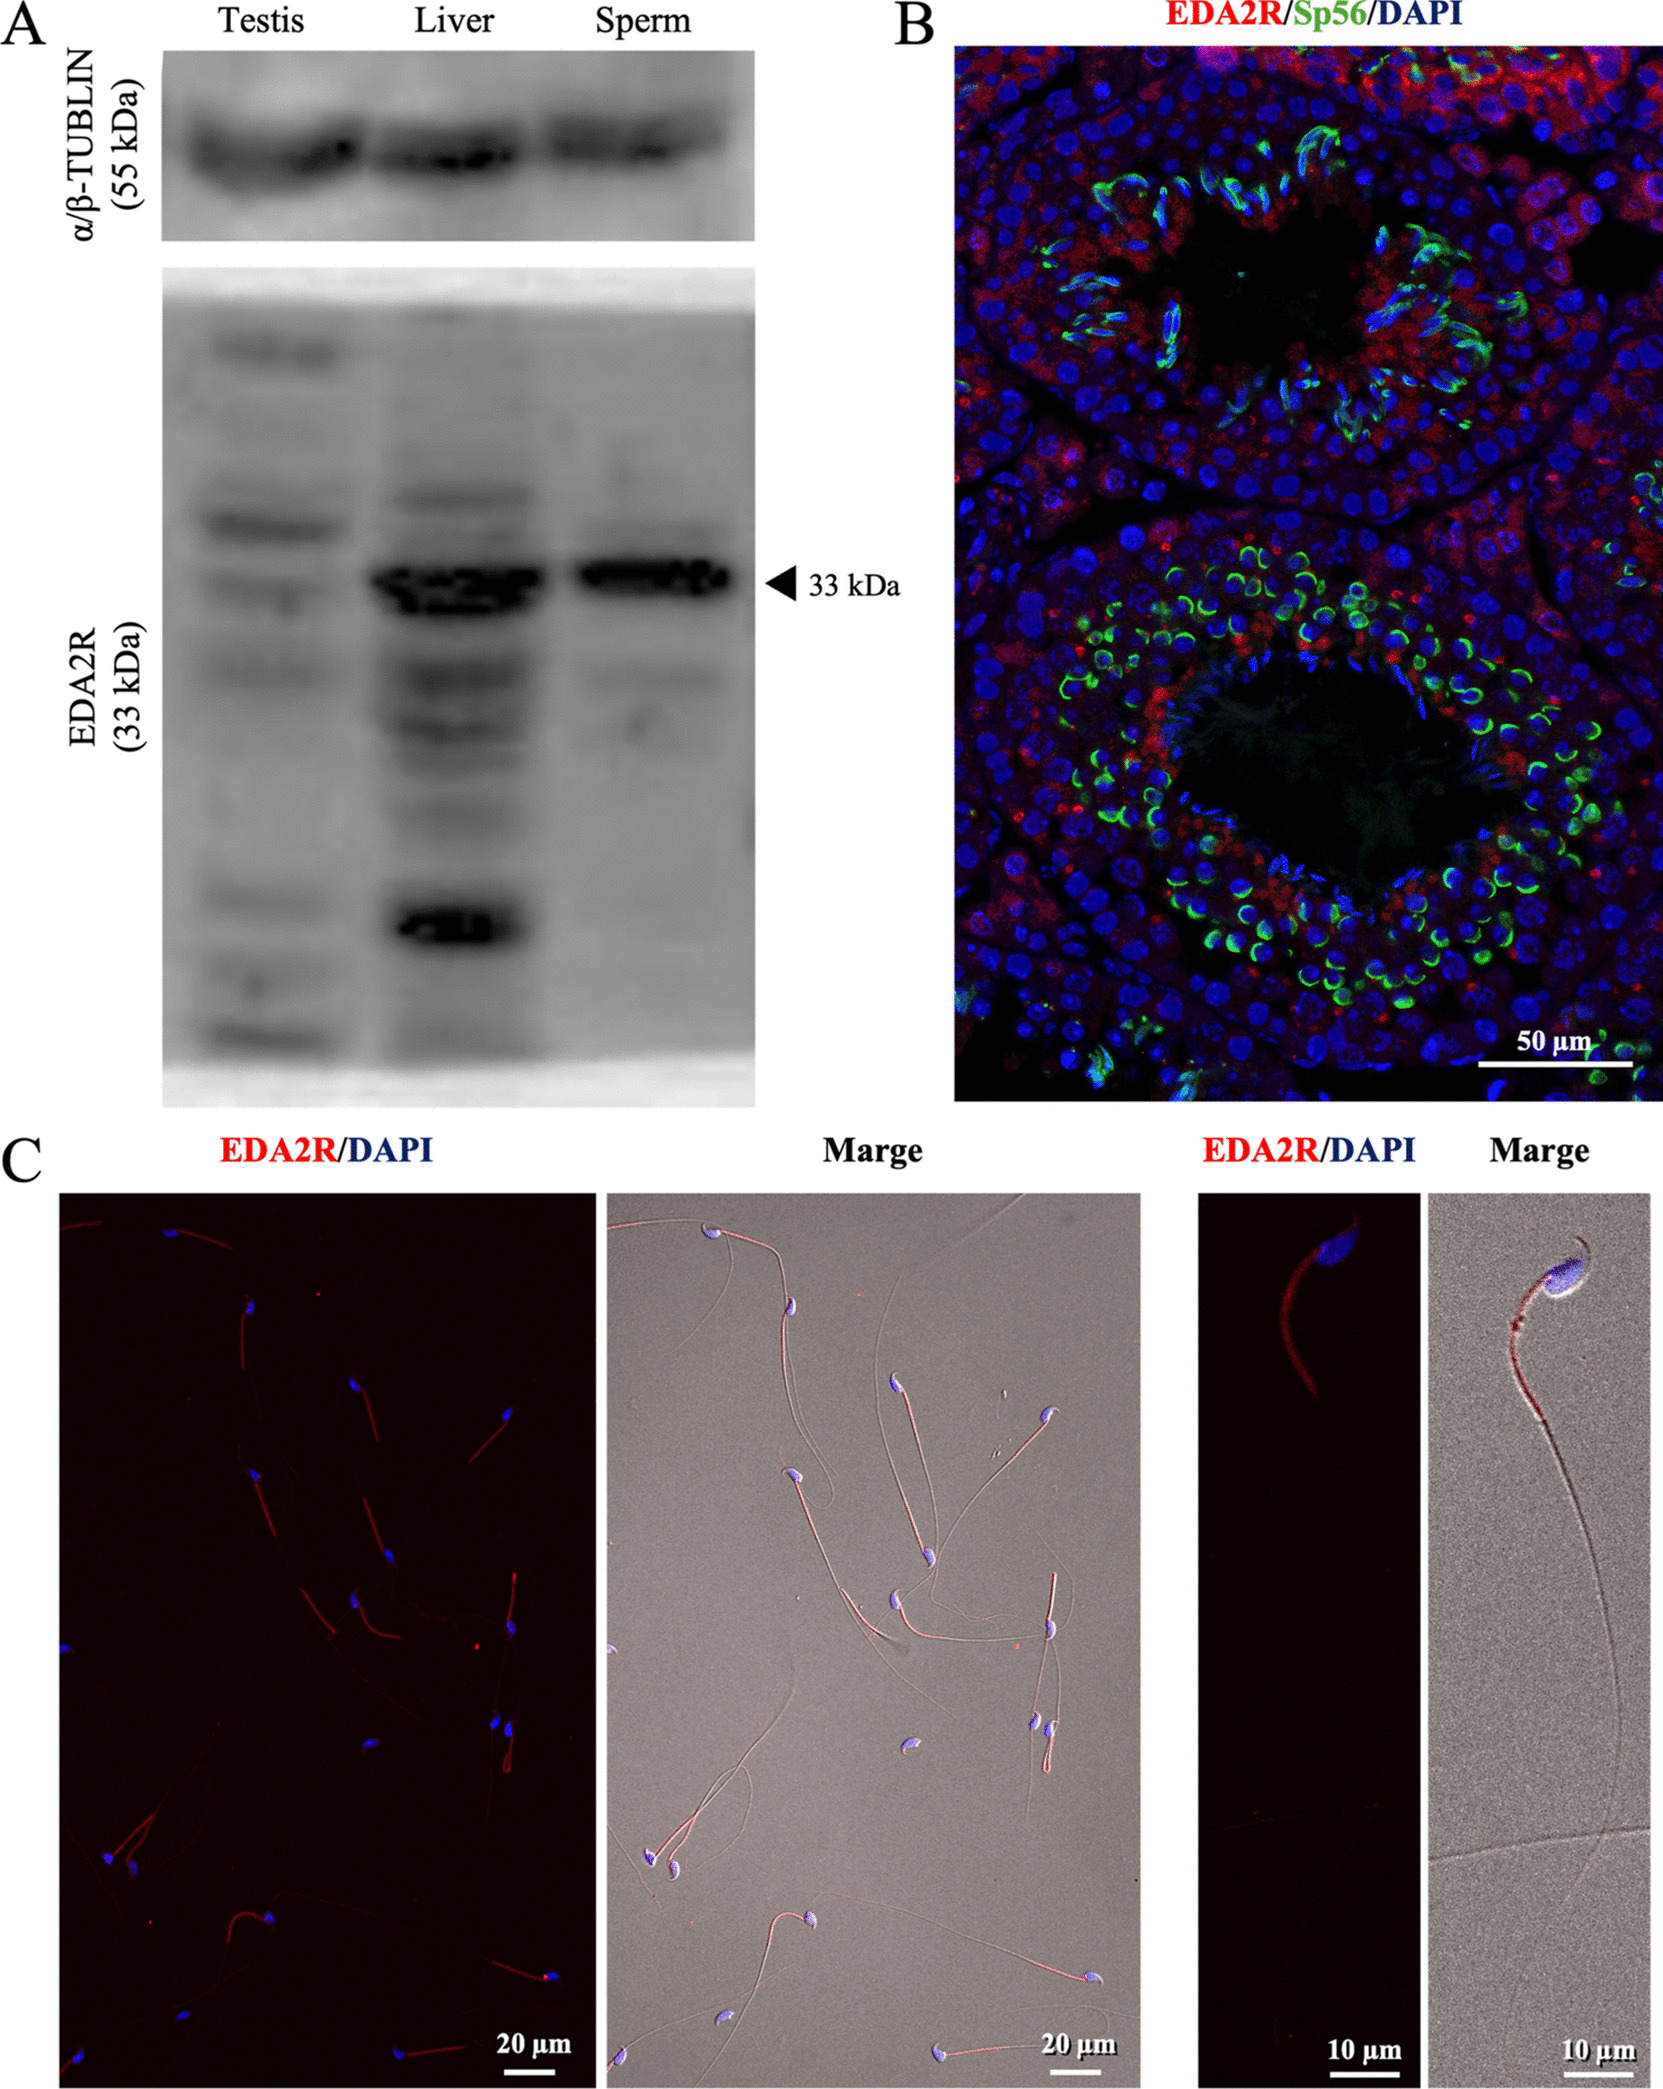
Protein samples of sperm collected from the cauda epididymis, testis, and liver as a positive control were obtained using cell lysis buffer (04,719,964,001, cOmplete™ Lysis-M EDTA-free, Roche Basel, Switzerland). For analyzing tyrosine phosphorylation, sperm was collected in human tubal fluid (HTF) medium (Composition is listed in the Supplemental Table 1), incubated for 0, 30 min or 1 h, and then lysed. The extracts were separated by SDS–polyacrylamide gel (10%) electrophoresis and transferred to polyvinylidene fluoride membranes (10,600,069, Cytiva Marlborough, MA), as described in our previous study (Yamanaka et al. 2025). Membranes were blocked with 5% (w/v) BSA in Tris-buffered saline and Tween 20 (TBST), incubated overnight at 4 °C with primary antibodies [EDA2R, 1:1000, bs-7111R, Bioss Antibodies; phosphotyrosine antibody 1:10,000, 9411S, Cell Signaling; α/β-Tubulin, 1:1000, 2148S, Cell Signaling Danvers, MA]. The membranes were washed with TBST and incubated with HRP-labeled anti-rabbit IgG antibody (1:4000; 7074S; Cell Signaling). The bands were visualized using an Enhanced Chemiluminescence detection system (RPN2232, Cytiva) and ChemiDocTM MP Imaging System (Bio-Rad Laboratories Hercules, CA).
Immunofluorescence
Testis was fixed overnight in 4% (w/v) paraformaldehyde/phosphate-buffered saline (PBS), dehydrated in 70% (v/v) ethanol, and embedded in paraffin. Sperm was mounted on glass slides, air-dried, fixed with 4% paraformaldehyde for 30 min, and permeabilized with 0.3% (v/v) Triton X-100 in PBS for 30 min at room temperature. The Sects. (4 μm) and slides were blocked with goat serum and incubated overnight with primary antibodies [rabbit anti-EDA2R, 1:100 and mouse anti-SP56, 1:100, 55,101, QED Biologicals]. After washing, Cy3-labeled goat anti-rabbit IgG (1:200, C-2306, Sigma), FITC-labeled goat anti-mouse IgG and DAPI (VECTESHIELD Mounting Medium with DAPI, H-1200, Vector Laboratories Newark, CA) were used to visualize the antigens and nuclei. Digital images were obtained using an APX100 Digital Imaging System and CellSens imaging software (EVIDENT), as described in our previous study (Younus et al. 2024).
Assessment of sperm motility
Sperm motility was evaluated using computer-assisted sperm analysis (CASA) as described in our previous study (Umehara et al. 2019). Cauda epididymis sperm recovered from male mouse were dispersed in 500 µL of HTF, and incubated at 37 °C and 5% CO2 for 1 h in HTF containing EDA-A2 (the specific ligand of EDA2R receptor; 922-ED, R&D Systems Minneapolis, MA) at different concentrations (0,1,10,100 and 1,000 ng/mL). Thereafter, sperm tracks were captured at 60 Hz using the CASA system (HT CASA-Ceros II; Hamilton Thorne Beverly, MA) for 0.5 s (45 frames). More than 100 individual trajectories were recorded. The following sperm motility parameters were analyzed: motile sperm were denoted by an average path velocity of > 10 μm/s and a straight-line velocity of > 0 μm/s.
Evaluation of acrosome reaction
The acrosome status was assessed using 25 µg/mL fluorescein isothiocyanate-conjugated peanut agglutinin (FITC-PNA; L7381, Sigma Aldrich) and 12 µM propidium iodide (PI; L7011, Invitrogen Carlsbad, CA), as described in our previous study (Yamanaka et al. 2025). After incubation in the dark at 37 °C for 10 min. The fluorescence of FITC and PI were analyzed by flow cytometry (Attune™ CytPix Flow Cytometer, Thermo Fisher Scientific Inc.) using 530/30 and 695/40 nm bandwidth filters, respectively. Acrosome reacted sperm was analyzed—FITC fluorescence positive, but PI negative gate (Q4). A total of 100,000 sperm events were analyzed. The sperm population is shown in Supplementary Fig. 1.
In vitro fertilization (IVF)
As detailed in our earlier study (Yamanaka et al. 2025), IVF was performed. Three weeks old C57BL/6NJ female mice were injected intraperitoneally with 4 IU eCG to stimulate follicle development and 5 IU hCG at 48 h later. Cumulus-oocyte complexes (COC) collected from the oviductal ampulla 16 h after hCG injection were placed into 100 μL of HTF medium. Sperm were collected from the cauda epididymis of 15 wk or older C57BL/6N male mice in 100 μL of HTF medium. After 60 min of incubation with or without EDA-A2 (1000 ng/mL), the sperm was added into HTF medium at a final concentration of 2 × 10⁵ sperm/mL, and co-incubated with the up to 15 COCs (ranging from 10 to 15) per culture drop. After 6-h incubation at 37 °C and 5% CO2, oocytes were washed three times thoroughly and cultured in KSOM medium (MR 106-D; Sigma). The cleavage rate was determined on Day 1 (Day 0 = day of IVF), and the appearance of blastocysts was recorded on Day 5.
qPCR
Immature female mice were administered 4 IU of eCG for 48 h, followed by an injection of 5 IU of hCG. Ovaries and oviducts were collected from immature mice that had not administered hormones, 48 h after eCG administration (= 0 h before hCG administration), and 4, 8, and 12 h after hCG administration. Granulosa cells were isolated from the antral follicles by needle puncture in Dulbecco's Modified Eagle Medium and recovered from the medium.
Total RNA was extracted from ovaries, oviducts, and granulosa cells using the RNeasy Mini Kit (74,106, QIAGEN), as described in our previous study (Yamanaka et al. 2025). The cDNA was synthesized from 200 ng (10 ng/µL) of total RNA using oligo(dT)15 primers (3805, Takara Bio Inc., Shiga, Japan) and an Avian myeloblastosis virus (AMV) reverse transcriptase (M5101, Promega Madison, WI). The cDNA and primers were added to Power SYBR Green PCR Master Mix (4,367,659, Applied Biosystems, Foster City, CA,) in a total reaction volume of 15 μl. Conditions were set to the following parameters: 10 min at 95 °C followed by 50 cycles each of 15 s at 95 °C and 1 min at 60°C. Cycles were repeated 45 times. The following primers were used: Eda-a2, 5′-CTGGTGCTGCTGATAAAACTGG-3’ (forward) and 5′- TTGGCAAACAGCTGTGAGGA-3’ (reverse); Rpl19, 5′- GGCATAGGGAAGAGGAAGG-3’ (forward) and 5′- GGATGTGCTCCATGAGGATGC-3’ (reverse). Expression was first normalized to housekeeping gene Rpl19, and fold change was calculated relative to the mean of the control samples.
Statistical analysis
Quantitative data were presented as means ± SEM. Student's t-test was used to compare the two groups. Differences between groups were assessed using one-way analysis of variance (ANOVA). When ANOVA was significant, differences among values were analyzed using Tukey's Honest Significant Difference test for multiple comparisons. Cleavage and blastocyst rates were analyzed using chi-squared test. R (version 4.3.1) was used for statistical analysis. Statistical value of p < 0.05 was defined as a significant difference.


Comments (0)