
Remember me


We generated iPSC-derived iTF Microglia using a protocol established by Dräger et al., 2022 [32]. Human APOE3 homozygous iPSCs (WTC11, Coriell Cat. No. GM25256) with stably integrated doxycycline-inducible transcription factors (CEBPa, CEBPb, IRF5, IRF8, MAFB, PU1) were maintained according to established protocols [32, 55]. For differentiation, day 0 iPSCs were seeded onto plates coated with Matrigel and poly-d-lysine in Essential 8 Medium (Gibco; A1517001) supplemented with 10 µM ROCK inhibitor and 2 µg/mL doxycycline (Clontech; 631311). On day 2, the media was changed to Advanced DMEM/F12 Medium (Gibco; 12634-010) supplemented with 1 × Antibiotic-Antimycotic (Anti-Anti) (Gibco; 15240-062), 1 × GlutaMAX (Gibco; 35050-061), 2 µg/mL doxycycline, 100 ng/mL Human IL-34 (Peprotech; 200−34) and 10 ng/mL Human GM-CSF (Peprotech; 300-03). On day 4, 6, and 8 the media was replaced with Advanced DMEM/F12 supplemented with 1 × Anti-Anti, 1 × GlutaMAX, 2 µg/mL doxycycline, 100 ng/mL Human IL-34, 10 ng/mL, Human GM-CSF, 50 ng/mL Human M-CSF (Peprotech; 300−25), and 50 ng/mL Human TGF-β1 (Peprotech; 100–21C). On day 8, the differentiated iTF Microglia were used for experimentation. For CRISPRi and CRISPRa experiments, iTF iPSCs harboring trimethoprim-inducible CRISPRi or CRISPRa machinery [32] were used and maintained in 50 nM trimethoprim (MP Biomedical; 195527) starting on day 0 and continuing through the remainder of differentiation.
Human iPSC neuron cell culture, differentiation, and generation of FRET biosensorsPre-differentiation and differentiation of excitatory glutamatergic neurons was performed as previously described [83]. Briefly, iPSCs were split into matrigel coated plates in pre-differentiation medium (KnockOut DMEM/F12 with 1× MEM non-essential amino acids, 1× N2 Supplement [Gibco/Thermo Fisher Scientific, 17502-048], 10 ng/mL of BDNF [PeproTech, 450-02], 10 ng/mL of NT-3 [PeproTech, 450-03], 1 µg/mL of mouse laminin [Thermo Fisher Scientific, 23017-015], and 2 µg/mL of doxycycline [Takara; 631311]). 10 nM ROCK inhibitor was added on the initial passage day (Day − 3) and omitted thereafter. After a total of three days in pre-differentiation media (day 0), cells were re-plated on poly-D-lysine coated BioCoat plates (Corning) in BrainPhys media containing 0.5× N2 supplement, 0.5× B27-VA supplement, 10 ng/mL NT-3, 10 ng/mL BDNF, 1 µg/mL mouse laminin, and 2 µg/mL doxycycline. On day 3, media was replaced with complete BrainPhys media without doxycycline. Subsequently, half media changes were performed weekly unless stated otherwise. For uptake experiment, iNeurons were treated on day 7. For seeding experiments, iNeurons were treated on day 3 and harvested for flow cytometry on day 10.
To produce tau FRET biosensor iPSCs, lentivirus encoding tauRD (244–368)-mClover and mApple harboring the P301S mutation was transduced into the previously established CRISPRi-i3N human iPSC line [83] (Coriell GM29371). A polyclonal population of dual-positive TauRD(P301S)-Clover/Apple biosensors were sorted using a BD FACSAria Fusion and expanded for further use.
Human iPSC astrocytesDifferentiation of iAstrocytes was performed as previously described [84].
Cell culture, transfection, and viral infection of cellsHEK293 cells (ATCC, CRL-1573) were cultured in high-glucose DMEM with 10% FBS and penicillin (100 U/ml)-streptomycin (100 µg/ml). SH-SY5Y (ATCC, CRL-2266) cells were cultured in advanced DMEM/F12 (Gibco) supplemented with 10% FBS, penicillin (100 U/ml), and streptomycin (100 µg/ml). Cells were incubated in a humidified atmosphere of 5% CO2 at 37 °C. HEK293 cells were transfected with plasmids using Lipofectamine 3000 (Thermo Fisher Scientific; L3000008) or transduced with lentivirus encoding GPC4 WT, GPC4-secreted, GPC4-ΔHS, GPC4-secreted-ΔHS, NLuc-GPC4 WT, or NLuc-GPC4-secreted. All GPC4 DNA sequences were synthesized by Twist Biosciences and cloned into FM5 vector using a Gibson assembly method.
Protein acquisition, expression, purification, fibrillization, and labelingRecombinant Aβ40 (A-1001-2), Aβ42 (A-1002-2), scrambled Aβ42 (A-1004-1), and α-synuclein (S-1001-1) were purchased from rPeptide. Aβ40 and Aβ42 peptides were dissolved at 5 mg/mL in hexafluoroisopropanol and evaporated into a peptide film. The peptide films were resuspended at 10 mg/mL in DMSO, vortexed, and sonicated for 5 min, then diluted to 0.2 mg/mL in 10 mM sodium phosphate buffer, pH 7.4. The solution was shaken at 900 rpm at 37 °C for 72 h (Aβ40) or 120 h (Aβ42) to form fibrils. Scrambled Aβ42 (A-1004-1) was reconstituted at 0.2 mg/mL in PBS and stored at -80 C° until further use. α-Synuclein was fibrillized by dissolving the lyophilized protein at 2 mg/mL in PBS at 900 rpm at 37 °C for 72 h; α-Synuclein monomer was maintained by immediately storing the freshly reconstituted protein at -80 °C without shaking. Full length 2N4R tau with a C-terminal polyhistidine tag in the pet28b plasmid was expressed and prepared as previously described [85] from BL21-Gold (DE3) competent cells. Tau was purified on a Ni-NTA column and eluted in 1× PBS. To induce fibrillization of tau monomer, 8 µM tau was incubated at 37 °C in 10 mM HEPES, 100 mM NaCl, and 8 µM heparin for 72 h without agitation. Tau and magnetic beads (Spherotech; AM-10-10) were conjugated to pHrodo-red dye or AlexaFluor 647 (ThermoFisher; P36600 and A20006) by buffer exchanging the substrates into 100 mM sodium bicarbonate buffer, adding pHrodo red dye at a final molar ratio of 5:1 (dye: substrate), and incubating at RT for 15 min. Excess dye was quenched by adding glycine at a final concentration of 100 mM for 15 min and then buffer exchanging via dialysis into PBS. For protein pull-down assays, full-length tau-biotin was purchased from rPeptide (T-1114-1). Mammalian-derived and heparan-sulfated GPC4-WT was purchased from Acro (GP4-H52H3).
For APOE expression and purification, human his-tagged full-length APOE3 and N-terminal APOE3 (1–216) DNA sequences were generated by Twist Bioscience and cloned into pcDNA3.4 using a Gibson assembly method. Transient transfection of plasmid DNA was done in Expi293F cells at 37 °C. Cells were harvested on day 7 by centrifugation at 4000 x g for 20 min and the supernatant was filtered through a 0.45 µM sterile filter. The supernatant was incubated with 1mL (per 30 mL of supernatant) Ni-NTA resin (Cytiva; 17371203) and imidazole to a final concentration of 5 mM for 1 h at 4 °C with end-over-end mixing. The resin-media mixture was loaded on a chromatography column and washed with 5 resin volumes of wash buffer (PBS pH 8.0, 5 M NaCl, 50 mM K3PO4, 10 mM imidazole) for a total of two times. APOE3 was then eluted in 1 resin volume of elution buffer (0.5 M NaCl, 50 mM K3PO4, 1 M imidazole) in a total of 3 elution fractions. The purity of each fraction was assessed by SDS-PAGE and fractions > 90% pure were pooled and buffer exchanged into PBS using a 10 kDa MWCO centrifugal filter (Amicon; UFC9010). The protein concentration was determined by bicinchoninic acid (BCA), and the protein was diluted to a final concentration of 8 µM and stored at -80 °C.
iTF Microglia cell surface labelingFor cell surface proteomic studies, the iTF Microglia cell surface was labeled with cell-tethered WGA-HRP according to the protocol established in Kirkemo et al., 2022 [27]. In brief, cells were lifted using Versene (Gibco; 15040066) for 10 min at 37 °C. Cells were diluted in DPBS and pelleted by centrifugation at 1500 g for 5 min and resuspended in DPBS pH 6.5. Cell surfaces were labeled by incubating cells with 0.5 µM WGA-HRP for 5 min on ice, then adding 500 µM biotin tyramide, and finally adding 1 mM of H2O2. The mixture was incubated at 37 °C for 2 min. The reaction was quenched with 10 mM Sodium Ascorbate/1 mM Sodium Pyruvate followed by two additional washes in the same buffer prior to a final wash in DPBS. Cells were pelleted and flash frozen before further processing.
Proteomic preparation for surface-labeled iTF cellsFrozen cell pellets were thawed and processed for LC-MS/MS using a preOmics iST kit (P.O. 00027). Briefly, cell pellets were lysed in 2x RIPA buffer (Millipore Sigma; 10–188) containing protease inhibitors (cOmplete, Mini, EDTA-free Protease Inhibitor Cocktail; Millipore Sigma; 11836170001) and 1.25 mM EDTA. Cells were further disrupted via sonication. Biotinylated proteins were pulled down with NeutrAvidin-coated agarose beads (ThermoScientific; 29204) for 1 h at 4 °C. Beads were transferred to Poly-Prep chromatography columns (Bio-Rad) and sequentially washed with 1x RIPA buffer, high-salt PBS (PBS pH 7.4, 2 M NaCl), and denaturing urea buffer (50 mM ammonium bicarbonate, 2 M Urea). From the PreOmics iST kit, 50 µL of the provided LYSE solution was added to the slurry and the mixture was incubated at 55 °C for 10 min with shaking. The provided enzyme mixture (Trypsin and LysC) was resuspended in 210 µL of RESUSPEND buffer, mixed, and 50 µL was added to the slurry. Samples were allowed to mix at 500 rpm for 90 min at 37 °C, before being quenched with 100 µL of STOP solution. Samples were desalted using the provided Preomics columns and wash buffers per the manufacturer’s instructions. Peptides were eluted with 2Χ 100 µL of ELUTE, dried, and resuspended with 2% acetonitrile and 0.1% TFA. Peptides were quantified using Pierce Quantitative Colorimetric Peptide Assay (Thermo Fisher Scientific, 23275).
LC-MS/MS and data analysisLiquid chromatography and mass spectrometry were performed as described previously [27]. Briefly, 200 ng of samples were separated over a 90-minute linear gradient of 3–35% solvent B (Solvent A: 2% acetonitrile, 0.1% formic acid, solvent B: acetonitrile, 0.1% formic acid) on either an Aurora Ultimate CSI 25 cm×75 μm C18 (Ionopticks) or a PepSep XTREME 25 cm x 150 μm (Bruker) UHPLC column using a nanoElute UHPLC system (Bruker), and injected into a timsTOF pro mass spectrometer (Bruker). Data-dependent acquisition was performed with parallel accumulation-serial fragmentation (PASEF) and trapped ion mobility spectrometry (TIMS) enabled with 10 PASEF scans per topN acquisition cycle. For database searching, peptides were searched using MaxQuant’s (Version 2.6.1) Andromeda search engine against the plasma membrane annotated human proteome (Swiss-prot GOCC database, June 3, 2020 release). Enzyme specificity was set to trypsin + LysC with up to two missed cleavages. Cysteine carbamidomethylation was set as the only fixed modification; acetylation (N-term) and methionine oxidation were set as variable modifications. The precursor mass error tolerance was set to 20 PPM and the fragment mass error tolerance was set to 0.05 Da. Data was filtered at 1% for both protein and peptide FDR and triaged by removing proteins with fewer than 2 unique peptides. GPC6 was identified via a single peptide and was thus excluded from all proteomic analyses with the exception of Fig. 1E where it was included to compare to other glypicans. All mass spectrometry database searching was based off of at least three biological replicates. Biological replicates underwent washing, labeling, and downstream LC-MS/MS preparation separately. Perseus was used to analyze label-free quantitation data generated in MaxQuant. All peak areas were log2(x) transformed and missing values were imputed separately for each sample using the standard settings (width of 0.3, downshift of 1.8). Significance was based off of a standard unpaired Student t test with unequal variances across all replicates. Reported peak area values represent the averages of all replicates. Proteins with a −/+1.5-fold change and p < 0.05 were included in downstream analysis, and this threshold was chosen to balance the identification of biologically relevant changes while maintaining statistical rigor [86]. For representation of the data in figures, a Z-score was computed and is defined as (LFQ Area - Mean LFQ Area)/Standard Deviation. Protein IDs that were not annotated to be secreted or expressed extracellularly were removed. Heatmaps comparing expression levels between donors were generated with heatmapper.ca using an average linkage clustering method with Euclidean distance.
ImmunocytochemistryAll iTF Microglia were grown on µ-slides (Ibidi; 80804) for imaging studies. For immunocytochemistry of microglia markers, day 8 iTF Microglia were washed with PBS solution, fixed with 4% PFA, and blocked with 10% normal goat serum in PBS. Cells were stained with anti-IBA1 rabbit primary antibody (1:50; Cell Signaling Technology), anti-PU.1 rabbit primary antibody (1:100), and anti-TMEM119 mouse primary antibody (1:100) overnight at 4 °C followed by secondary labeling with Alexa Fluor 488 anti-mouse or Alexa Fluor 546 anti-rabbit (1:2000) and Hoechst 33342 (Invitrogen; H1399) for 1 h at RT. For the intracellular antigens IBA1 and PU.1, cells were permeabilized in 0.25% Triton X-100 prior to the addition of primary antibodies. For glypican staining, cells were treated with 1 µM Aβ40 or Aβ42 fibrils for 24 h, washed three times in PBS, and fixed as described earlier. Cells were then blocked with 10% NGS and stained with GPC1 (1:100; Abcam), GPC2 (1:100; Invitrogen), GPC3 (1:200; Invitrogen), GPC4 (1:100; ProteinTech), GPC5 (1:200; R&D Systems), and GPC6 (1:100; Bioss) overnight at 4 °C followed by secondary labeling with Alexa Fluor 488 anti-mouse or Alexa Fluor 647 anti-rabbit (1:2000) and Hoechst 33,342. For Aβ fibril and GPC4 correlational analysis (Fig. S4), cells were treated with pHrodo-red labeled Aβ fibrils for 24 h, and then live cells were immunostained with a GPC4 primary antibody followed by secondary antibody for one hour each at 37 °C prior to live-cell confocal imaging. Individual iTF Microglia were segmented using the brightfield channel with FIJI’s Trainable Weka Segmentation plugin [87], and each cells’ GPC4 and Aβ-pHrodo integrated fluorescence intensity was separately quantified. To perform colocalization analysis on SH-SY5Y cells treated with fluorescently labeled tau fibrils, APOE3, and GPC4 (Fig. 7B and S11), images were acquired by confocal microscopy and analyzed using FIJI (ImageJ) with the JACoP plugin. To minimize the contribution of background signal and restrict colocalization analysis to internalized puncta, we first generated an ROI mask based on the combined intensity of all three fluorescent channels. The summed image was auto-thresholded using the Otsu method to create a binary mask defining intracellular puncta. This mask was applied to each individual channel to isolate foreground regions for colocalization analysis. Fluorocytograms, Pearson’s correlation coefficients, Manders’ overlap coefficients (M1 and M2) were generated using JACoP [88, 89]. All analyses were restricted to non-zero voxels to avoid inflation of colocalization metrics by background signal.
Human brain tissue and immunohistochemistrySixteen human brain tissue samples were obtained from the Neurodegenerative Disease Brain Bank at the University of California, San Francisco (Supplementary Material 14). Prior to autopsy, patients or their surrogates provided informed consent for brain donation, in keeping with the guidelines put forth in the Declaration of Helsinki. Neuropathological diagnoses were made following consensus diagnostic criteria [90] using previously described histological and immunohistochemical methods [91, 92, 93]. Cases were selected based on neuropathological diagnosis. Healthy control tissues were obtained from individuals without dementia who had minimal age-related neurodegenerative changes. Formalin-fixed blocks of the middle frontal gyrus were cut from coronal slabs and embedded together into tissue arrays in paraffin wax. Each tissue array contained four small tissue blocks with one tissue block from each histopathologic category (amyloid-/ tau-, amyloid+/tau-, amyloid-/tau+, and amyloid+/tau+). For immunofluorescence, tissue arrays were sectioned at 8 μm using a rotary microtome. The case details are listed in Table 1.
To reduce the autofluorescence of human brain tissue, glass-mounted sections were photobleached for 72 h using a multispectral LED array in a cold room [94]. The sections were baked at 65 °C for 30 min and deparaffinized and rehydrated followed by antigen retrieval in an autoclave at 120 °C for five minutes using 10 mM citrate buffer (pH 6). The tissue sections were permeabilized in PBS containing 0.25% Triton X-100 (PBS-T) and blocked in 10% normal goat serum for 1 h. Primary antibodies were diluted in PBS-T and 10% normal goat serum and applied to the slides overnight at RT. The sections where then washed in PBS-T and secondary antibodies diluted 1:500, with or without DAPI, were applied at RT for two h. For experiments requiring amyloid plaque fluorescent staining, Amylo-Glow RTD (Biosensis; TR-300-AG) was applied for 10 min per the manufacturer’s directions after the secondary antibody application. For experiments requiring amyloid plaque and neurofibrillary tangle fluorescent staining, 5 µM BF-188 (FujiFilm; 025-18801) was applied for 30 min after the secondary antibody application. The sections were washed with PBS and coverslipped with Fluoromount-G (ThermoFisher; 00-4958-02). For quantification of amyloid plaque and neurofibrillary tangle burden, tissue sections were deparaffinzed, peroxidase-blocked with 3% H2O2 in methanol for 30 min, and, for amyloid plaque staining, pre-treated with 88% formic acid for 6 min. Antigen retrieval and antibody staining was performed as described above. DAB reactions were developed by applying Vectastain ABC Elite (Vector Laboratory; PK-6200) followed by 0.05% diaminobenzidine and counterstaining with hematoxylin. Antibodies used in this study include: anti-IBA1 guinea pig primary antibody (1:250; Synaptic Systems), anti-Glypican 1 rabbit primary antibody (1:50; Abcam), anti-Glypican 2 rabbit primary antibody (1:50; Invitrogen), anti-Glypican 4 rabbit primary antibody (1:50; ProteinTech), anti-Glypican 6 rabbit primary antibody (1:50; Bioss Antibodies), anti-Aβ mouse primary antibody (DE2; 1:500; Millipore Sigma), anti-phosphorylated tau (CP13; 1:250; Peter Davies), Alexa Fluor 488 goat anti-guinea pig secondary antibody (1:500; Invitrogen), Alexa Fluor 647 goat anti-rabbit IgG secondary antibody (1:500; Invitrogen), and biotinylated horse anti-mouse secondary antibody (1:200; Vector).
Human brain tissue microscopy and analysisConfocal images were generated using a Nikon Ti2-E microscope equipped with a Crest X-Light-V2 spinning disk confocal (Crest Optics), Celesta Light Engine (Lumencor), Piezo stage (Mad City Labs), and a Prime 95B 25 mm CMOS camera (Photometrics) using a CFI Plan Apo Lambda 60x/1.4 oil or Plan Apo VC 100×/1.4 oil (Nikon). Images were captured using a penta dichroic 405/488/561/640/750 (Nikon), solid-state lasers 405 nm, 477 nm, 546 nm, and 638 nm and emission filters FF01-438/24, FF01-511/20, FF01-560/25, FF01-685/40 (Semrock), Nikon Multi-band for DAPI/Amylo-Glo, Alexa 488, Alexa 568, and Alexa 647, respectively. The data was captured with NIS-Elements software (v. 5.41.01 build 1709, Nikon). Whole-section tiled images were acquired with an Axioscan.Z1 slide scanner (Zeiss) at 20× magnification.
Human microglial GPC4 quantitation was performed blinded to clinical and pathological diagnosis. For each brain section tiled image, 10 random ROIs of the cortex were exported into FIJI [95]. IBA+ microglia were segmented using FIJI’s Trainable Weka Segmentation plugin [87] as previously described [96]. Briefly, the WEKA segmentation classifier was trained with 16 input 8-bit images (one image from each brain) using a fast random forest classifier with the following balanced training features: Gaussian blur, Hessian, membrane projections, Sobel filter, and difference of gaussians. The model was retrained for a total of 5 training sessions and then applied to each image to generate probability maps for microglia objects. The probability maps were thresholded to create microglia image masks. The image masks were then applied to the corresponding GPC4 channels to measure microglial GPC4 mean fluorescence across all brain sections. To quantify microglial GPC4 intensity as a function of distance from amyloid plaques in Alzheimer’s brains, eight Amylo-Glo-positive amyloid plaques were randomly chosen per brain section. For each plaque, IBA1+ microglia were defined as “near” if they were located within 125 μm from the center of the plaque. IBA1+ microglia were defined as “far” if they were located > 150 μm from the edge of all plaques but within 350 μm of the index plaque. Images for this analysis were 16-bit. To assess the relationship between microglial GPC4 and neuritic tau pathology, we stained tissue with α-GPC4 antibodies followed by BF-188, a conformation-sensitive fluorescent dye that differentially labels amyloid and tau pathology based on distinct spectral profiles. This enabled simultaneous visualization and spectral separation of plaques and tangles within the same tissue sections [97, 98]. Amyloid plaques were segmented using BF-188 signal and masks were generated by dilating each plaque boundary by 3 μm to capture peri-plaque regions. The integrated fluorescence intensity of tau pathology (AF546) and GPC4 (AF647) was then quantified on a per-plaque basis. For quantification of amyloid plaque and neurofibrillary tangle burden, whole brain section tiled images were analyzed using Zen 3.9 (Zeiss) and performed blinded to clinical and pathological diagnosis. The overlying neocortex was manually defined, and brightness thresholding was used to delineate anti-amyloid plaque and anti-CP13-positive areas. For each section, the total area of positive signal coverage was measured in the neocortex and expressed as percentage of total area analyzed in each brain [52].
Mouse brain tissue and immunohistochemistryUse of all animals was approved by the UVA Institutional and Animal Care and Use Committee (IACUC). All animals used in this study were handled according to IACUC approved protocols and housed in IACUC approved vivariums at the UVA MR-4. The 5xFAD [99] (Jackson Laboratory stock #34848), APP-SAA knock-in [100] (stock #034711), and C57BL/6J (stock #000664) mice were originally purchased from the Jackson Laboratory. All transgenic mice used were on a congenic C57BL/6 J background.
Samples from APP-SAA and matched C57BL/6J controls were collected at 9 months of age. Samples from 5xFAD and matched C57BL/6J control mice, all female, were collected at 8 months of age. Mice were anaesthetized with isoflurane and transcardially perfused with chilled PBS followed by chilled 4% PFA. Brains were post-fixed in 4% PFA on ice for 2 h before being transferred to 30% sucrose in PBS for cryoprotection. Frozen brains were coronally sliced at 30 μm on a cryostat (Leica CM1950).
For histological staining, free-floating sections were incubated with blocking solution (5% bovine serum albumin, 2% horse serum, 1% Triton X-100 in PBS) for two h at RT before staining. Primary and secondary antibodies were diluted in the same blocking solution. Slices were incubated in primary antibodies at 4 °C for 24 h and secondary antibodies at room temperature for 2 h. The following primary antibodies were used: rabbit anti-GPC4 (ProteinTech; 1:500); chicken anti-GFAP (Aveslabs; 1:500); and goat anti-IBA1 (Abcam; 1:300). The following secondary antibodies from Jackson ImmunoResearch were used at 1:100: anti-rabbit Cy3, anti-chicken AlexaFluor 488 (703-545-155), anti-goat Cy5 (711-175-147). After secondary antibody incubation, slices were stained with Amylo-Glo (Biosensis; TR-300-AG) according to manufacturer protocols in order to detect amyloid plaques, and then were mounted using Vectashield Plus mounting media (Vector Cat# H-1900). Slides were imaged using an Intelligent Imaging Innovations (3i) spinning-disc confocal microscope equipped with a Yokogawa CSX-X1 scan head using 40x and 63x objectives. Images were captured from the dentate gyrus and frontal cortex with a 63x objective for representative images and z-stacks captured with a 20x objective used for GPC4 quantification.
Image analysis was performed using Imaris software (Oxford Instruments, ver. 10.2.0). Microglia, astrocyte, and plaque surfaces were defined using automatic thresholds. After background subtraction, average intensity of the GPC4 channel within microglia and astrocyte surfaces was recorded.
Drosophila immunohistochemistry and imagingFlies were collected for staining at 10 days post eclosion (dpe). After CO2 anesthesia, heads were removed and fixed in 4% formaldehyde (Thermo Scientific) for 15 min at room temperature. Brains were dissected and incubated with primary antibodies dissolved in 0.3% Triton-X100 in PBS (PTX) for 48 h at 4 °C, followed by secondary antibodies in 0.3% PTX for 48 h at 4 °C. The following primary antibodies were used: chicken anti-GFP (Aves Labs, 1:1000); rat anti-mCherry (Invitrogen, 1:1000); mouse anti-amyloid (1:200, BioLegend), and rabbit anti-cDCP1 (Cell Signaling, 1:400). The following secondary antibodies from Jackson ImmunoResearch were used at 1:100: anti-rat Cy3, anti-chicken AlexaFluor 488, and anti-rabbit Cy5. After secondary antibody incubation, slices were stained with Amylo-Glo (Biosensis; TR-300-AG) according to manufacturer protocols, and then were mounted using Vectashield Plus mounting media (Vector; H-1900). Slides were imaged using an Innovative Imaging Innovations (3i) spinning-disc confocal microscope equipped with a Yokogawa CSX-X1 scan head using 40x and 63x objectives.
Drosophila stocksThe following previously made D. melanogaster transgenes were used in this study: wrapper-Gal4DBD, Nrv2-VP16AD (CtxGlia-SplitGal4) [101], alrm-Gal4 [102], nSyb-QF2 [103], UAS-lacZ-NLS [104], QUAS-R-GECO1 [105], and stocks acquired from Bloomington Drosophila Stock Center (BDSC): UAS-dlpRNAi #1 (BDSC #34091), UAS-dlpRNAi #2 (BDSC #50540 [106]), UAS-dlp (BDSC #9160), QUAS-Aβ42 (BDSC #83347 [41]).
Drosophila lifespan and climbingD. melanogaster crosses were set on Molasses Formula Food (Archon Scientific) at 25 °C. Animals of the desired genotypes were collected at 0dpe and housed in vials containing corn syrup/soy medium (Archon Scientific) with 4–10 flies of the same sex per vial. The flies were assessed daily for viability, recorded, and remaining live flies were transferred to fresh vials every 2 days. Additionally, animals were tested for locomotion via climbing assay at 1 and 5dpe. Flies were transferred to empty 9 cm tall vials and allowed to habituate for 3 min. Vials were placed in a 9-vial holder and firmly tapped three times to knock all flies to the bottom of the vial. They were then rested for 30 s, tapped, rested again for 30 s, and received a final tap followed by the climbing assessment in which the highest height climbed by each fly in 10 s was recorded in cm. Each assay was performed between Zeitgeber time 8–9 and recorded on video. Analyses were performed using R, with lifespan analyzed with a Cox proportional hazard model with Bonferroni corrections and climbing data analyzed by a Tobit regression with Bonferroni corrections to account for floor and ceiling effects of the vial constraints.
Phagocytosis assaysMicroglia were plated at 50% confluence on Matrigel-coated 96-well plates. All phagocytosis assays were performed in quadruplicate using pHrodo-Red-labeled substrates. FL tau fibrils or magnetic beads were added to day 8 iTF Microglia at a final concentration of 100 nM or 1.92 × 10⁷ particles/mL, respectively. Phagocytosis was monitored every three hours for a duration of 24 h using an Incucyte SX5 (Sartorius). Four fields of view at 20x magnification per well were captured for each condition using phase and fluorescence channels. Incucyte 2023 A software equipped with the Cell-by-Cell module (Sartorius) was used to create image masks of both individual cells as well as phagocytosed substrates. Cellular integrated fluorescence intensity values of each well were averaged across treatment conditions and graphed as a function of time using Prism 10 (GraphPad). Where indicated, actin polymerization was inhibited by pretreating cells with 5 µM Cytochalasin D (Millipore Sigma; C8273) for 30 min before the addition of phagocytic substrates.
Flow cytometryiTF Microglia were differentiated at 15,000 cells per well in a 96-well plate. On day 8, they were treated with 1 µM Aβ40 or Aβ42 fibrils for 24 h. Cells were harvested with Versene for 8 min and resuspended and washed in DPBS plus 1% FBS, 1 mM EDTA, and 0.1% sodium azide. Immunostaining for cell surface proteins was performed at 4 °C for 1 h with α-10E4 (Amsbio,1:200) α-GPC4 (ProteinTech; 1:200), and α-GPC6 (Bioss; 1:200) antibodies followed by secondary staining at 4 °C for 1 h with Alexa Fluor 488 goat anti-mouse IgM or Alexa Fluor 647 goat anti-rabbit IgG (1:1000). For whole cell staining with GPC4 antibodies, 0.1% Saponin was added to cells for 15 min at RT prior to the addition of antibodies. For tau fibril cell surface binding experiments, cells were pretreated with 100 nM of anti-GPC4 sdAb-Fc for 24 h. Cells were then equilibrated for 4 °C for 15 min before the addition of tau fibrils-AF 647 for 60 min at 4 °C, washed with cold PBS, dissociated with Versene, and subjected to flow cytometry. Single cell fluorescence was measured using a Beckman Coulter CytoFlex flow cytometer. Median fluorescence intensity values of stained cells were normalized to vehicle-treated control samples or total GPC4 levels and plotted using Prism (GraphPad, v10).
For FRET flow cytometry assays, iPSC neuron biosensors were harvested with a 1:1 mix of papain (Worthington; LK003178) and Accutase (VWR / ICT; AT-104) for 10 min prior to resuspending in complete iNeuron media without phenol red. FRET flow cytometry was performed on a FACSCelesta (BD Biosciences). To measure mClover and FRET, cells were excited with the 488 nm laser, and fluorescence was captured with a 530/30 nm and 610/20 nm filter, respectively. To measure mApple, cells were excited with a 561 nm laser and fluorescence was captured with a 610/20 nm filter. To quantify FRET, we used a gating strategy similar to that previously described [52, 53]. The percentage of FRET-positive cells was used for all analyses. For each experiment, 10,000 cells per replicate were analyzed and each condition was analyzed in quadruplicate. Flow cytometry data were analyzed using FlowJo (v.10.9) and data were plotted using Prism (GraphPad, v10).
GPC4 shedding assaysConditioned media samples were harvested 24 h after Aβ40/42 fibril treatment and clarified by centrifugation (500 x g 5 min). Cells were lifted with Versene and pelleted by centrifugation (1000 x g 5 min). The pellet was resuspended in 100 µL of Luciferase assay buffer (Promega; N112A) to lyse and generate a 1× cell lysate sample. NanoLuc Furimazine substrate (Promega; N113A) was diluted 1:10,000 substrate to assay buffer and 1:4 in PBS. To minimize potential cross-luminescence, 20 µL of each sample was loaded into 384-well assay plate (Greiner) surrounded by empty wells. 60 µL of diluted Furimazine substrate was injected and luminescence of each well was read in a Tecan M1000 Pro. The average luminescence values of conditioned media or cell lysate samples were calculated and normalized to PBS-treated samples as a control. When normalizing to total GPC4 levels, the following equation was used: Normalized GPC4 = Shed GPC4 / (Shed GPC4 + Cell Lysate GPC4). For shedding inhibition assays, Marimastat was added to cells one hour prior to the addition of Aβ fibrils.
Protein pull downsTau-biotin (1 µg) was mixed with 3 µg of mammalian-derived GPC4 WT (Acro), 3 µg of mammalian-derived lipidated APOE3, or both in a total of 50 µL of 100 mM NaCl, 10 mM HEPES containing 0.05% Tween20. The proteins were incubated O/N at 4 °C while mixing at 700 RPM. The next day, the protein complexes were added to 50 µL of washed streptavidin Magnesphere Paramagnetic Beads (Promega; Z5482) and incubated for 1 h at RT with mixing at 700 RPM. The magnetic beads were then washed three times with TBS-T containing 0.5 M NaCl and eluted in 10 µL of 1 M glycine, pH 2 for 10 min at RT.
Biolayer interferometryWe characterized the interactions of tau with GPC4 and APOE3 via biolayer interferometry (Octet RED384, FortéBio). Assay buffer was composed of 10 mM HEPES, pH 7.4, 0.1% BSA and 0.01% Tween 20 in deionized water. Biotinylated tau-441 (rPeptide) was diluted with assay buffer to a concentration of 100 nM and Glypican 4 and APOE3 was diluted to a final concentration of 250 nM. In addition, a control anti-tau antibody, MD3.1 [107], was diluted in assay to a final concentration of 50 nM. Streptavidin biosensors (FortéBio) were equilibrated in 200 µL of assay buffer for 30 min before use in a 96-well plate (Greiner). For experimental analysis, 80 µL of tau-biotin, Glypican 4, APOE3, and MD3.1 were dispensed into respective wells on a 384-well assay plate. The sensors were loaded with tau-biotin, followed by quenching of the remaining streptavidin on the sensors with 10 µM biotin buffer (assay buffer with 50 mM biotin), an association step (1800 s) and a dissociation step (800 s). The assay was performed at 25 °C with 1000 rpm shaking. Data were processed and analyzed using the Octet 12.2.2.4 data analysis software. Graphs were subsequently generated in GraphPad Prism.
Negative stain transmission electron microscopyFibrillization reactions were examined for the presence of filaments by negative staining and transmission electron microscopy (TEM). Briefly, 5 µL of sample was spotted on a glow-discharged carbon/formvar-coated 300-mesh grid for 1 min. Excess liquid was blotted off with Whatman paper, followed by washing with another 5 µL of ddH2O. Excess liquid was removed by blotting and the grid was stained with a 2% uranyl acetate solution for 1 min. Excess liquid was blotted off and the grid was imaged by TEM on an FEI Tecnai G2 Spirit Biotwin operating at 120 kV. qPCR. RNA from mammalian cells were extracted and purified using Tri-isolate RNA Pure kits (IBI Scientific; IB47632) according to manufacturer guidelines. For Drosophila mRNA, flies were collected at 10 days post eclosion and flash frozen. Forty heads, mixed male and female, were removed and pooled per sample. Samples were homogenized and RNA was isolated using a Qiagen RNeasy kit. For qPCR assays, RNA was DNAse-treated and converted to cDNA using Quantitect Reverse-Transcription kit (Qiagen; 205311). qPCR reactions were performed using SYBR Select Master Mix (Thermo Scientific; 4472908). Final primer concentrations were 250 nM and Tm was 60 °C. Fluorescent emissions were detected using Bio-Rad CFX Connect qPCR instrument. Data were analyzed using ΔΔCT method. For representation of the data in figures, a Z-score was computed and heatmaps were generated with heatmapper.ca. qPCR primers are provided in Supplementary Material 16.
Lentiviral transduction of iPSCs with sgRNA constructsPooled sgRNAs were lentivirally packaged in HEK293T cells (ATCC; CRL-3216) as previously described [83] using TransIT Lenti Reagent (Mirus Bio; MIR 6600), and introduced into CRISPRi or CRISPRa iPSCs. Cells were selected with 1 µg/mL puromycin (Gibco; A11138-03) for 7 d after which cells were cultured for 2–4 d in the absence of puromycin to allow them to recover. sgRNA protospacer sequences are provided in Supplementary Material 16.
Statistics. All cell culture data are expressed as mean ± S.E.M. from 3 or more independent experiments, and the level of significance between 2 groups was assessed with Student’s t-test. For experiments consisting of more than 2 groups, one-way or two-way ANOVA followed by Holm-Sidak test was applied. A value of p < 0.05 was considered statistically significant.
AntibodiesAnti-10E4 mouse primary antibody (Amsbio; F58-10E4).
Anti-Amyloid mouse primary antibody (Millipore Sigma; MAB5206).
Anti-Amyloid mouse primary antibody (BioLegend; SIG-39320).
Anti-cleaved Dcp-1 antibody (Cell Signaling Technology; 9578).
Anti-Glypican 1 rabbit primary antibody (Abcam; EPR19285).
Anti-Glypican 2 rabbit primary antibody (Invitrogen; PA5-115299).
Anti-Glypican 3 mouse primary antibody (Invitrogen; MA5-17083).
Anti-Glypican 4 rabbit primary antibody (ProteinTech; 13048-1-AP).
Anti-Glypican 5 mouse primary antibody (R&D Systems; 297716).
Anti-Glypican 6 rabbit primary antibody (Bioss Antibodies; bs-2177R).
Anti-IBA1 rabbit primary antibody (Cell Signaling Technology; 17198).
Anti-IBA1 guinea pig primary antibody (Synaptic Systems; 234 308).
Anti-PU.1 rabbit primary antibody (Cell Signaling Technology; 2266).
Anti-Tau mouse primary antibody (CP13; gift from Peter Davies).
Anti-TMEM119 mouse primary antibody (BioLegend; 853301).
Alexa Fluor 488 donkey anti-chicken IgG secondary antibody (Jackson ImmunoResearch; 703-545-155).
Alexa Fluor 488 goat anti-guinea pig IgG secondary antibody (Invitrogen; A-11073).
Alexa Fluor 488 Plus goat anti-mouse IgG secondary antibody (Invitrogen; A32723).
Alexa Fluor 488 goat anti-mouse IgM secondary antibody (Invitrogen; A-21042).
Alexa Fluor 546 goat anti-rabbit IgG secondary antibody (Invitrogen; A-11035).
Alexa Fluor 647 goat anti-rabbit IgG secondary antibody (Invitrogen; A-21245).
Biotinylated horse anti-mouse IgG secondary antibody (Vector; BA-2000-1.5).
Cy3 donkey anti-rabbit IgG secondary antibody (Jackson ImmunoResearch; 711-165-152).
Cy3 donkey anti-rat IgG secondary antibody (Jackson ImmunoResearch; 712-165-153).
Cy5 donkey anti-goat IgG secondary antibody (Jackson ImmunoResearch; 705-175-147).
Cy5 donkey anti-rabbit IgG secondary antibody (Jackson ImmunoResearch; 711-175-152).
Fig. 1
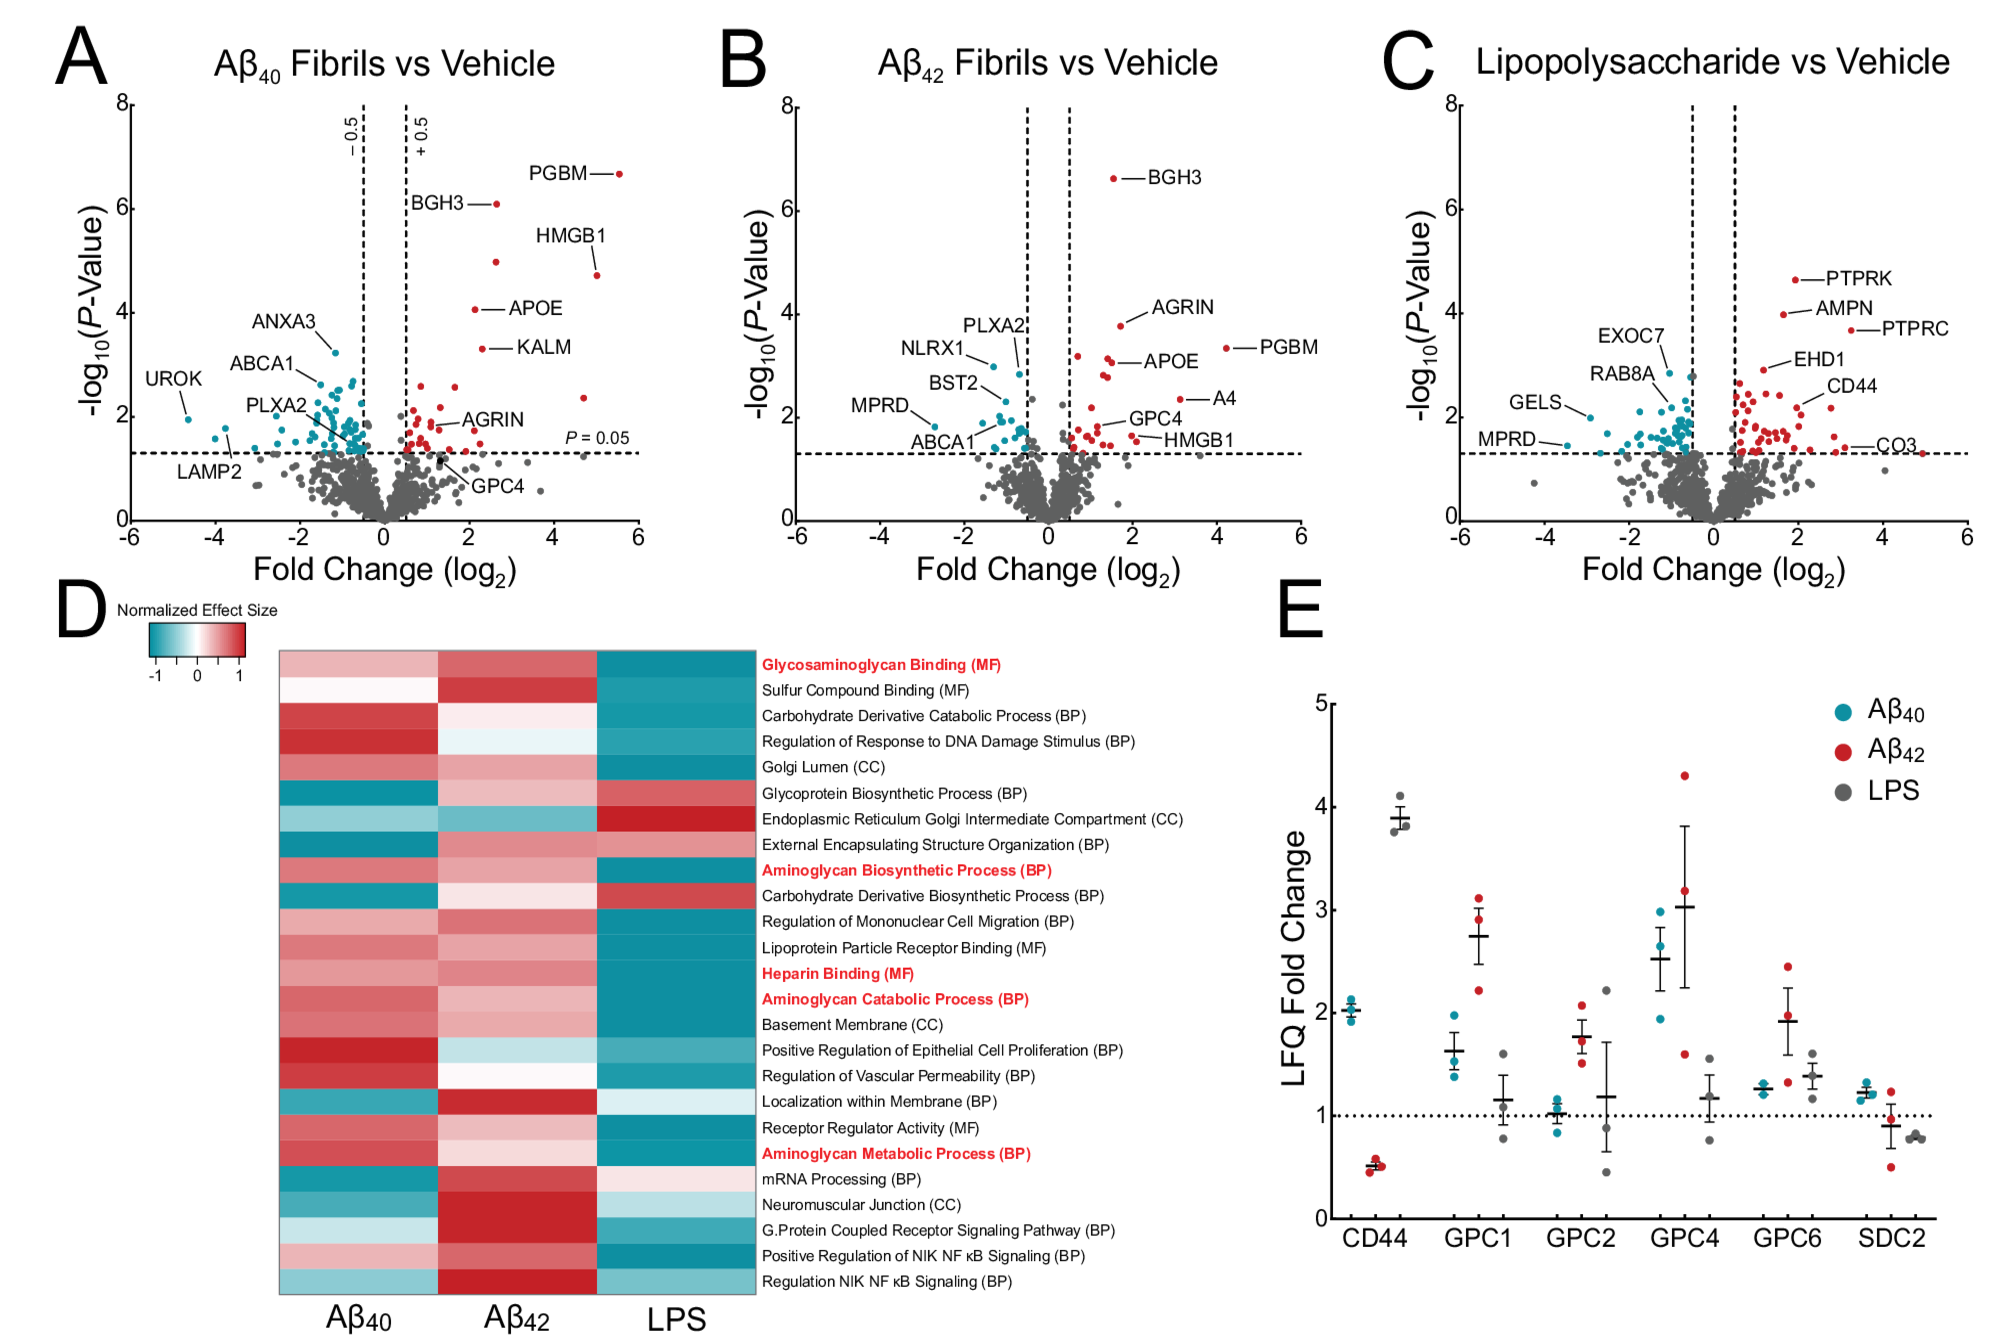
Surfaceomics of iTF Microglia reveal upregulation of glypicans. Volcano plots showing changes in surface proteins from iTF Microglia treated with (A) 1 µM Aβ40 fibrils, (B) 1 µM Aβ42 fibrils, or (C) 100 ng/mL LPS. The -log10 transformed p-value is plotted against the log2 transformed label-free quantitation ratios (log2 fold changes). N = 3–6 biological replicates. (D) Gene Set Enrichment Analysis of iTF Microglia treated with Aβ40 fibrils, Aβ42 fibrils, or LPS. The heatmap shows the normalized effect size of the top 25 most statistically altered pathways. Positive normalized effect size is shown in red (upregulation), and negative normalized effect size is shown in blue (downregulation). Gene Ontology terms highlighted in red font relate to glycosaminoglycan and proteoglycan biology. (E) Mass spectrometry label-free quantitation of cell surface heparan sulfate proteoglycans found in the surfaceomics experiments (A, B, C).
Fig. 2
Amyloids induce iTF Microglial cell surface heparan sulfate and GPC4 expression. iTF Microglia treated with (A) Aβ40 and (B) Aβ42 fibrils have dose-dependent increases in cell surface heparan sulfate as measured by flow cytometry with 10E4 antibody. (C) Other inflammatory substrates and controls do not alter cell surface heparan sulfate levels. The statistical analyses were performed with a one-way ANOVA. N = 3 biological replicates. Heparan sulfate cell surface staining with 10E4 on (D) HEK293T cells, (E) iPSCs, (F) iNeurons, (G) iAstrocytes, and (H) BV2 cells treated with 1 µM Aβ40 and Aβ42 fibrils. The statistical analyses were performed with a one-way ANOVA and Holm-Sidak multiple comparisons tests for the adjusted p-values. N = 3 biological replicates. (I) GPC4 immunocytochemistry of iTF Microglia treated with 1 µM Aβ40 or Aβ42 fibrils. Scale bar = 10 μm. GPC4 flow cytometry quantification of (J) iTF Microglia or (K) iAstrocytes treated with 1 µM proteopathic amyloid fibrils. The statistical analyses were performed with a one-way ANOVA and Holm-Sidak multiple comparisons tests for the adjusted p-values. N = 3 biological replicates. In all graphs, the data represent the means ± SEM.
Fig. 3
Comments (0)