
Remember me

HEK293-EBNA cells (Invitrogen, R620-07) were transfected with a pCEP-Pu containing proCTSB or proCTSL as described previously [16, 47] utilizing polyethyleneimine (PEI; Polysciences, 24765) in a 1:3 DNA to PEI ratio. After 48 h, expressing cells were selected with 0.25 mg/mL G-418 (Thermo Fisher Scientific, 11881-023) and 1 µg/µL puromycin for 3 weeks. Further, a high-expressing clone was selected by serial dilution. Cells were maintained in Dulbecco’s modified Eagle medium (DMEM; Life Technologies, 41965) containing 4 mM L-glutamine and 4.5 g/L glucose and supplemented with 10% fetal calf serum (FCS), 1% PenStrep (Sigma, P0781), 0.25 mg/mL G-418 and 1 µg/µL puromycin in a humidified 5% CO2 atmosphere at 37 °C.
Recombinant CTSB and CTSL production and purificationHuman recombinant proCTSB and proCTSL were produced as described previously [16, 47]. In brief, 4 × 10⁶ HEK293-EBNA cells stably overexpressing proCTSB or proCTSL were seeded in five 175 cm2 flasks with 35 mL of DMEM containing 4 mM L-glutamine and 4.5 g/L glucose and supplemented with 10% fetal calf serum (FCS), 1% PenStrep, 0.25 mg/mL G-418 and 1 µg/µL puromycin. At a cell density of 80%, the medium was replaced by 100 mL of DMEM supplemented with 2.5% FCS and 1% PenStrep per flask. One week after, the medium was harvested and vacuum-filtered (0.22 μm; Fisher Scientific, FB12566510). An Amicon system and ultracentrifugation disk (10MWCO; Millipore, PLGC07610) were used to concentrate the medium to a final volume of 50 mL. The recombinant enzymes were purified by binding its N-terminal His-tag to a HisTrap 1 mL column (GE Healthcare, 29-0510-21) on an ÄKTA pure™ 25 protein purification system (Cytiva) followed by elution with 250 mM imidazole (Millipore, 104716) in phosphate-buffered saline (PBS: 137 mM NaCl, 2.7 mM KCl, 0.8 mM Na2HPO4, 1.5 mM KH2PO4, pH 7.4) or via gravity-flow using Ni-NTA agarose beads (Macherey-Nagel, 745400.100). Size-exclusion chromatography was performed as a second purification step via a Superdex 75 column (GE Healthcare, GE17-5174-01). Enzyme purity was checked by SDS-PAGE, and the fractions containing monomeric rHsCTSB or rHsCTSL were pooled and concentrated using a Vivaspin 20 (10MWCO; Sartorious, VS2002).
Production of recombinant SNCAHuman SNCA was expressed in in E. coli BL21 (DE3) pLysS competent cells (Novagen) using a human α-syn PT7-7 construct (a gift from Dr. Hilal Lashuel, Addgene plasmid #36046; RRID: Addgene_3604636). Purification of SNCA was performed as previously described [48]. Monomeric SNCA was purified using a SuperdexTM 75 10/300 size exclusion column and an Äkta pure™ protein purification system (Cytiva) in a running buffer of 50 mM Tris/HCl, pH 7.4 with 150 mM NaCl.
H4 cell cultureHuman H4 neuroglioma cells with tetracycline-inducible overexpression of wild-type SNCA (tet-off system) were previously characterized by Mazzulli et al. [35]. Cells were cultured in OptiMEM medium (Thermo Fisher Scientific, 31985070) supplemented with 5% tetracycline-free FCS (PAN-Biotech, P30-3602), 200 µg/mL Geneticin (Thermo Fisher Scientific, 10121035), 200 µg/mL Hygromycin (Thermo Fisher Scientific, 10687010), and 1% penicillin/streptomycin. For experiments, H4 cells were plated in 6-well plates at a density of 2 × 10⁵ cells per well for Western blot analysis or 1.2 × 10⁵ cells per well on 12-mm coverslips for immunofluorescence (IF). The following day, recombinant human CTSB (rHsCTSB), recombinant human CTSL (rHsCTSL), or a combination of both proteases (20 µg/mL) was added to the culture medium. Cells were then incubated for 24, 48, or 72 h prior to harvesting.
To inhibit lysosomal acidification, 200 nM Bafilomycin was added alongside the recombinant enzymes for the specified durations mentioned above.
Generation of CTSB-and CTSL deficient H4 cellsCTSB or CTSL knockout cells were established by CRISPR-Cas9 following the previously published protocol by Bunk et al. [49]. Briefly, ribonucleoprotein (RNP), complexes of CTSB or CTSL multi RNA guides and Cas9 protein were assembled as per the manufacturer’s instructions (Gene Knockout Kit v2; Synthego) to transfect H4 cells via the Neon Transfection System. The multi RNA guides used in this study target exon 3 of the CTSB gene and exon 5 of CTSL gene. CTSB: Guide RNA (gRNA) 1: 5’ -C*C*C*ACAGCCUACCUGCCACG- 3’, gRNA 2: 5’ – A*U*G*GAAAGAGGGCCUGCUCC- 3’, gRNA 3: 5’ -U*U*C*CAACAUGUGGCAGCUCU- 3’. CTSL: gRNA 1: 1: 5’ -A*G*A*UAAGCCUCCCAGUUUUC- 3’, gRNA 2: 5’ – A*G*G*CUGCAAUGGUGGCCUAA- 3’, gRNA 3: 5’ -U*U*C*UGUUGCCUCAUAUGGAU- 3’ Single CTSB or CTSL KO cells were grown and expanded for the verification of successful editing efficiency by Western blot analysis and Sanger sequencing of both, CTSB exon 3 and CTSL exon 5.
Clone 7 was used for further analyses in this study. Cells were maintained as described in the section “H4 cell culture”.
iPSC culture and neuronal differentiationHuman induced pluripotent stem cells (iPSCs) derived from Parkinson’s disease (PD) patients expressing the SNCA A53T mutation and the matched isogenic corrected line were kindly provided by Dr. R. Jaenisch (Whitehead Institute, MIT) and thoroughly characterized in previous work by Soldner et al. [50]. iPSCs were cultured on Matrigel-coated plates (Corning, 354234) using mTeSR1 (Stemcell, 85850) or mTeSR Plus medium (Stemcell, 100–0276) and differentiated into dopaminergic (DA) neurons following a well-established protocol [51]. Between days 25 and 30 of differentiation, neurons were plated onto 24-well plates coated with poly-D-lysine (Merck, P1149) and laminin (Merck, 11243217001) at a density of 3 × 10⁵ cells per well for immunofluorescence or 4 × 10⁵ cells per well on 12-mm coverslips for Western blot analysis. Neurons were maintained in Neurobasal medium (Thermo Fisher Scientific, 21103049) supplemented with NeuroCult SM1 Neuronal Supplement (Stemcell, 05711) and 1% penicillin-streptomycin until day 90. At day 60, neurons were treated with 10 µg/mL of recombinant human CTSB (rHsCTSB) or CTSL (rHsCTSL), with treatments replenished every other day in conjunction with media replacement over a period of 21–25 days.
AnimalsCtsd knockout animalsAnimal handling and care were performed in agreement with the German animal welfare law. Animal experiments were approved by the Ministry of Energy, Agriculture, the Environment and Rural Areas Schleswig-Holstein under the reference number V242–40,536/2016 (81–6/16). Ctsd knockout animals (Ctsd KO; Ctsd−/−) mice were bred from heterozygous matings and genotyped as previously described [52].
Animals were housed in individually ventilated cages under a 12-hour light/dark cycle with unrestricted access to food and water. The housing conditions were maintained at a temperature of 19–22 °C with 45–60% relative humidity. Genotyping of mice was performed on postnatal day 0 (P0). CTSD wild-type (Ctsd WT; Ctsd+/+) and CTSD knockout (Ctsd-/-) mice were selected for intracranial injections. Two doses were administered: the first at P1 and the second at P19. Each injection involved 10 µL of either PBS, recombinant human CTSB (rHsCTSB), or recombinant human CTSL (rHsCTSL), containing 100 µg of enzyme, delivered using a 30G micro-syringe equipped with a spacing device for a precise injection depth of 1.15 mm over 3 min.
At P1, the injection was targeted to the caudal putamen of the right hemisphere, while the P19 injection was directed to the left hemisphere. All mice were sacrificed at P23, which was chosen as the humane endpoint for untreated Ctsd KO mice. Following sacrifice, brains were collected, with the left hemisphere reserved for Western blot analysis and the right hemisphere used for immunofluorescence (IF).
For IF, brains were fixed in 4% paraformaldehyde (PFA) for 4 h at rt, then washed in PBS overnight at 4 °C. Subsequently, brains were immersed in a 30% sucrose solution prepared in PBS. Sagittal sections of 35 μm thickness were obtained using a Leica SM 2000 R sliding microtome (Leica Microsystems) with dry-ice cooling. Sections were stored in PBS containing 0.02% (w/v) sodium azide until further analysis.
Thy1-SNCA animalsAnimal breeding, husbandry and use of the Thy1-mice were reviewed and approved by the Government of Lower Franconia, Bavaria, Germany (RUF-55.2.2-2532-2-1489).
The breeding involved heterozygous females with wildtype males of the B6D2F1 line from Charles River on a hybrid background (C57BL/6 x DBA/21F).
All animals were housed in individually ventilated cages under a 12-hour light/12-hour dark cycle, with ad libitum access to food and water. Mice were genotyped at postnatal day 0 or 1 (for primary neuronal culture) or 10 (for organotypic brain slices).
Generation of organotypic brain slicesOrganotypic brain slices were prepared from postnatal day 10 old Thy1 mice (female and male animals).
Cortical slice cultures: For organotypic slice culture, 300 μm thick coronal slices were generated from forebrains of 10 days old Thy1 transgenic (tg) mice at the level of the body of the corpus callosum using a Leica VT1000S vibratome. Slices were placed on 0.4 μm Millicell-CM™ organotypic cell culture inserts (Merck-Millipore, PICM0RG50) in a 6-well plate and incubated in 1 mL culture medium containing 50% MEM (Gibco, 32360-026), 25% EBSS (Sigma, E6267), 25% heat-inactivated horse serum (Gibco, 26050-088), 1x Penicillin/Streptomycin (Anprotec, AC-AB-0024), 1x GlutaMAX (Gibco, 35050-061), 25 mM HEPES (Gibco, 15630-080), and 6.5 mg/mL D-glucose (Sigma, G8769). The medium was replaced every other day for 7 days. After 7 days of culturing, organotypic brain slices were transferred into culture medium supplemented with either 20 µg/mL rHsCTSB or rHsCTSL, including medium changes every second day for another 14 days. At day 21, the slices were fixed in 4% PFA for 20 min at room temperature (rt) and stored in PBS at 4 °C prior to IF staining.
Primary neuronal culturePrimary cortical neurons were cultured from postnatal day 0 or 1 old Thy1 mice (female and male animals). Cortices from Thy1 mouse brains were dissected and placed in cold HBSS (ThermoFisher, 14175095). After removing HBSS, cortices were washed with fresh HBSS and then incubated in Papain-Protease-DNase solution (PPD mix), containing HBSS, 0.01% Papain (Worthington, LK003176), 0.1% Dispase II (Roche, 04942078001), 0.01% DNAse I (Worthington, LS0002139), and 12.4 mM MgSO4 at 37 °C and triturated thrice, at 10 min intervals. The resultant cell suspension was then passed through a 70 μm cell strainer and centrifuged at 300 x g for 3 min at rt. The resultant cell pellet was resuspended in ‘NBA media’ consisting of Neurobasal A medium (Gibco,12349-015), 0.2 mM Glutamax (Gibco,35050-038), 2% B27 (Gibco,17504-044), 0.1 M NaPyr (Gibco,11360-070), and 0.1 M Anti/Anti (Gibco, 15240-062), and centrifuged again (500 x g, 5 min, rt) twice more, with supernatant removal each time. After the final wash, cells were resuspended in 1 mL NBA mix and seeded onto 24-well plates containing coverslips pre-coated with poly-D-Lysine, at a density of 2 × 10⁵ cells per well. After 7 days in vitro (DIV7), half media changes were performed by removing half the volume of conditioned media and replenishing with fresh, pre-warmed NBA mix media. Primary neurons were treated with 20 µg/mL rHsCTSB or rHsCTSL on DIV10 and DIV12. Media was collected for performing LDH assay both prior to treatment at DIV 9 and after treatment DIV 14, respectively. Cells were harvested for ELISA and activity assays and fixed for IF analysis at DIV 15.
LDH cytotoxicity assayThe release of lactate dehydrogenase (LDH) into the cell culture media is an indicator for damaged cells. To determine possible cytotoxic effects of rHsCTSB or rHsCTSL treated cells, the Pierce LDH Cytotoxicity Assay Kit (Thermo Fisher Scientific, 88953) was used. In short, 50 µL of sample media were collected from rHsCTSB or rHsCTSL-treated cells, transferred to a 96-well flat bottom plate (Greiner, 655083) in triplicate wells and mixed with 50 µL of reaction mixture. Following incubation for 30 min at rt, 50 µL of stop solution was added into each well. The positive control provided by the kit was used. LDH activity was measured with a CLARIOstar microplate reader (BMG Labtech) at the absorption wavelengths 490 nm and 680 nm.
Live-cell lysosomal CTSB, CTSL, and GCase activity assayH4 cells were seeded on a dark 96-well plate with clear bottom (Corning, 3603) at a cell density of 5 × 10⁴ cells per well. The next day, cells were treated with 20 µg/mL of rHsCTSB or rHsCTSBL for 24, 48 and 72 h. The cells were then treated with 200 nM Bafilomycin A1 (BafA1) or DMSO for 1 h at 37 °C. After washing with media, substrates for CTSB (Biorad; #ICT938), CTSL (BioRad; #ICT942), or GCase (PFB-FDGluc; Thermo Fisher Scientific, P11947) [34, 53] was incubated for 1 h at 37 °C. Afterwards, cell culture media was replaced by phenol red-free Opti-MEM (GIBCO, #11058-021) and the fluorescence intensity was measured every 30 min for 3 h by a CLARIOstar microplate reader (BMG Labtech), at excitation of 592 nm and emission of 628 nm (for CTSB and CTSL) and at 485 nm and emission of 530 nm (for GCase). After the final reading, cells were fixed in 4% PFA for 20 min, permeabilized with 0.3% Triton X-100 for 30 min, and blocked in Intercept TBS blocking buffer (Li-Cor, 927–60001) for 1 h at rt. Next, Celltag700 (Li-Cor, 926–41090) was diluted 1:500 in Intercept TBS blocking buffer with 0.1% Tween 20 and added to the cells for 1 h at rt. The plate was then washed three times with PBS and scanned using an Odyssey imaging system (Li-Cor Biosciences, Lincoln, NE, USA). For quantification, ImageStudioLite 5.2 (Li-Cor Biosciences, Lincoln, NE, USA) was used. Analysis was carried out as follows: the fluorescence intensity of the enzymatic substrate was normalized to the Cell number (CellTag700) and graphed as fluorescence intensity (y-axis) and time (x-axis). Total CTSB, CTSL, or GCase activity was calculated by the area under the curve (AUC) of DMSO and the lysosomal activity was determined by subtracting AUC of DMSO vs. BafA1. The results of the lysosomal enzyme activity measurement are depicted as bar graphs ± SEM.
Lysate CTSB, CTSL and GCase activity assaysTo measure CTSB or CTSL activity, cell pellets were freshly lysed in Triton X-100-based acidic buffer (50 mM sodium acetate, 0.1 M NaCl, 1mM EDTA, 0.2% Triton X-100, pH 4.5). 5 µg of cell lysate was incubated in 100 µL Triton X-100-based acidic buffer containing 20 µM quenched fluorogenic peptide (Enzo, #BML-P139-0010) for CTSB and 9.4 µM (BioRad; #ICT942) of fluorescent probe for CTSL for 30 min at 37 °C. To measure GCase activity, cell pellets were lysed in Triton-based buffer − 1% Triton X-100, 10% glycerol, 150 mM NaCl, 25 mM HEPES pH 7.4, 1 mM EDTA, 1.5 mM MgCl2 containing 1 mM PMSF, 2 mM NaVO3, 50 mM NaF and 1X protease inhibitor cocktail (PIC), and 1X phosphostop (Roche Diagnostics GmbH, 4906837001). 5 µg of cell lysate was incubated in 100 µL of GCase activity buffer − 0.15 M phosphate/citrate buffer, 0.25% sodium taurocholate (Sigma-Aldrich, St. Louis, MO, United States, #T9034), 0.25% v/v Triton X‐100 – and 1 µM of the GCase substrate 4‐methylumbelliferyl‐β‐D‐glucopyranoside (4MU, Merck Millipore, Billerica, MA, United States, #M3633). After incubation for 30 min at 37 °C, the reaction was stopped using 100 µL stop solution (0.1 M glycine, pH 10.4). Enzyme activities were measured using SpectraMax Gemini (Molecular Devices, San José, CA, United States) or ClarioStar (BMG LABTECH, Ortenberg, Germany) plate-readers at at excitation: 365 nm and emission: 440 nm for CTSB, excitation: 590 nm and emission: 628 nm for CTSL, and excitation: 365 nm and emission: 445 nm for GCase. All values were corrected for background fluorescence.
Sequential protein extraction protocols 1.Our primary solubility assay, generating Triton soluble (T-sol) and Triton-insoluble (T-insol)/ SDS-sol fractions, was performed as previously described [54]. H4, iPS-derived dopaminergic neurons (DA-iPSn), or frozen whole brain tissue were lysed in a Triton-based buffer (1% Triton-X100, 10% glycerol, 150 mM NaCl, 25 mM HEPES pH 7.4, 1 mM EDTA, 1.5 mM MgCl2) containing 1 mM PMSF, 2 mM NaVO3, 50 mM NaF and 1X protease inhibitor cocktail (PIC), and 1X phosphostop (Roche Diagnostics GmbH, 4906837001) by incubation on ice-water slurry for 30 min to obtain the T-sol fraction from the supernatant. Following three cycles of freezing (-80°C) and thawing (37°C), the samples were ultracentrifuged at 100,000 x g, 4 °C for 30 min. T-insol/ SDS-sol fraction was generated by lysing the residual pellet in 50 mM Tris, pH 7.4 buffer containing 2% SDS and 1X PIC by boiling at 99 °C for 10 min, sonicating three times and ultracentrifuged at 100,000 x g, 22 °C for 30 min. Protein concentrations of the T-sol and T-insol fractions were determined using a BCA assay kit (Thermo Fisher Scientific, 23225) according to manufacturer’s instructions.
2.Additionally, an alternative sequential extraction protocol based on solubility of SNCA in RIPA buffer and urea/SDS was performed as described previously [55]. Pellets from iPS-derived dopaminergic neurons (DA-iPSn) were homogenized in TBS (50mM Tris, pH7.4, 175mM NaCl, 5mM EDTA) buffer containing 1% Triton X-100 and freshly added − 1 mM PMSF, 2 mM NaVO3, 50 mM NaF, 1X protease inhibitor cocktail (PIC), and 1X phosphostop (Roche Diagnostics GmbH, 4906837001), by incubation on ice water slurry for 30 min. After three cycles of freezing and thawing, the samples were ultracentrifuged at 100,000 g, 4 °C for 1 h to obtain the TBS/Triton soluble (TBS/Triton-sol) fraction. The pellet obtained was then resuspended in radioimmunoprecipitation assay (RIPA) lysis buffer (50 mM Tris/HCl pH 8.0, 150 mM NaCl, 5 mM EDTA, 1% NP-40, 0.5% sodium deoxycholate) containing 0.1% SDS, and freshly added 1X protease inhibitor cocktail (PIC), and 1X phosphostop and then ultracentrifuged at 100,000 g, 4 °C for 1 h to obtain the RIPA-soluble (RIPA-sol) fraction. The pellet obtained was then resuspended in 8 M Urea/5% SDS to obtain the urea/SDS fraction.
Western blot analysisT-sol and T-insol lysates (40 µg protein for H4 cells and 30–40 µg protein for DA-iPSn) were denatured with 5X Laemmli buffer were mixed with 5X Laemmli buffer (0.3 M Tris-HCl, pH 6.8, 10% w: v SDS, 50% v: v glycerol, 5% v: v ß-mercaptoethanol, 5% w: v bromophenol blue) at a ratio of 1 part 5X Laemmli buffer to 4 parts sample and boiled for 5 min at 95 °C. Samples were run by electrophoresis on 12% SDS-PAGE gels at 125 V. Subsequently, proteins were transferred onto PVDF membranes (Millipore, IPFL00010) at a constant voltage of 30 V for 1 h. The membranes were fixed in 0.4% paraformaldehyde for 20 min, blocked in Intercept blocking buffer (Li-Cor, 927-60001) for 1 h and incubated overnight with primary antibodies in the appropriate antibody diluent (Li-Cor, 927-65001). The membranes were washed with TBS-Tween 20 (0.1%) and incubated with secondary fluorescent-conjugated antibodies for 1 h at rt. Detailed information about all applied primary and secondary antibodies for western blotting can be found in Table 1. Detection of the blots was performed by using the Amersham Typhoon Biomolecular Imager (GE Lifesciences) or Odyssey (LI-COR Biosciences, Lincoln, NE, USA) imaging systems. CBB-stained SDS-PAGE gels were used to check protein loading.
Table 1 Details of the primary and secondary antibodies used for Western blottingEnzyme-linked-immunosorbent assay (ELISA)Aggregated SNCA and total human SNCA in DA-iPSn and primary neurons from the Thy1-SNCA was detected and quantified using an SNCA aggregate ELISA kit (BioLegend, 449407) and total human SNCA kit (BioLegend, 448607) respectively, following the manufacturer’s protocol. For this, total lysate was generated by lysing the cell pellets in 50 µL of Triton-based buffer (1% Triton-X100, 10% glycerol, 150 mM NaCl, 25 mM HEPES pH 7.4, 1 mM EDTA, 1.5 mM MgCl2) supplemented with 1X PIC and 1X phosphostop. The lysates were incubated on an ice-water slurry for 30 min and subjected to three cycles of freezing and thawing. Subsequently, the samples were centrifuged at 12,000 x g for 15 min, and the supernatant was collected. Protein concentration was determined using a BCA assay, and 30 µg of protein from the lysates was used for the aggregated SNCA detection ELISA assay and 0.1 µg of protein was used for the total human SNCA ELISA assay. Absorbance was measured within 15 min using a CLARIOstar microplate reader (BMG Labtech) at 450 nm and 570 nm.
In vitro digestion of SNCAThe preparation and characterization of SNCA fibrils from purified monomeric human recombinant SNCA were carried out as described previously [56]. Monomeric SNCA was diluted to 1 µg/µL with Tris/HCl buffer (0.1 M, pH 7.4) in a reaction tube (1.5 mL) in the presence of a 3 mm polytetrafluoroethylene (PTFE) bead (Polysciences, #17649-100). The reaction tube was shaken (Eppendorf Thermomixer Compact 5350, Hamburg, Germany) at 37 °C and 1000 rpm for 3 days. SNCA fibril generation was validated using ThioflavinT (ThioT) assay. For this, 10 µL of each sample was transferred into a 96-well plate (Black Microwell SH, Thermo Scientific #437111) and mixed with 10 µM of ThioT solution for a total volume of 100 µL in Tris/HCl buffer (0.1 M, pH 7.4). Samples were measured in triplicates using a SpectraMax Gemini EM (Molecular Devices, San Jose, USA) at 410 nm excitation and 475 nm emission.
For the digestion, 2 µg SNCA (monomers or fibrils; final concentration: 3.5 µM) were added to 30 µL Triton X-100-based buffer (50 mM sodium acetate, 0.1 M NaCl, 1mM EDTA, 0.2% Triton X-100, pH 4.5) alongside 0.44 µg of rHsCTSB (final concentration: 0.3 µM), 0.34 µg of rHsCTSL (final concentration: 0.3 µM) or a combination of rHsCTSB and rHsCTSL together (final concentration: 0.3µM for each cathepsin). The mixture was incubated at 37 °C for 0.25 h, 0.5 h, 1 h, 2 h, 4 h, 8 h, 24 h, 48–72 h before terminating the reaction by adding denaturing 1X Laemmli buffer and heating the samples to 95 °C for 5 min. As undigested controls, reaction mixtures without rHsCTSB or rHsCTSL in the Triton X-100-based buffer were prepared in the similar manner. The samples were separated on a 15% Tris-Glycine gels via SDS-PAGE and analyzed using CBB staining.
ImmunofluorescenceH4 cells or DA-iPSn, or primary neurons from Thy1-SNCA model, were fixed with 4% PFA for 20 min at rt, followed by permeabilization with 0.3% Triton X-100 in PBS for 30 min. To prevent nonspecific binding, cells were blocked for 1 h at rt in a solution containing 2% BSA and 5% FCS in PBS with Triton X-100. Primary antibodies were prepared in the blocking buffer and applied to the cells for overnight incubation at 4 °C. After washing with PBS containing Triton X-100, cells were treated with secondary antibodies diluted 1:500 in blocking buffer and incubated at rt for 1 h.
Sagittal slices from mouse brain were permeabilized with 0.3% Triton X-100 in PBS for 30 min, blocked in 3% BSA in PBS-Triton X-100 and incubated overnight at 4 °C with primary antibodies. Secondary antibodies were prepared at a 1:300 dilution in blocking buffer.
Cortical brain slices were permeabilized and blocked for 3 h at rt in solution containing 10% FCS, 1% BSA, and 0.5% Triton X-100 in PBS. Primary antibodies, diluted in the blocking buffer, were applied and incubated overnight for 4 days at 4 °C.
The following day, the slices were washed six times for 20 min each with PBS containing 0.05% Triton X-100 at rt. Secondary antibodies, diluted in blocking solution, were subsequently applied to the slices and incubated for another 4 days at 4°C. Detailed information on the primary and secondary antibodies can be found in Table 2.
Cells and brain slices were mounted either directly onto slides utilizing DAPI-Fluoromount G (SouthernBiotech, 0100 − 20) or pre-incubated with DAPI (Sigma, D8417) diluted 1:10,000 in PBS for 10 min at rt, following three washing steps with PBS. Slices were mounted with ProLong™ Gold antifade reagent. Mounted cells or slices were imaged with a confocal laser scanning microscope (IX83, Olympus or LSM 780, Carl Zeiss Microscopy GmbH).
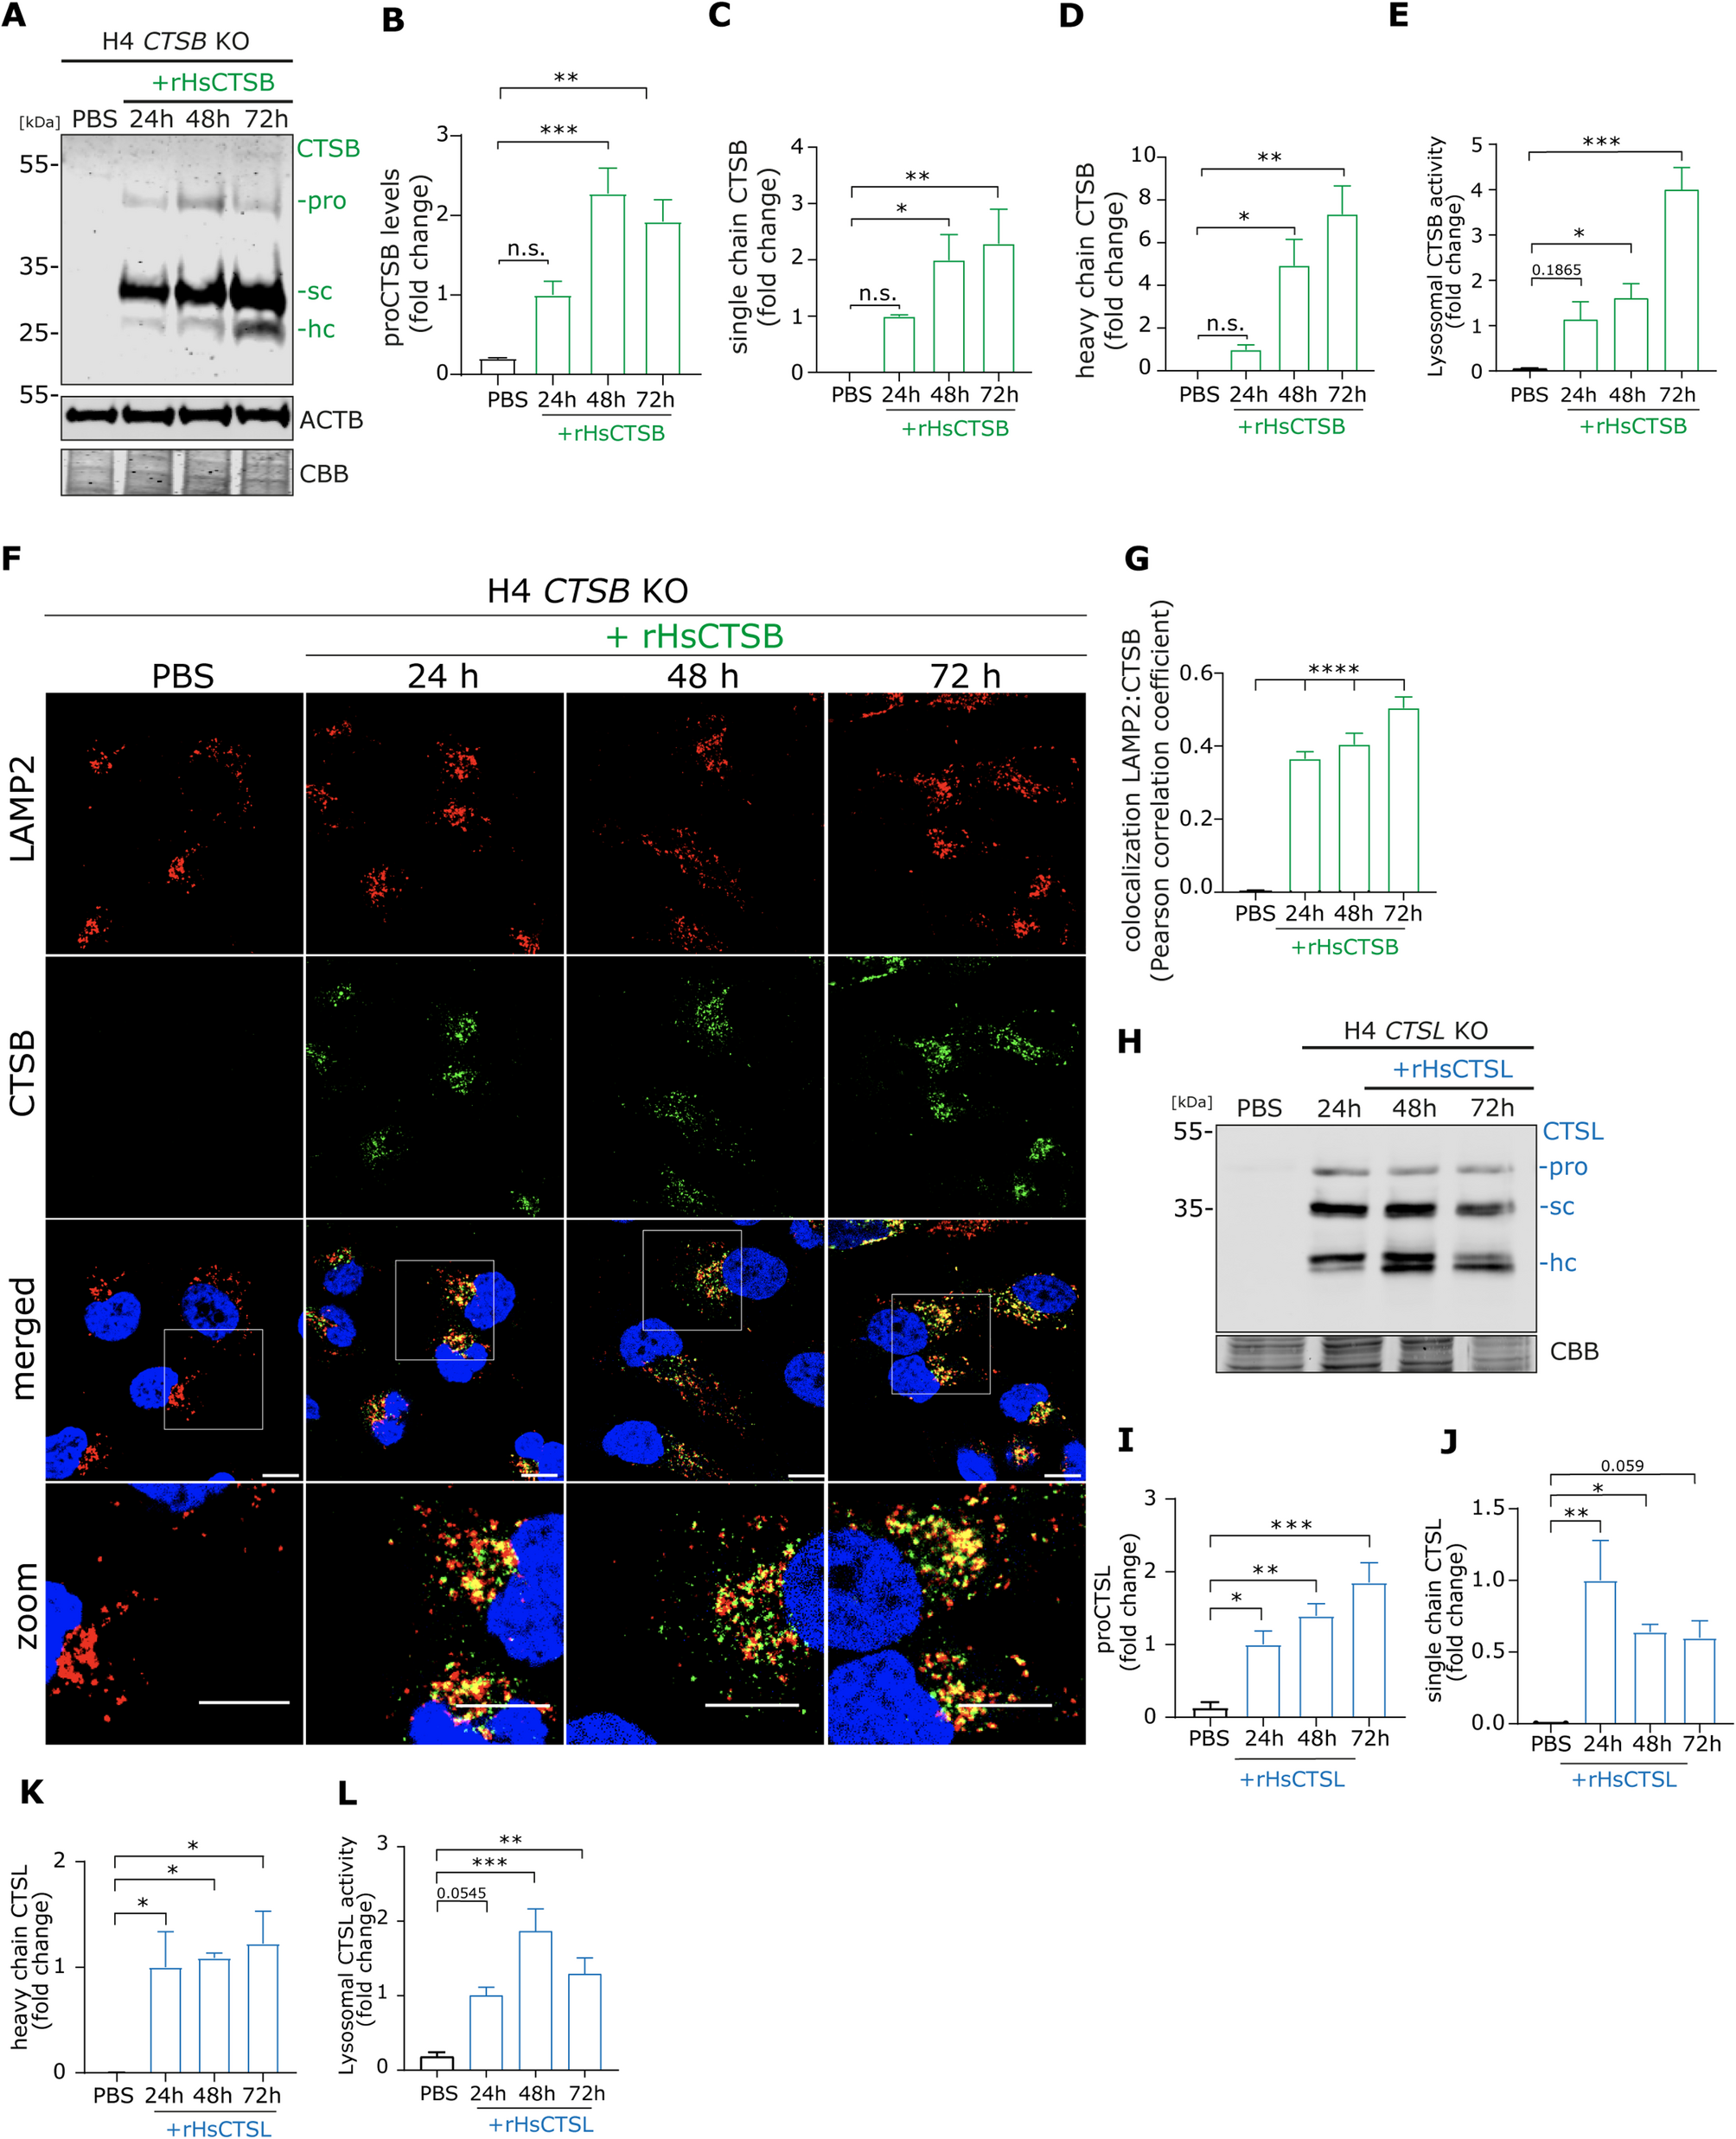
ImageJ sofware was used to analyse all IF images, with uniform adjustments applied to enable direct comparisons. To analyse colocalization, H4 cells were identified within a region of interest and colocalization of two stainings (LAMP2/CTSB) was assessed using the Pearson correlation coefficient [57]. Colocalization is indicated by positive values which describe a positive correlation between both stainings.
The levels for SNCA in the different cellular models (here: LB509, pSer129, or MJFR 14-6-4-2) were assessed by quantifying the fluorescence intensity signal within a defined region of interest. Analysis of SNCA aggregates in the Ctsd KO mouse brain was performed semi-automatically by thresholding to a similar fluorescence intensity threshold to measure their length (µm). Each aggregate was then measured manually by drawing a straight line from top to bottom. A region of interest was subsequently delineated around each aggregate to quantify SNCA fluorescence intensity. For the mouse tissue, the analysis of MJFR 14-6-4-2-positive vesicles was conducted using a methodology similar to that employed for SNCA aggregates. Vesicle size was determined by applying a consistent fluorescence intensity threshold for quantification and length measurement. The neurite or neuronal structures containing MJFR 14-6-4-2-positive vesicles were measured for their total length. To account for structural variations, the total number of MJFR 14-6-4-2-positive vesicles was normalized to the length of the analyzed neuronal structure.
Table 2 Detailed information about primary and secondary antibodies utilized in ImmunoflourescenceStructured illumination microscopy (SIM)For the visualization of Synapsin-1 (SYN-1) and SNCA in primary neurons, SIM imaging was used. Imaging was performed using a Zeiss Elyra 7 system equipped with ZEN software and applying the SIM2 algorithm. Samples were visualized with a 63x/1.40 NA oil immersion Plan-Apochromat objective, using laser exctiations at 488 nm and 561 nm. Fluoresence signals were collected over 13 phase shifts and captured on a PCO Edge 4.2 M sCMOS camera passing appropriate emission filters. SIM image reconstruction was performed in ZEN Black software (Carl Zeiss Microscopy GmbH, Jena, Germany). Chromatic aberration was corrected using affine transformations derived from z-stacks of Tetraspeck beads (Invitrogen). Final adjustments to image brightness and contrast were made in FIJI, using linear scaling [58].
Statistical analysisAll statistical analyses were performed using GraphPad Prism version 8 (Graph Pad Software, Inc., San Diego, USA). Data were analyzed by one-way analysis of variance (ANOVA) followed by Dunnett’s or Tukey’s post hoc for multiple comparisons or by two-sided, unpaired Student’s t-test for two groups comparisons as indicated in the figure legends. If not stated otherwise, data are expressed as mean ± SEM, p < 0.05 as considered statistically significant.
Comments (0)