
Remember me


A total of 128 patients were included in the study (Table 1). The mean age at diagnosis of LN was 14.4 years (standard deviation [SD], 4.37 years) with a female-to-male ratio of 13.2:1. The mean interval between the diagnosis of SLE and the diagnosis of LN was 0.3 year, with 112 (88%) presenting with LN at the onset of SLE. The mean interval between the onset of LN symptoms and formal diagnosis was 2.1 months (range, 0.0-23.9 months).
Table 1 Patient demographicsAt the time of LN diagnosis, the most common associated SLE manifestations were mucocutaneous signs and symptoms (80%), fever (71%), edema (56%), and arthralgia (54%). Among the clinical syndromes, nephrotic syndrome (69%) was the most common. The most common laboratory abnormalities included proteinuria (98%), anemia (83%), hematuria (75%), pyuria (72%), and cellular casts in the urine (59%) as seen on Table 2.
Table 2 Clinical and laboratory characteristics at diagnosisKidney biopsy was not performed in the majority of patients, primarily due to financial constraints. Only 16% of the total cohort underwent kidney biopsy. The mean interval between onset of LN to performance of kidney biopsy was 13 months. Class III (38%) was the most common frequently observed histopathological class (Table 3).
Treatment and associated adverse eventsInduction therapy consisted of a combination of glucocorticoids and a DMARD, specifically intravenous (IV) CYC using the modified National Institutes of Health protocol, MMF, or AZA (Table 4). The majority of patients received a combination of high-dose oral and IV pulse glucocorticoids. In addition to glucocorticoids, approximately equal proportions of patients were treated with IV CYC (33%) and MMF (32%) while only 2% received AZA. Among patients initially started on IV CYC, three were subsequently changed to MMF (two due to resistance, and one due to concerns about infertility). Conversely, six patients initially started on MMF were changed to IV CYC (three due to treatment resistance and three due to financial constraints).
The most frequently used maintenance therapies were MMF (46%) and IV CYC (38%). The other agents used were AZA and Cyclosporine. The mean duration of maintenance therapy at follow up was 1.8 years. Hydroxychloroquine and Enalapril were administered as adjunctive therapies in the majority of patients, with usage rates of 88% and 73% respectively (Table 4).
60% of patients experienced a delay in therapy. Identified reasons for these delays include the lack of available hospital beds for elective admissions and financial constraints. Additionally, 38% were poorly compliant with treatment, predominantly due to financial difficulties.
The most common treatment-associated adverse events were Cushingoid facies (53%), invasive infection (44%), and hospitalization (30%).
Table 4 Treatment and associated adverse eventsA significantly higher proportion of patients treated exclusively with glucocorticoids and IV CYC throughout induction phase, without combination or changing to another DMARD, experienced infection (p = 0.008) and hospitalization (p = 0.022) compared to those treated exclusively with glucocorticoids and MMF (Table 5). There was insufficient evidence to demonstrate a significant difference between the two treatment groups with respect to other identified adverse events and clinical outcomes.
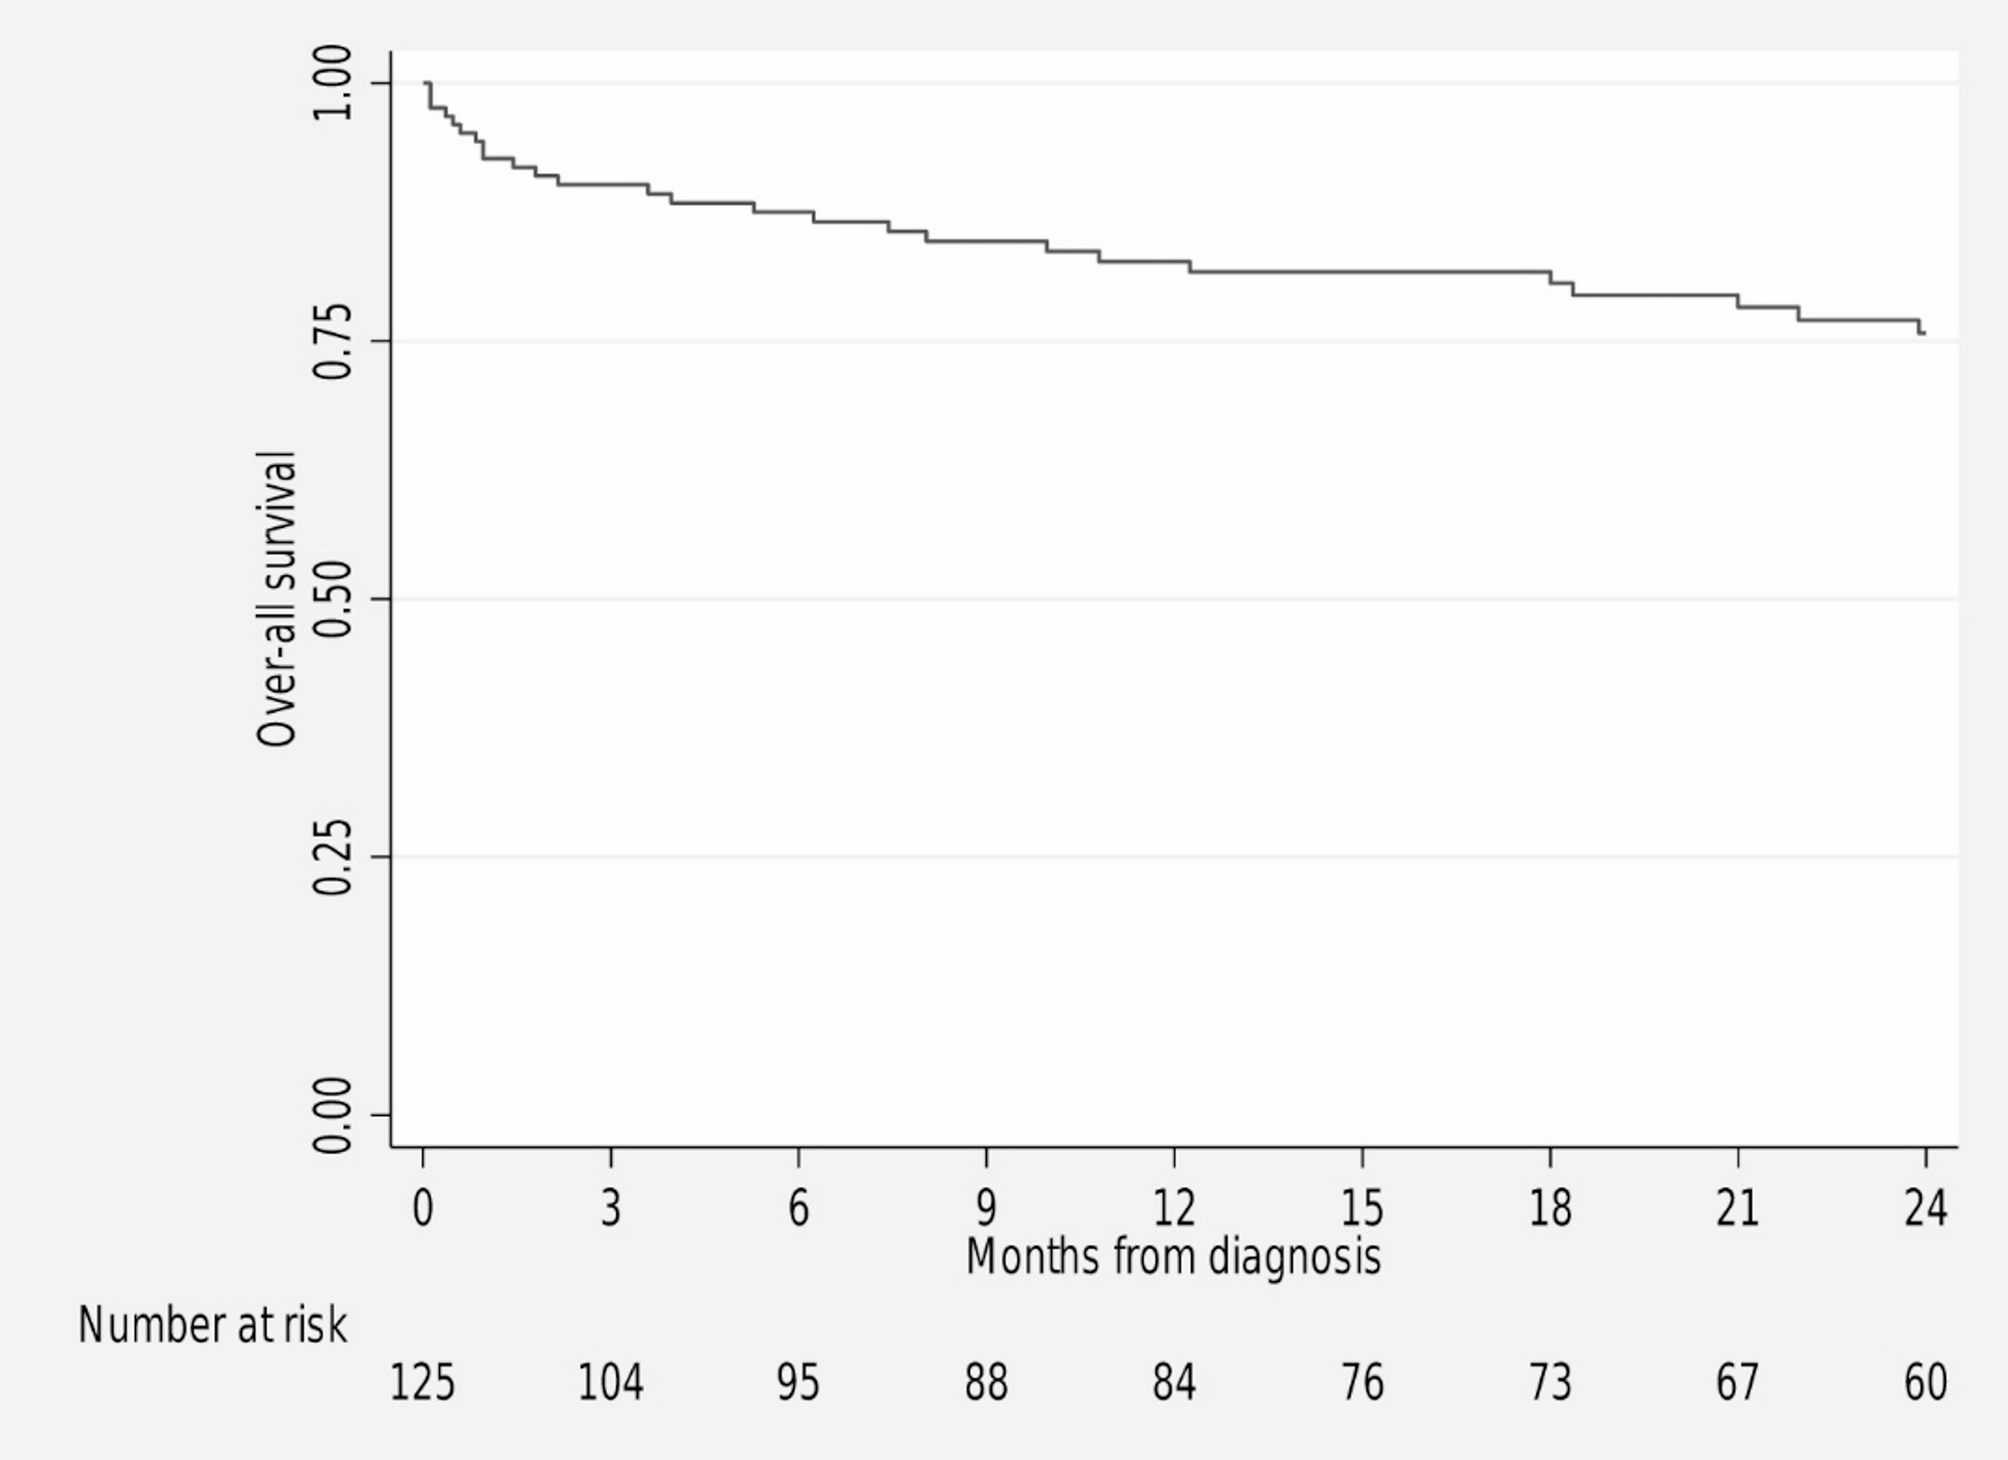
Table 5 Comparison of adverse events and outcomes between glucocorticoid + IV cyclophosphamide and glucocorticoid + mycophenolate mofetilOutcomesThe median follow-up duration was 1.8 years (range, 0.0–8.0 years). Twenty- five patients (19.5%) died during the observation period (Table 6), with infection as the leading cause of death. Other causes included cardiogenic shock, hemorrhagic shock, fatal arrhythmia secondary to hyperkalemia, brain herniation from severe intracranial hemorrhage, acute respiratory failure from pulmonary embolism, and hypoxia due to mucus plug. Overall survival at 1 year was 82.7% (Fig. 1). At 3 months, 28 patients (29.2%) achieved complete remission, 43 (44.8%) partial response, and 12 (12.5%) no response. At 6 months, 26 (29.9%) achieved complete remission, 9 (12.3%) partial response, and 12 (16.4%) no response. At the end of the observation period, 10 patients (7.8%) were lost to follow-up and 23 patients (18%) abandoned treatment, resulting in an overall attrition rate of 25.8. These patients were censored at their last recorded clinical encounter for survival and regression analyses.
Table 6 Outcomes at the end of the follow-up periodFig. 1
Kaplan Meier Analysis for Overall Survival at 2 years
Prognostic factorsOn univariate analysis, nephrotic range proteinuria at LN diagnosis was associated with an increased risk of mortality (hazard ratio [HR] 2.91, 95% confidence interval [CI]: 1.11–7.58; p = 0.029), while achieving partial response or complete remission at three months was associated with a reduced risk of mortality (HR 0.34, 95% CI: 0.14–0.83; p = 0.018). Failure to achieve partial response or complete remission at six months was similarly associated with an increased risk of mortality (HR 3.69, 95% CI: 1.34–10.07; p = 0.012). No other clinical or laboratory characteristics were identified as significant predictors of mortality. Multivariate analysis was performed using variables identified as statistically significant in the univariate analysis. However, none of these variables remained significant (Table 7).
On univariate analysis, hypertension at LN diagnosis was associated with increased odds of developing CKD 5 (odds ratio [OR] 5.57, 95% confidence interval [CI]: 1.25–24.92; p = 0.025), and failure to achieve partial response or complete remission at six months was similarly associated with increased odds of CKD 5 (OR 6.63, 95% CI 1.11–39.56; p = 0.038). No other clinical or laboratory characteristics were identified as significant predictors of CKD 5. Multivariate analysis was performed using variables identified as statistically significant in the univariate analysis. Hypertension at LN diagnosis (OR 8.74, 95% CI: 1.19–64.03; p = 0.033) and failure to achieve partial response or complete remission at 6 months (OR 9.24, 95% CI: 1.26–67.92; p = 0.029) remained significant predictors of CKD 5 when evaluated together. (Table 7)
Table 7 Predictors of poor outcome
Comments (0)