Mouse husbandry and breeding
The mICD mouse line harboring a floxed rabbit ß-globin transcriptional terminator between U1 and the PWS-IC was obtained from Prof. James Resnick, University of Florida [19]. For behavioral experiments, congenic female C57BL/6J mICD were crossed with inbred male 129S2 mice to generate isogenic mICD mice and their WT littermates in an F1 hybrid 129S2-C57BL/6J background. Mice were genotyped during weaning, three to four weeks after birth. Two weeks before the behavioral battery, female mICD and WT mice were shipped from the animal facility of Charles River Laboratories, Sulzfeld, Germany to that of the Erasmus MC (EMC), where all behavioral experiments were conducted. Given that we observed some aggressive behavior among males bred at our external facility, only adult female mICD mice and control littermates in the F1 hybrid 129S2-C57BL/6J background were used for the initial behavioral battery and following molecular analyses (qPCR and WB).
For behavioral experiments with mICD-Ube3aOEmice, C57BL/6J mICD females were crossed with 129S2 Tg-Ube3a-FL OE2x (Ube3aOE) males at Erasmus MC facilities, yielding isogenic F1 hybrid 129S2-C57BL/6J miCD-Ube3aOE, WT and mICD littermates. Both males and females were used for behavioral and follow-up molecular analyses (qPCR and WB). To obtain mICD mice in a 129S2 background for the induced audiogenic seizure experiment, C57BL/6J mICD mice were backcrossed for 4 generations before using them for the induced audiogenic seizure experiment.
For behavioral experiments with mICD and WT animals injected with the tASO or SCR, pregnant dams (C57BL/6J mICD) were shipped at E15 from the animal facility of Charles River Laboratories, Sulzfeld, Germany, to the EMC, where all behavioral experiments were conducted. All pregnant dams were single-housed until delivery. Females were used as indicated for behavioral and follow-up molecular analyses (qPCR and WB).
Mice born at the EMC were genotyped 4–7 days after birth, and all mice were re-genotyped at the end of each experiment. Animals were housed in individually ventilated cages (IVC; 1145T cages from Techniplast) in a barrier facility with a temperature of 22 ± 2 °C, a 12:12-hour light: dark cycle, and provided with ad libitum food [801727CRM(P) from Special Dietary Service] and water. Mice were group-housed, with 2 to 4 animals of the same sex per cage, until a week before the nest-building task, after which they were single-housed.
ICV injection of newborn mice
The tASO or SCR were prepared by diluting to a final concentration of 22 µg/µL in PBS supplemented with 0.3% Fast Green. The injection procedure closely followed the method outlined by Milazzo et al. 2021. In brief, P1 mice were cryo-anesthetized and injected using a glass pipette with a tip diameter of 0.5–0.7 μm, attached to a 25µL syringe (Hamilton, model 1702 N). Mice were injected in the lateral ventricle by positioning the needle at the midpoint between the right eye and the lambda intersection of the skull and then lowering it to a depth of approximately 3 mm. A volume of 1µL of either tASO, SCR, or PBS was administered at a flow rate of 0.5 µL/min using a CMA 400 Syringe Pump (Harvard Apparatus).
The tASO utilized in this study is identical to the one described in Milazzo et al. 2021, designated as ASO RTR26266, with the following nucleotide sequence: TCCaacttaataaCCT. The selection of the SCR ASO, RTR22946, was based on a list of non-targeting ASOs published by [27]. Its nucleotide sequence is: CcAAAtcttataataACtAC. In both sequences, capital letters represent PS-LNA modifications, where all LNA-C nucleotides incorporate the 5-methyl cytosine modification, while lowercase letters represent PS-DNA.
Behavioral testing
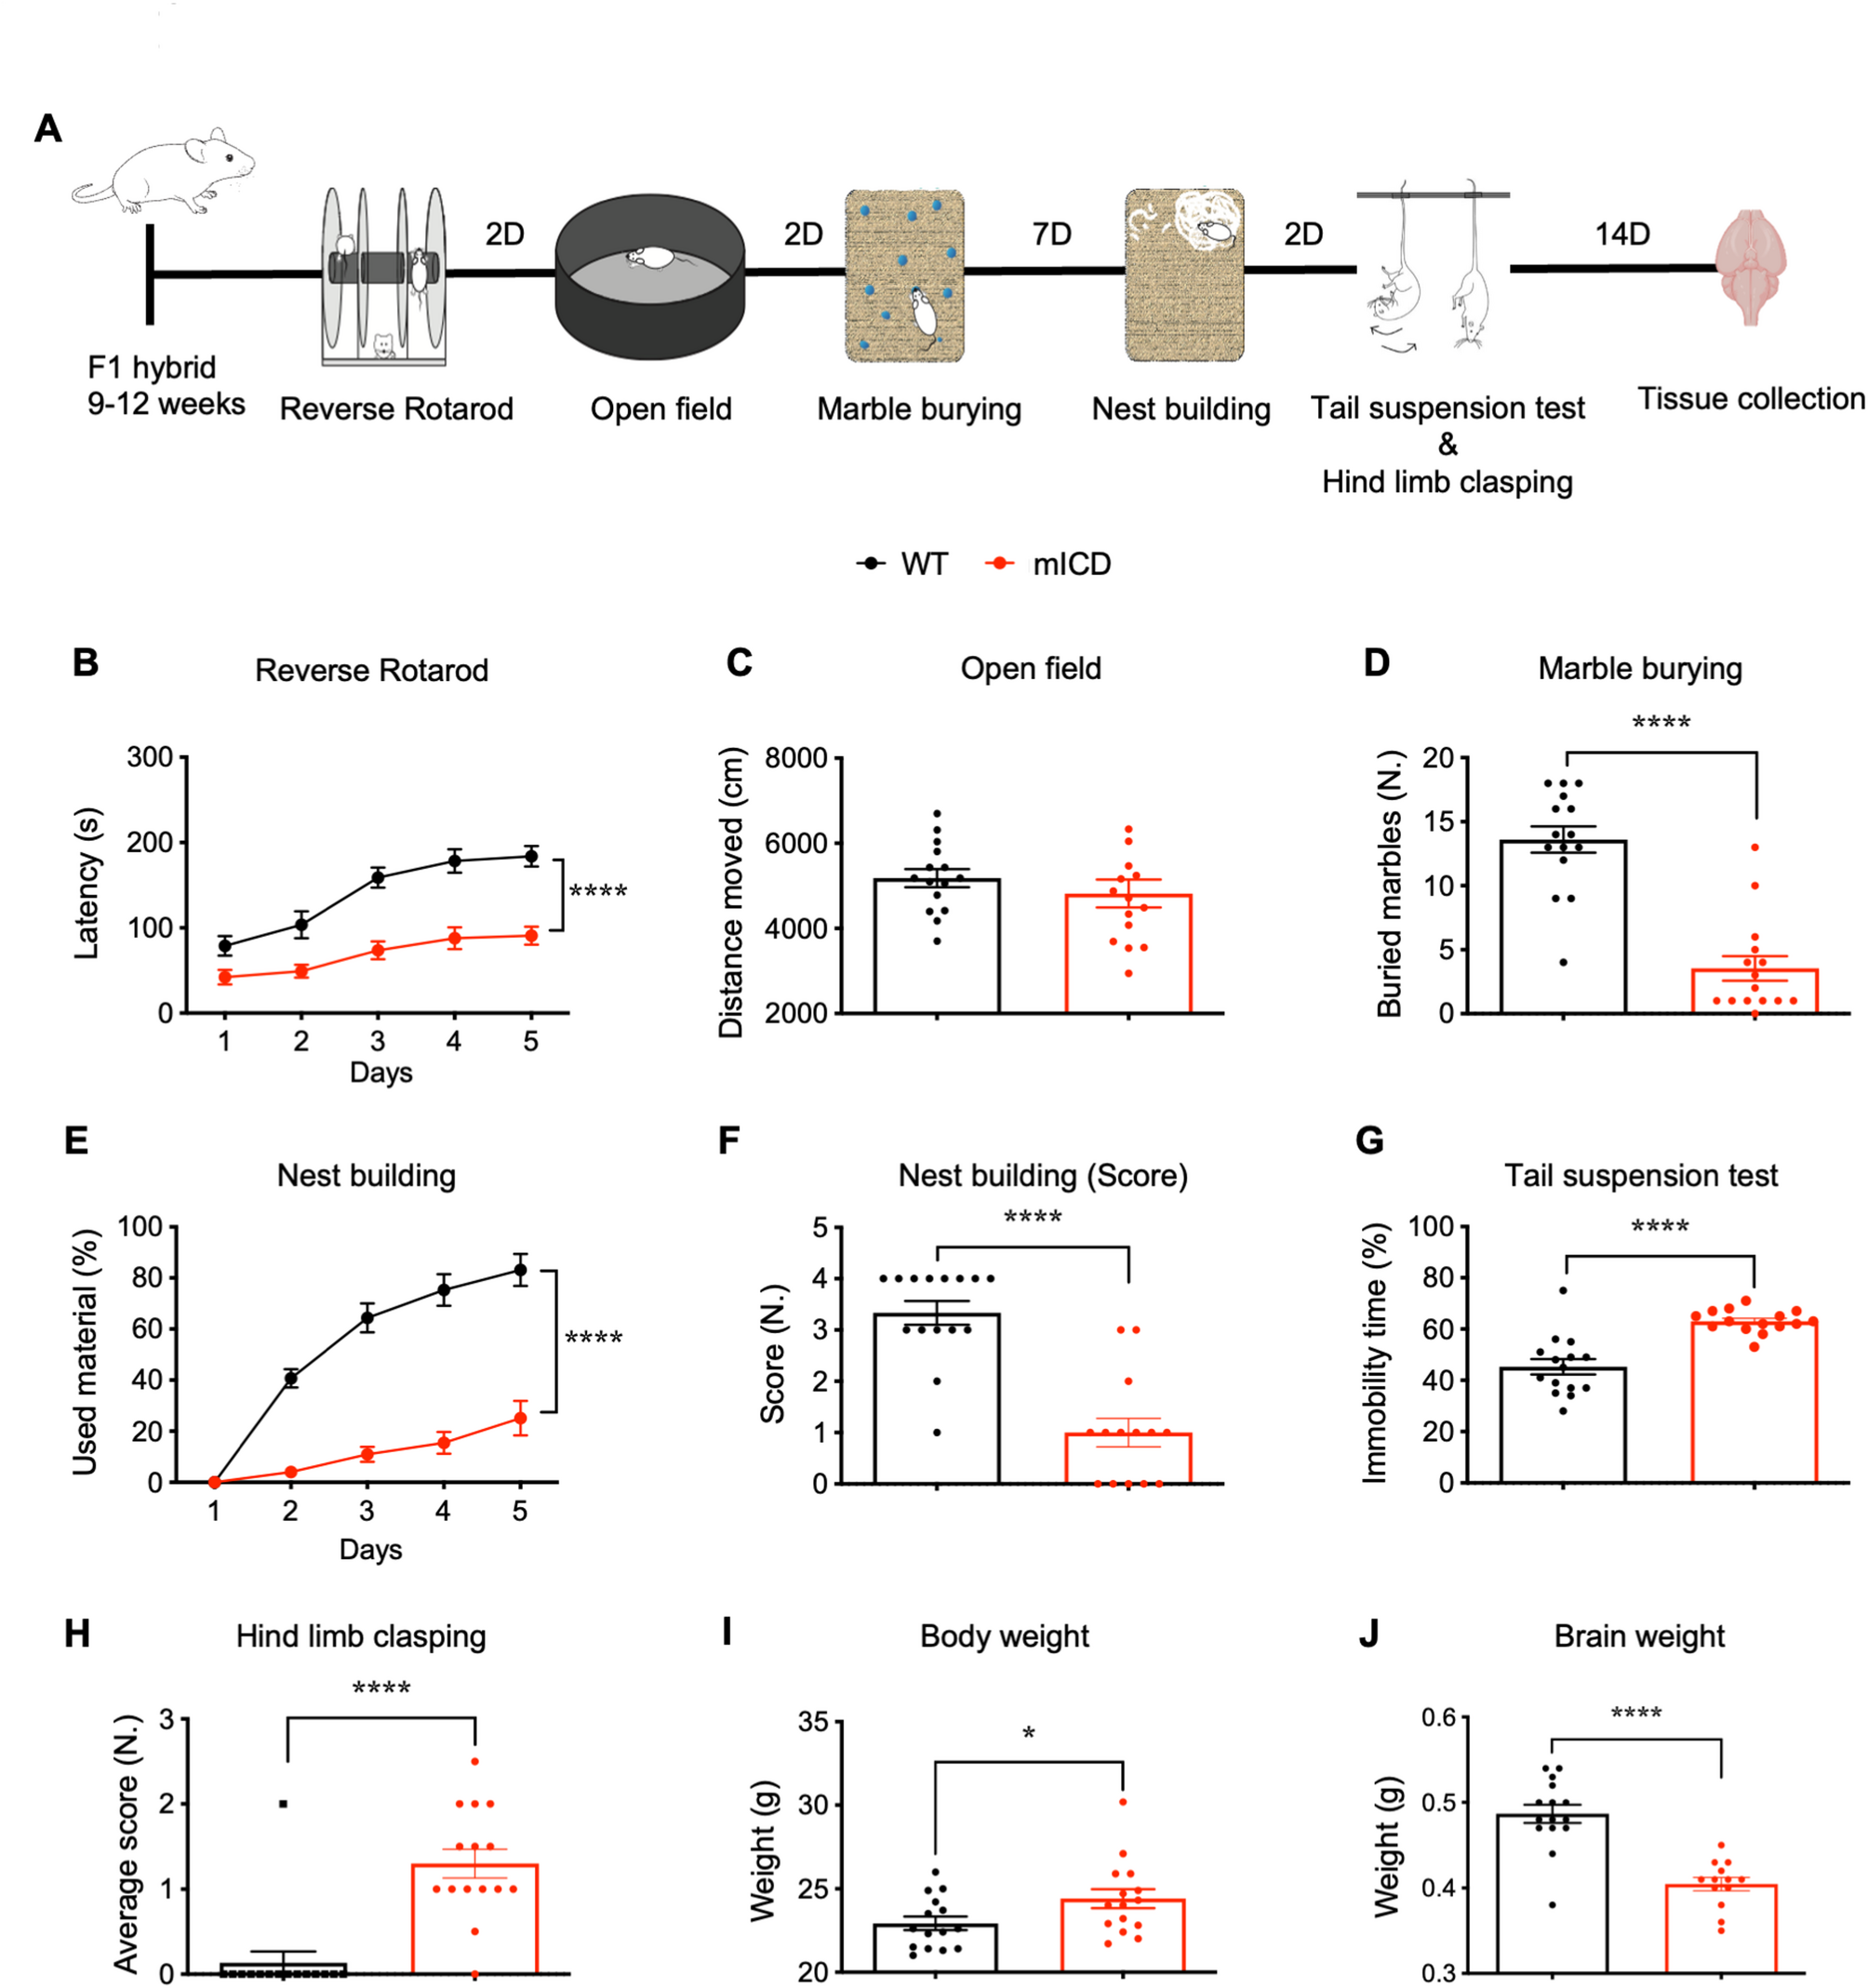
Mice were randomly assigned to experimental groups, while taking a male/female balance into account. The weight of the animals was measured on the same day as the start of the behavioral battery, before the first test and on the day of euthanasia. Between 9 and 12 weeks of age, mICD, mICD-Ube3aOE and WT mice were subjected to a standardized behavioral battery performed by a researcher blind to the genotype, during the light period of the light/dark cycle. No animals were excluded. Data from a previously published meta-analysis were used to calculate the sample size for the behavioral experiment [20]. Behavioral tests with mice not ICV injected were performed in the following order: 5 consecutive days of reverse rotarod; two days of break; open field (not performed with mICD-Ube3aOE and ASO-treated cohorts); two days of break; marble burying; a week of pause to allow adaptation to single-housing; 5 days of nest building (weight of the nest was assessed at the same hour every day in the experiment assessing differences between mICD and WT animals, and only on day five in the experiment assessing differences between mICD-Ube3aOE, mICD and WT animals); two days of break; forced swim test (only performed in experiment assessing differences between mICD-Ube3aOE, mICD and WT animals); two days of pause; tail suspension test. The behavioral tests were performed in the following sequence with 6-week-old female mice that received ICV injection at birth with either tASO, SCR, or PBS: reverse rotarod for 5 days, 2-day break; marble burying, on the same day mice were single-housed and the nest building test commenced, continuing for 5 days; 2-day break; tail suspension test. All battery tests, with the exception of the tail suspension test, were performed as previously described [10, 20]. For the tail suspension test mice were suspended in a frame, 40 cm above the base, using a paper adhesive tape placed approximately 1 cm from the tip of the tail, and videotaped for 5 min. The immobility time was measured by scoring manually (stopwatch) for 5 min the amount of time (seconds) the mouse was not moving. The first and last 10 s of the recording were scored on a scale from 0 to 3 based on hind-limb clasping and the average score was used for hind-limb clasping analysis. The scale was adapted from a previous study: 0 = both hindlimbs were placed outward away from the abdomen, 1 = one hindlimb was retracted or both hindlimbs were partially retracted toward the abdomen without touching, 2 = both hindlimbs were partially retracted toward the abdomen and were touching the abdomen without touching each other, 3 = both hindlimbs were fully clasped and touching the abdomen [35]. Additionally, at the end of the nest building task, photographs of the nest were taken for following nest quality analysis. The nests were rated on a scale from 0 to 4 based on what was reported in a previous study [8], in summary if no nesting material was used a score of 0 was assigned, if a minimal quantity of nesting material was used to build a rudimental nest a score of 1 was given, if more nesting material was used to build a disorganized nest a score of 2 was assigned, if most nesting material was used to build an organized nest with defined borders a score of 3 was given, and if > 90% of nesting material was used to build a well-defined circle-like structure a score of 4 was assigned.
Audiogenic-induced seizure test
Mice (n = 8 mICD and 12 mICD-Ube3aOE mice)were placed in a Macrolon cage (50 × 26 × 18 cm) fitted with a cage top consisting of a metal grid. Audiogenic seizures were induced by vigorously and loudly (~ 100 dB) scratching a pair of scissors against the metal grid. This stimulus presentation was maintained for 20 s or until a tonic-clonic seizure occurred.
Tissue processing and RNA/protein extraction
Mice were euthanized by cervical dislocation under anesthesia with isoflurane. The cortex, hippocampus and striatum were extracted immediately after by snap freezing and stored at -70 °C till further processing. For qRT-PCR, RNA sequencing and Capillary western blotting, tissues were homogenized in tubes prefilled with ceramic beads (MagNaLyser Green Beads, Roche, # 03358941001) using MagNALyser instrument (Roche). Subsequently, the lysate was processed using a spin-column based kit (NorgenBiotek Corp., #47700) for sequential extraction of DNA, RNA and Protein, according to the manufacturer’s instructions.
Real-time qRT-PCR
Total RNA quantity and quality was determined using the NanoDrop 1000 spectrophotometer (DeNovix, Life Science Technologies). From this, 50ng RNA was first treated with the TURBO DNase enzyme (Thermo Fisher, #AM2238) according to manufacturer’s directions, to remove any residual DNA contaminants and diluted to 2ng/ul. Subsequently, each RNA sample was reverse-transcribed and quantitative real-time PCR was performed simultaneously in a single step using iTaq Universal SYBR Green One-step kit (Bio-Rad, #1725150), in the Lightcycler instrument (Roche). Primers were obtained from MicrosynthAG and sequences are listed in Supplemental Table 1. Each sample were measured in triplicates. Using the mean Ct-value of these triplicates, real-time qRT-PCR data were analyzed by normalizing each transcript to GAPDH level, with each value represented as a fold change with respect to the control group.
Capillary western blot
Protein levels of UBE3A in the mouse brain were analyzed by automated capillary western blotting (Sally Sue, Protein Simple). All experimental steps were carried out according to the manufacturer’s instructions. Briefly, after protein extraction and quantification by BCA protein assay (ThermoFisher, #23225), a final sample concentration of 0.5 mg/ml was loaded to the capillary cartridges (12–230 kDa Peggy Sue or Sally Sue Separation Module, #SM-S001). Chemiluminescent protein detection was performed using the Anti Rabbit Detection Module (#DM-001) and the area under the chemiluminescent curve for each protein probed was obtained from the Compass for SW software (Version 4.1.0, Protein Simple). The values for UBE3A were then normalized to HPRT protein and represented as a fold change with respect to the control group. Antibodies used are UBE3A (Bethyl, #A300-352 A, 1:50), HPRT (Abcam, #ab109021).
Immunoblotting
Twenty micrograms of protein lysate, extracted from one cerebral hemisphere, were separated on a precast 4–12% Criterion XT Bis-Tris gel (Bio-Rad) and transferred to a nitrocellulose membrane using TurboBlot (Bio- Rad). After blocking for 1 h, at room temperature, with blocking buffer, the following antibodies were used: anti-UBE3A (mouse, anti-E6AP, MilliporeSigma, # E8655, 1:1000) and anti-GAPDH (rabbit, Cell Signaling, # 2118, 1:1000). The next day, the membranes were probed with secondary goat anti-mouse antibody (LI-COR Biosciences, IRDye 800CW, # 926-32210, 1:15,000) and goat-anti-rabbit antibody (LI-COR Biosciences, IRDye 680RD, # 926-32221, 1:15,000). The membranes were scanned using Odyssey CLx (LI-COR Biosciences) and quantified using the Odyssey 3.0 software.
RNAseq and data analysis
Total RNA was isolated from seven mICD and seven WT adult female cortex. An RNA integrity of above 8 for all samples was confirmed post extraction using the Tapestation RNA ScreenTape from Agilent. 500 ng of total RNAs were used to prepare sequencing libraries using the TruSeq Stranded total RNAs Library Prep Kit (Illumina) according to the manufacturer’s instructions. All libraries were multiplexed into a single pool which was sequenced across 2 lanes of a SP flow cell of an Illumina NovaSeq 6000 instrument at the Genomics 360 Labs, Roche. On average, each library generated approximately 100 million paired-end 75 bp reads.
Base calling was performed with BCL to FASTQ file converter bcl2fastq2 version 2.20.0 (BCL to FASTQ file converter, available online at Illumina Inc.). FASTQ files were quality checked with FastQC version 0.11.9 (available online at Babraham Institute: https://www.bioinformatics.babraham.ac.uk/projects/fastqc/). Paired-end reads were mapped onto the mouse genome (build mm39) with read aligner STAR version 2.7.10b using default mapping parameters [36]. Alignment metrics were determined with Picard version 2.25.1 (Picard Toolkit, 2018. Broad Institute, GitHub Repository: http://broadinstitute.github.io/picard/; Broad Institute). Read sequences and alignments were quality checked with MultiQC version 1.12 [37]. Numbers of mapped reads for all RefSeq and/or Ensembl transcript variants of a gene were combined into a single value (i.e. read count) assuming reverse stranded library by featureCounts version 2.0.1 [38] and normalized as tpm (transcripts per million). We applied the edgeR algorithm [39] for differential gene expression analysis. For gene set enrichment analysis, we performed the adapted CAMERA algorithm implemented in the ribiosNGS package (Next-generation sequencing data analysis with ribios. https://github.com/bedapub/ribiosNGS).
Proteomics and data analysis
Total protein profiling of adult mouse cortex tissue from WT vs. mICD and WT vs. Ube3am−/p+) was performed at Biognosys AG (Schlieren, Switzerland) and the proteomic profiling of adult mouse cortex tissue from WT vs. mICD vs. mICD-Ube3aOE was performed at Proteomics 360 Labs at Roche using Hyper Reaction Monitoring (HRM™) label-free discovery proteomics workflow. All measurements were performed in a randomized, blinded fashion and balanced for genotype and age (4 males, 4 females per genotype). Sample preparation, Data-independent acquisition (DIA) mass spectrometry and data analysis were performed as described in Pandya et al. 2022 and described here.
Tissue samples were denatured using Biognosys’ Denature Buffer, and reduced and alkylated using Biognosys’ Reduction and Alkylation Solution for 60 min at 37 °C. Subsequently, digestion to peptides was carried out using trypsin (w/w ratio 1:50 Promega) overnight at 37 °C. Peptides were desalted using an Oasis HLB µElution plate (Waters) according to the manufacturer’s instructions and dried down using a SpeedVac system. Peptides were resuspended in LC solvent A (1% acetonitrile, 0.1% formic acid (FA)) spiked with Biognosys’ iRT kit calibration peptides. Peptide concentrations were determined using a UV/VIS Spectrometer (SPECTROstar Nano, BMG Labtech) and 3.5 µg of peptides were injected to an in-house packed reversed phase column on a Thermo Scientific™ EASY-nLC™ 1200 nano-liquid chromatography system connected to a Thermo Scientific™ Orbitrap™ Exploris 480™ mass spectrometer equipped with a Nanospray Flex™ ion source and a FAIMS Pro™ ion mobility device (Thermo Scientific™). LC solvents were A: water with 0.1% FA; B: 80% acetonitrile, 0.1% FA in water. The nonlinear LC gradient was 1–50% solvent B in 210 min followed by a column washing step in 90% B for 10 min, and a final equilibration step of 1% B for 8 min at 60 °C with a flow rate set to 250 nL/min. The FAIMS-DIA method consisted per applied compensation voltage of one full range MS1 scan and 34 DIA segments as adapted by [40, 41]. Total protein profiling was performed using Biognosys’ Hyper Reaction Monitoring (HRM™) label-free discovery proteomics workflow. The mass spectrometric data were analyzed using Pulsar search engine as implemented in Spectronaut software (version 16.2, Biognosys), the false discovery rate on peptide and protein level was set to 1%. A mouse UniProt .fasta database (Mus musculus, 2022-07-01, 17’125 entries) was used for the search engine, allowing for 2 missed cleavages and variable modifications (N-term acetylation and methionine oxidation). The generated directDIA library was used for further analysis and the HRM measurements analyzed with Spectronaut were normalized using global normalization on the median.
For each dataset, relative abundance measurements were log2 transformed and Gene Ontology (GO) annotations for each protein were downloaded from UniProt [42]. Principal Component Analysis (PCA) was performed using the whole proteomics dataset. PCA was used to visualize the data in a reduced space capturing the highest variability, to potentially highlight the differences between the experimental conditions or due to covariates. Outliers were detected using the robust Mahalanobis distance computed from the first 3 principal components.
Differential abundance analysis between conditions was based upon linear models applied to each protein independently using the limma package in R [43]. Specific contrasts of interest were defined in each dataset. For both datasets, no covariate was identified as impacting the data, leading to the following linear models: First dataset: y ~ Group*Mouse_Model, with Group referring to Ube3am−/p+ or WT, Mouse_Model referring to Ube3am−/p+ or mICD animal models. Second dataset: y ~ Group, with Group referring to WT, mICD or mICD-Ube3aOE groups. Moderated t-tests were then performed using the Empirical Bayes method, which moderates the variance [44]. P-values were adjusted for multiple comparisons using the Benjamini–Hochberg method to control the false discovery rate (FDR). Proteins with an adjusted p-value below 0.05 were considered differentially expressed. For gene-set enrichment analysis (GSEA), we considered Gene Ontology (GO) collections related to Biological Processes, Molecular Functions and Cellular Components. We report here the results from the GO: CC collection [45]. For each contrast of interest, all genes/proteins were ranked and compared to the sets of genes from the database. A normalized enrichment score was then computed for each gene set using the camera function in the limma package, which considers the potential correlation between genes. In our case, we considered a fixed inter-gene correlation at 0.01, to better rank biologically interpretable gene sets [46]. The associated p-value estimates the statistical significance of the score, based on the null distribution of the Kolmogorov–Smirnov statistic [47]. As multiple enrichment tests were performed, the Benjamini-Hochberg method was used to correct for multiple-hypothesis testing.
Statistics
All statistical analyses were done using GraphPad Prism software (v7.0, GraphPad Software Inc.,) and P value less than 0.05 was considered significant. Western blot and qRT-PCR data were analyzed using t-test or a 1-way ANOVA, 2 sided, with genotype as independent variable, and followed by Tukey’s post hoc test. Before performing any statistical test on the behavioral data, the samples were analyzed for normal distribution. To analyze data from the open field, marble burying, tail suspension test, forced swim test, hind-limb clasping, nest quality and quantity of nest material used on day 5, brain and body weight we used a parametrical or non-parametrical 1-way ANOVA, 2 sided, with the variable genotype as independent variable, followed by Tukey’s post hoc test. Both the reverse rotarod and nest building, where quantity of material used was measured over five days, were analyzed with a 2-way repeated-measure ANOVA, 2 sided, followed by Tukey’s post hoc test, with genotype and time as independent variables. All data are plotted as mean ± SEM. P-values show the significance level for the measurement and are indicated as asterisks in the figures and not shown if p-value is more than 0.05. Detailed information about the statistical test used for each experimental measurement can be found in Supplemental Table 2.


Comments (0)