
Remember me

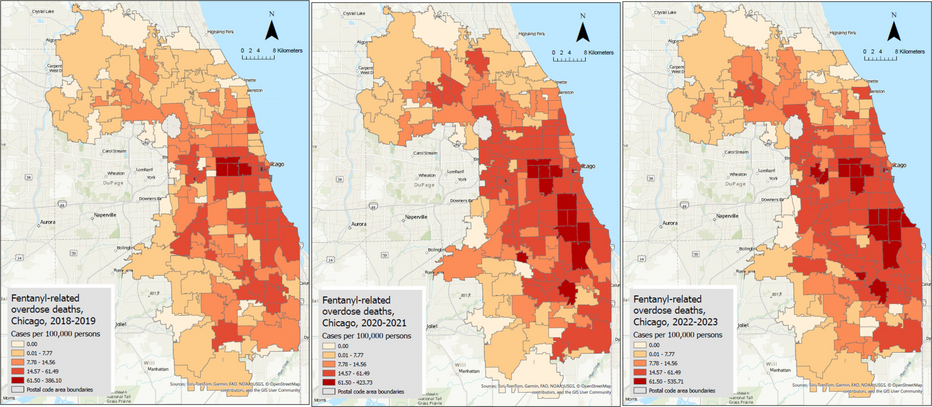

Table 1 provides an overview of the sociodemographic and economic characteristics of the 177 ZIP code areas included in the analysis. The average IR of fentanyl-related deaths between 2018 and 2023 was 26.01 per 100,000 persons (SD = 43.14). There were four ZIP code areas with 0 death events involving fentanyl. The population composition showed that adults (40–64 years) comprised the largest group, averaging 31.81% (SD = 4.35), followed closely by young adults (18–39 years) at 30.52% (SD = 10.97), indicating that working-age individuals represent most of the population in these ZIP codes. Males represented an average of 49.08% (SD = 3.08) of the population across ZIP codes. The percentage of the population identifying as non-Hispanic Black averaged 21.40% (SD = 28.48), while Hispanic individuals accounted for 21.05% (SD = 19.68). On average, 42.23% (SD = 23.09) of residents had a college degree or higher. Indicators of socioeconomic challenges included a disability rate of 10.72% (SD = 4.88), a poverty rate of 11.50% (SD = 7.83), and an unemployment rate of 9.11% (SD = 31.11).
Table 1 Summary statistics of sociodemographic variables for ZIP code areas, 2018–2023Incidence Rate MapsFigure 1 shows the distributions of raw IR per 100,000 person-years across the three time periods. During 2018–2019, the IR ranged from 0 to 386.10 cases per 100,000 person-years, and the areas with the highest IRs were primarily concentrated in the western area of the city of Chicago, with moderate IRs observed across other regions of the city. During the COVID-19 pandemic (2020–2021), the IR ranged from 0 to 423.73 cases per 100,000 person-years, and a notable increase in IRs across the ZIP code areas was observed, with a pronounced rise in the southern parts of Chicago and surrounding regions. The western region, which already had high IRs in the earlier period, showed further increases. In the post-pandemic period, the IR ranged from 0 to 535.71 cases per 100,000 person-years, and the IRs continued to rise, but at a less dramatic rate than the transition from 2018 to 2019 to the COVID-19 pandemic period. The distribution patterns stabilized, with high IRs persisting in the western and southern areas. The northern regions and the suburbs exhibited relatively low IRs over the three study periods.
Fig. 1
Maps for raw fentanyl-related death rates per 100,000 persons for three periods (2018–2019, 2020–2021, and 2022–2023)
Smoothed Incidence Rate MapsThe IRs of overdose deaths using the spatial empirical Bayesian (SEB) smoothing method are illustrated in Fig. 2. This smoothing technique borrows strength from neighboring areas’ IRs and the overall distribution of IRs, reducing extreme IRs, making the rates more reliable, and reducing the impact of outliers or regions with low sample sizes where the IRs tend to be overestimated. In the first study period (2018–2019), the highest IR was reduced to 53.8 cases per 100,000 person-years. Compared to the raw IR map, in the SEB smoothed map of the first period, the extent of high IR areas in the western area of the city of Chicago was reduced; however, three areas’ IRs remained high (28.91, 32.97, and 53.80), suggesting a stable high-rate area.
Fig. 2
Maps for smoothed fentanyl-related death rates per 100,000 persons for three periods (2018–2019, 2020–2021, and 2022–2023)
In the second period (2020–2021), the SEB smoothing reduced the highest IR to 96.99. Interestingly, this area, located in the western part of Chicago, was also identified in the first study period as the highest IR area. Additionally, in this period, the SEB smoothed maps followed the same patterns identified in the raw IR maps, keeping the extent of high-rate areas unchanged and showing an expansion of high-IR areas into the southern parts of the city of Chicago and surrounding regions. In the third period (2022–2023), the highest SEB smoothed IR was 81.23 in a ZIP code located in western Chicago, which was also identified as the highest IR area in the first and second periods. In addition, compared to the raw IR map of this period, the SEB smoothing increased the extent of high-rate areas, and in addition to the western part of Chicago, the high-rate areas included downtown Chicago and further areas in the southern region. The SEB smoothing method was useful to filter out noise (e.g., over- or under-estimated IRs) while preserving meaningful spatial structures (e.g., areas with high IRs).
Global Clustering AnalysisFor each period, we identified the distance band with the highest Moran’s I and z-score values. Across all three periods, the distance band was consistently 18,137 m, although the highest z-scores varied. The highest z-score was 6.53 in the first period, 9.22 in the second, and 8.34 in the third period. Details about the global clustering results are provided in Fig. 5 in the Appendix. All Moran’s I values were positive and were statistically significant (p-value < 0.05; z-score ≥ + 1.96) for all incremental distances, indicating significant spatial autocorrelation across all three time periods. The Moran’s I value was 0.110 in the first period, 0.240 in the second, and 0.112 in the third, indicating stronger spatial autocorrelation during the last two periods.
Local Cluster AnalysisLocal clustering analysis (Fig. 3) demonstrated the spatiotemporal dynamics of fentanyl-related deaths, highlighting the distribution of statistically significant hot spots (high-high clusters, shown in pink), cold spots (low-low clusters, shown in light blue), and outlier areas (high-low and low–high). Before COVID-19, hot spots were present but less extensive and were concentrated within the Chicago area. During the pandemic, a substantial expansion of these hot spots occurred, with a marked intensification and spread within the metropolitan area. Concurrently, the distribution of cold spots shifted. They were initially concentrated in the northern and southern fringes of Cook County (2018–2019), but the southern cold spots expanded significantly by 2020–2021, extending further northward toward the county’s central region. Figure 3 also suggests the presence of low–high outliers bordering the expanding hot spots, where future expansion of overdose deaths is expected. Interestingly, no high-low areas were identified, suggesting that the distribution of overdose deaths is consistent and increasing.
Fig. 3
Maps illustrating the results of the local cluster analysis of fentanyl-related death rates for three periods (2018–2019, 2020–2021, and 2022–2023)
Geographically Weighted Poisson RegressionThe best-fitting model (R2 = 0.62) identified from the exploratory regression analysis (a global model that does not account for the geographical variability in the outcome and predictor variables) included the following statistically significant explanatory variables (p-value < 0.001): percentage of young adults (18–39 years), percentage of males, percentage of individuals with a college degree or higher, disability rate, and poverty rate. Using these variables, the GWPR model (a local model that accounts for the geographical variability) explained 79% of the deviance in fentanyl-related mortality rates, showing a better fit than the global model. The variables initially considered but excluded from the GWPR model based on exploratory regression included the ZIP code level proportion of juveniles (5–17 years), the proportion of adults (40–64 years), the proportion of race/ethnicity (non-Hispanic Black and Hispanic populations), and the unemployment rate. The area-level poverty rate, disability rate, and proportion of young adults had a positive effect (i.e., with an increase in these predictors, the fentanyl-overdose death rate increases) in all areas (e.g., ZIP codes), while the area-level proportion of college graduates and the proportion of males had a positive effect in some areas and a negative effect (i.e., with an increase in these predictors, the fentanyl-overdose death rate decreases) in other areas. Figure 4 shows how the coefficients of the explanatory variables vary by ZIP code. For example, the proportion of males had a positive effect (red areas) in the southern part of Cook County, while it had a negative effect (blue areas) in the northern regions. The increase in the proportion of individuals with a college degree or higher had a positive effect on the death rate in the Chicagoland area (downtown Chicago and neighboring areas) and a negative effect in the southern and northern areas of Cook County.
Fig. 4
Coefficients of the explanatory variables
The poverty rate had the highest positive influence on the fentanyl overdose death rates in the central and northern regions of Cook County, including the Chicagoland area, and its positive impact diminished in the southern regions of Cook County. The disability rate exhibited a stronger positive association with fentanyl overdose mortality rates in the northern and southern regions of Cook County, while the positive effect was weaker in the central region, particularly the Chicagoland area. The proportion of young adults had the highest positive effect on the fentanyl overdose death rate in the southern part of Cook County; the positive effect was reduced in the Chicagoland area. The distribution of the intercept coefficients (the predicted values of the fentanyl-overdose death rates when the predictor variables are not included in the model) had positive values in northern and central Cook County and negative values in the southern areas.
Comments (0)