
Remember me
The seeds of Dendrobium antennatum were sown in the ELTE Botanical Garden. Hand-pollination was done between two sibling plants. The seedlings of D. antennatum were transferred to the Hungarian University of Agriculture and Life Sciences. Sowing was done on 1/2 MS medium. Seedlings were introduced into the experiment at 6 mo of age.
To grow the seedlings of the plants, MS medium in half macroelement concentration (1/2 Murashige and Skoog (MS)) (Table 1) was used and the same micronutrient amount as that developed by Murashige and Skoog (1962). Different vitamins were added to the medium: nicotinic acid (0.05 g L−1), pyridoxine (0.05 g L−1), thiamine (0.01 g L−1), glycine (0.02 g L−1), and myo-inositol (1 g L−1). Also, 5.5 g L−1 agar was added to the medium. All components used for preparing the in vitro propagation media were obtained from Duchefa Biochemie (Haarlem, The Netherlands). As a carbohydrate source, honey was used in varying amounts to replace sucrose partially or completely. The pH of four different honeys was measured: rape 3.6 pH, chestnut 4.1 pH, hawthorn 4.3 pH, and linden 4.4 pH. The honey with the highest pH (linden) was selected. The honey was sourced from linden flowers collected in the northeastern region of Hungary. All ingredients were mixed in boiling distilled water. The honey was mixed into the medium before autoclaving; the quantities were measured on a scale, then dissolved in a small amount of hot water for easier handling and added to the other ingredients in this form. The final pH in the media was set to 5.8 by the addition of 1 N potassium hydroxide (KOH). The media were sterilized by autoclaving (LMIM MA-5403 type, Hungary) at 121 °C for 20 min.
Table 1. The amounts of macro- and microelements (mg L−1). This base medium was supplemented with vitamins and varying amounts of honey and sucrose (see details in the text)The control medium (K0) was completely honey-free; it contained 20.0 g L−1 saccharose. The medium marked M½ was supplemented with 10.0 g L−1 sucrose and 15.0 g L−1 honey. In the M1 medium, saccharose was completely omitted, and only honey was added at 30.0 g L−1 as a carbohydrate source. Similarly, in the M2 medium, only honey at 60.0 g L−1 was added as a source of carbohydrates. Every treatment contained six flasks with four plants per flask each. A total of 96 plants were included in the experiment. Also, 150-mL volume flasks were used, and 30 mL of culture medium was placed in each flask. The culture vessels were closed with three layers of cling film (polyethylene plastic). Plants were grown in temperature of 22 ± 4 °C and 16/8 h of illumination (lamp: Polylux XLR FT8/30W/860, made in Bucyrus, Ohio). LED strip lights were placed approximately 25 cm above the jars, and the photon flux density was 59.2 µmol·m−2·s−1. Culture was maintained in the same culture vessels for 120 d, followed by evaluation.
Analytical measurement of the honeyThe total nitrogen content was determined according to the K. C. Rhee method (Rhee 2001), which is based on the Kjeldahl method. The samples were boiled with concentrated sulfuric acid (Merck KGaA, Darmstadt, Germany) and copper (II) sulfate (Merck KGaA) catalyst to convert all nitrogen into ammonium sulfate. Then, alkali was added to the heated solution, and the liberated ammonia was distilled off. Ammonia was introduced into a solution containing a known amount of acid, and its amount was determined by titrating the amount of unreacted acid. From this, the nitrogen content of the original material was calculated.
Minerals and microelements (calcium, copper, iron, potassium, magnesium, manganese, sodium, phosphorus, sulfur, and zinc) were determined via inductively coupled plasma atomic emission spectrometry (Agilent Technologies, Inc. Santa Clara, CA) after acid digestion (Batista et al. 2012). Inductively coupled plasma atomic emission spectrometry uses an ICP source to atomize and thermally excites the sample. The argon ICP plasma is a robust source with sufficiently high energy density to be suitable for the treatment of gas, liquid, or finely powdered solid samples. The emission from the thermally excited samplers traveling upwards in the central channel of the vertically installed plasma torch is observed from the side. The emitted light is analyzed with a high-resolution polychromator.
The chloride content of the samples was determined by titration through Mohr’s method (Trinidad Perez-Palacios et al. 2022). The sample solution was titrated with a silver nitrate solution (Merck KGaA) of known concentration. A potassium chromate indicator (Merck KGaA) was used, which produced a red silver chromate after all the chloride ions had reacted.
High-performance liquid chromatography coupled with refractive index detection (HPLC–RI; Shimadzu Corporation, Kyoto, Japan) was used for the simultaneous determination of fructose, glucose, sucrose, and maltose (Grembecka et al. 2014). The analyzed samples were first filtered through filter paper to remove any solid particles and then diluted with 75% acetonitrile (Merck KGaA) as recommended by the column manufacturer. All the final solutions were filtered through 0.45-μm membrane filters (Merck KGaA) before injection. The samples were injected into HPLC column Agilent Zorbax Carbohydrate Analysis with size 4.6 ID × 250 mm with guard column, flow rate 1.4 mL min−1, isocratic mobile phase acetonitrile per water in ratio 75:25, temperature of detector and column 30 °C, and volume of injection 5.0 μL without needle wash. Fructose, glucose, sucrose, and maltose were determined using refractive index (RI) detection.
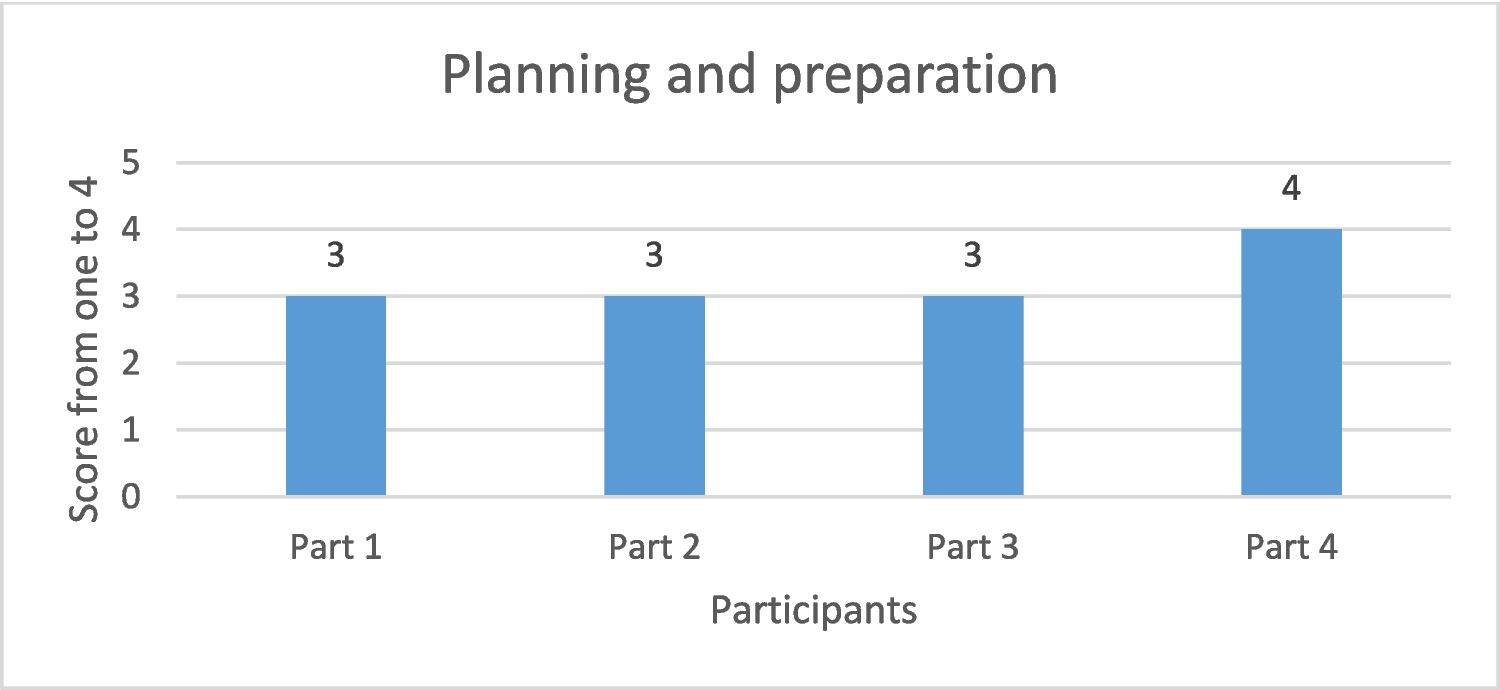
Methods of measurement-Measurement of the physiological developments of the plantsThe height of the plants was measured with millimeter paper (Fig. 2), from the root neck to the tip of the largest leaf. The fresh weight of the whole plant (including the roots) was measured using a Highland HCB602M laboratory balance. The developmental level of the roots was divided to five categories: 0, 1, 2, 3, and 4. Plants numbered 0 had no roots at all, or if they did, they were still forming on the previous medium and were no longer functional. Plants in the interval 1 to 4 inclusive had living, functional roots; only differences in quantity and length were observed. Category 4 specimens had numerous high-quality roots, while category 1 specimens had few, poor-quality roots. The results of the assessment were then averaged. Data observations were then analyzed statistically.
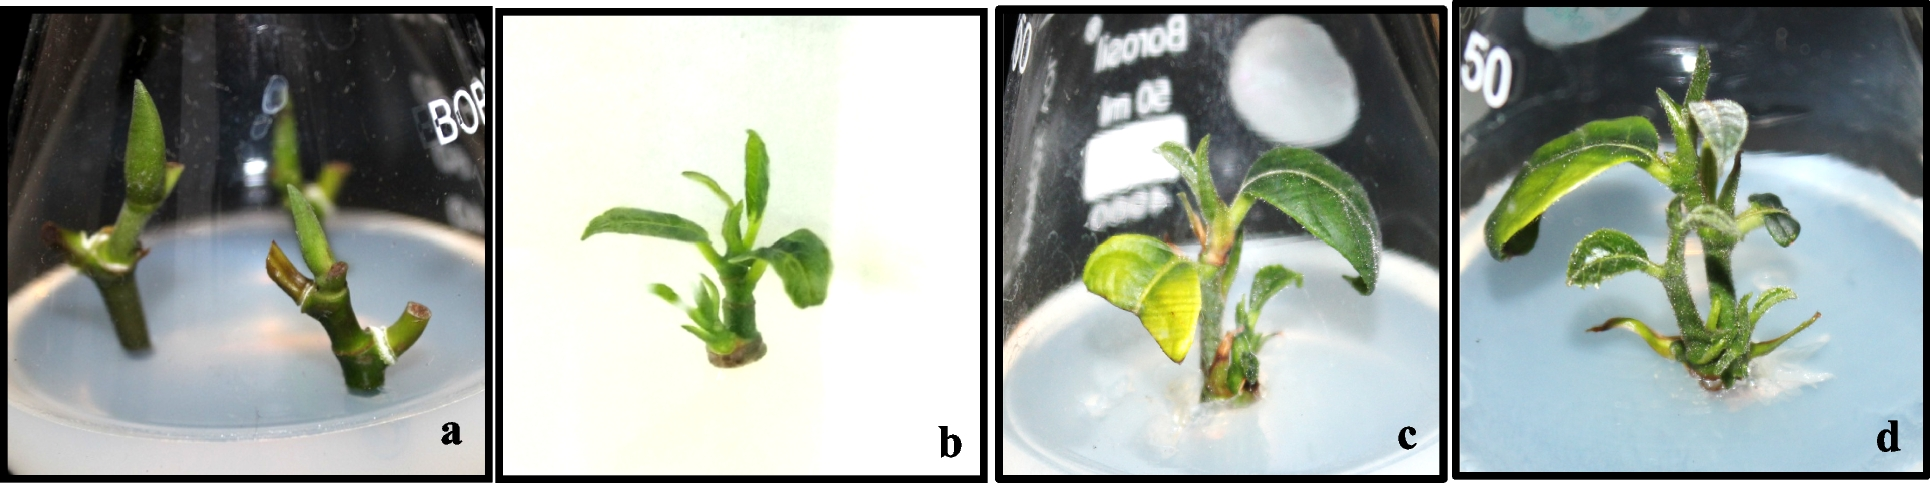
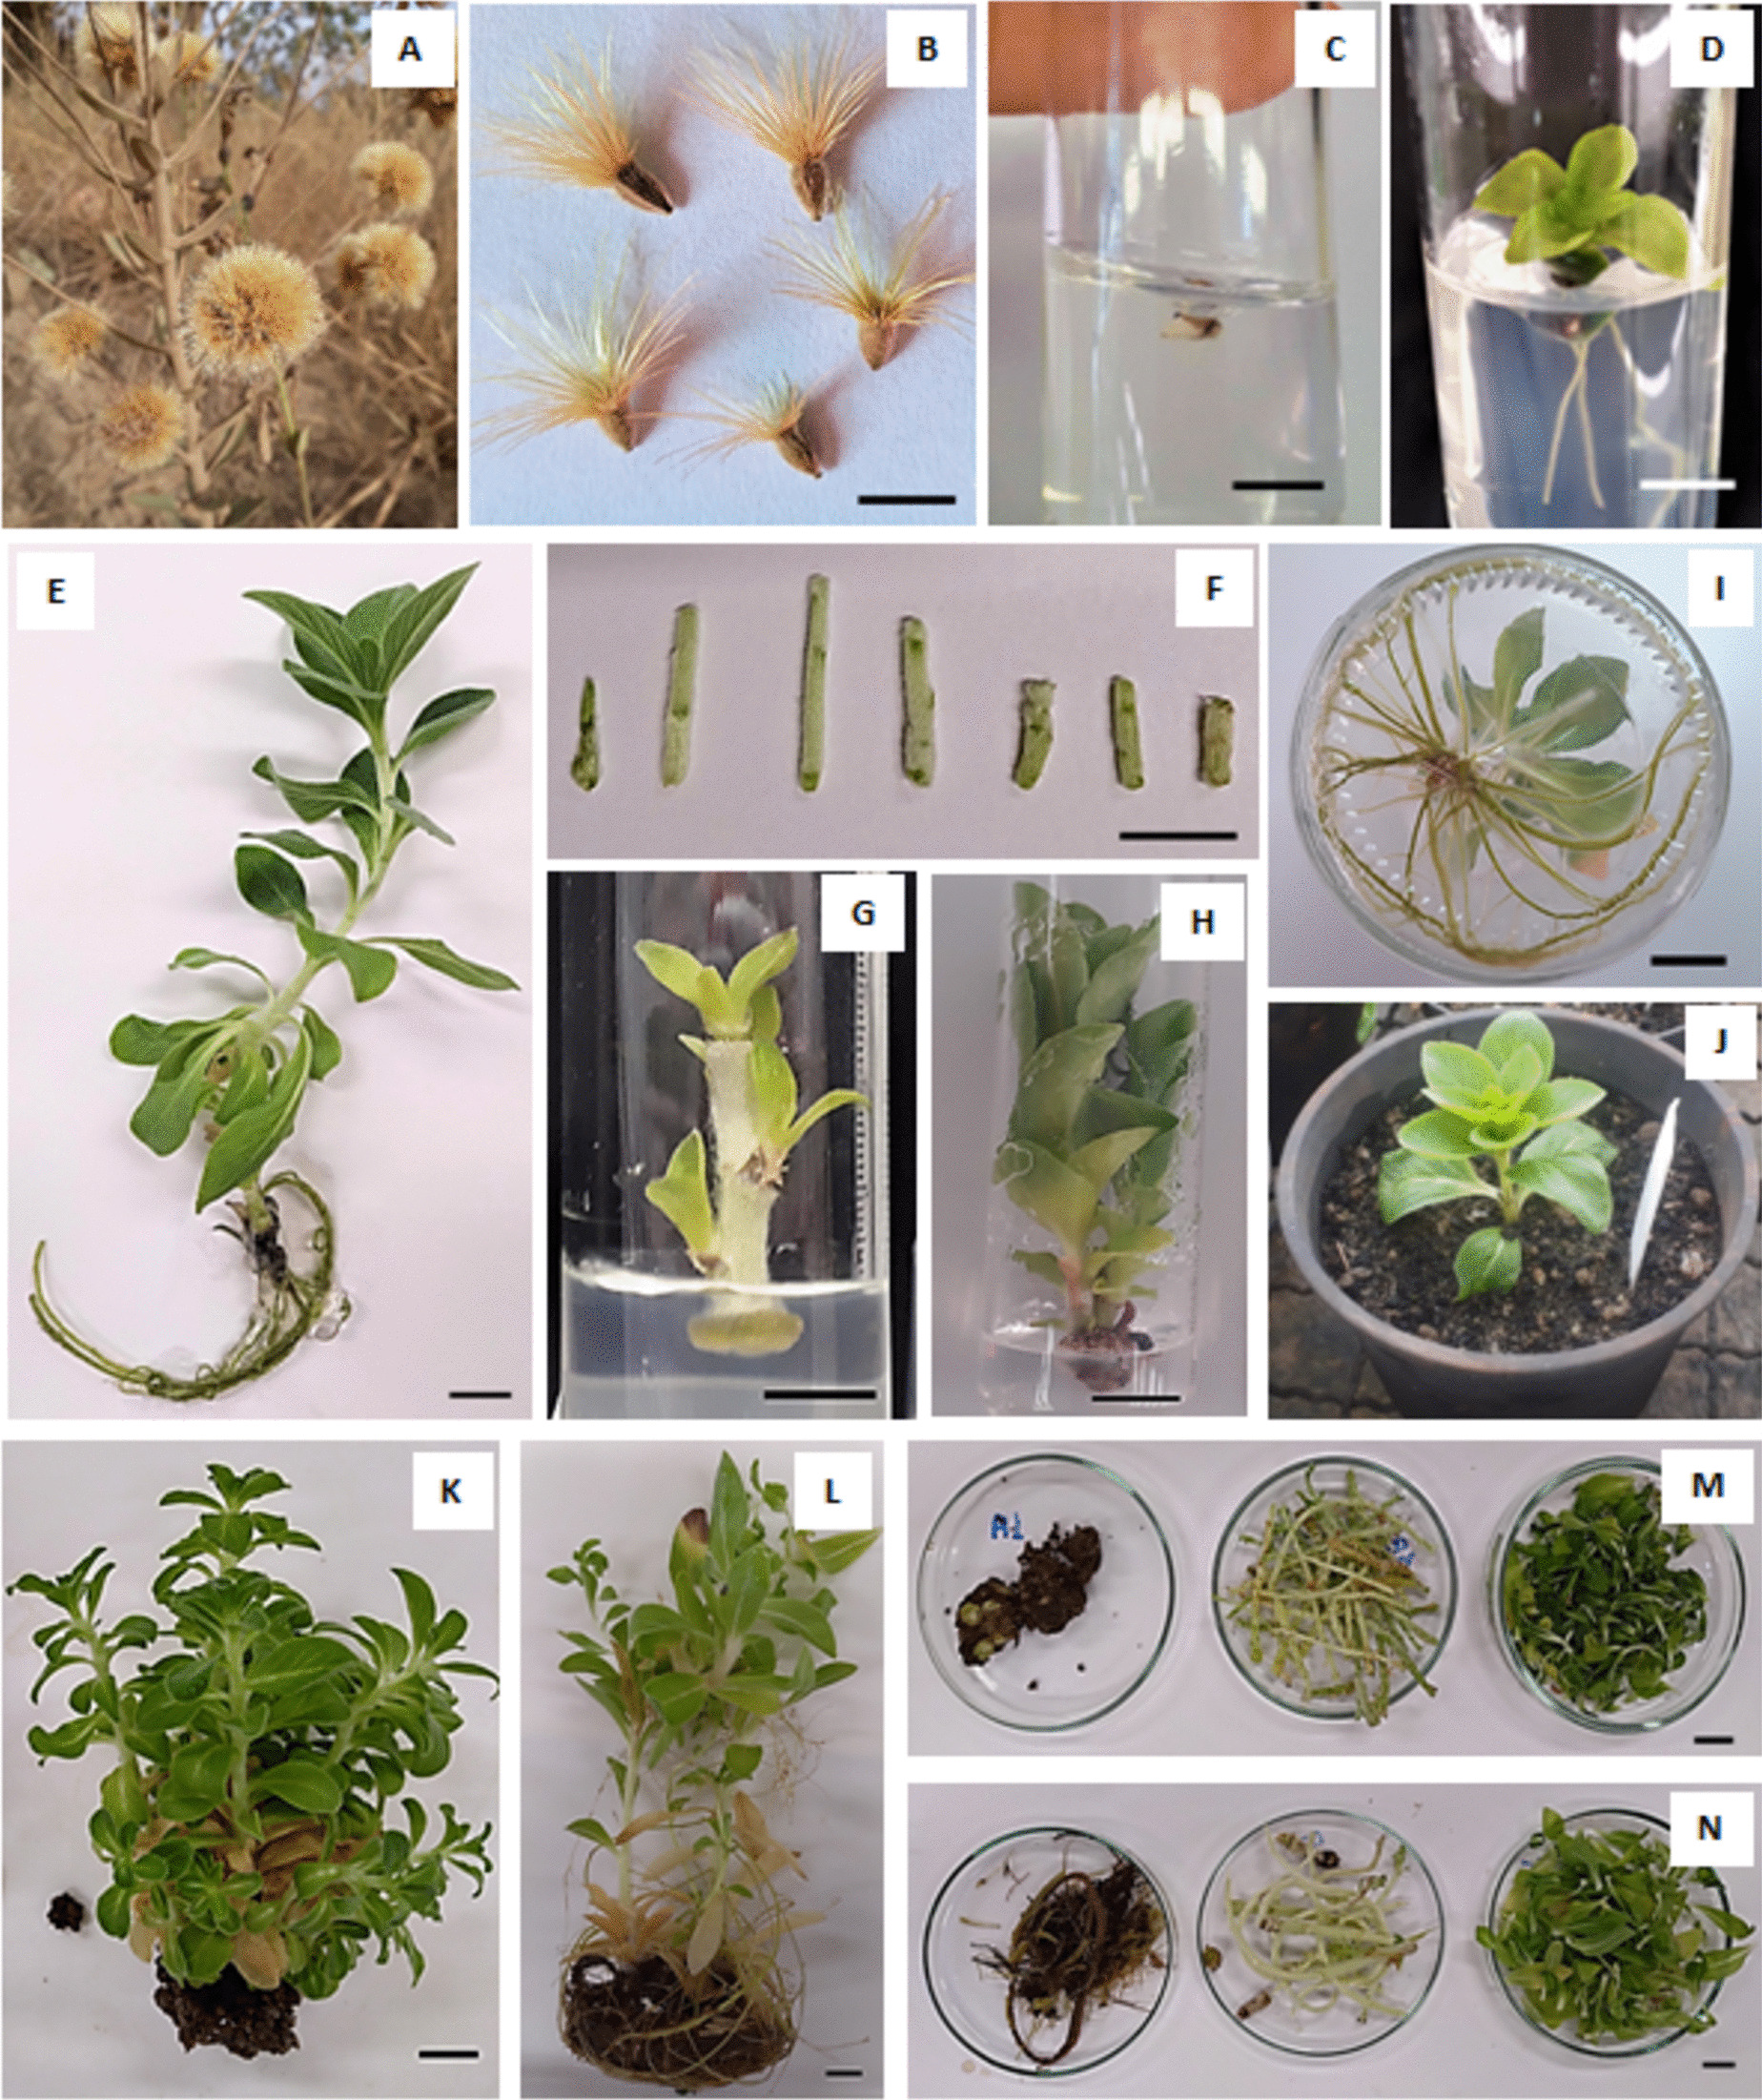
Figure 2.
Comparison of treated Dendrobium antennatum (Lindl.) plantlets on millimeter paper. A few individuals were randomly selected from the three treatments and the control to visually compare growth differences. The healthiest and most vigorous specimens are from the M1 treatment (30.0 g L−1 honey), while the M2 treatment (60.0 g L−1 honey) shows greater variability, with both well-developed and poorly growing plantlets.
Measurement of the biochemical stress regulatorsFor the measurement of proline, 4 × 100 mg frozen plant leaf samples were used as treatments. Four replicates of each of the four treatments were used, giving a total of 16 samples. The plant sample was ground in a mortar with 5.0 µL mg−1 of 3.0% sulfosalicylic acid. The resulting homogenate was centrifuged (5418 R, Eppendorf AG., Hamburgs Germany) at room temperature for 5 min at 14,000 rpm. To prepare the reaction mixture, the following were needed: 100.0 µL of 3.0% sulfosalicylic acid, 200.0 µL of concentrated acetic acid, 200.0 µL of acidic ninhydrin (Sigma-Aldrich, St. Louis, MO), and 100.0 µL of the supernatant of the centrifuged plant sample. Tubes were heated at 96 °C for 1 h to promote the reaction. The reaction was stopped using ice-cold water, and 1.5 mL of toluene per tube was used to dissolve the dye from the solution. The mixture was vortexed for 20 s for better mixing. The resulting supernatant was measured in a confined glass cuvette at 520 nm by spectrophotometer (GeneSys VIS-10, Thermo Fisher Scientific Inc., Madison, WI) (Ábrahám et al. 2010). The proline content was obtained by comparing the obtained light absorption values with the values of a known concentration series.
The determination of chlorophyll and carotene content was carried out according to the method of Arnon (1949) but slightly modified. Plant samples accurately measured on the analytical balance (Explorer®Pro 64, OHAUS Europe, Nanikon Switzerland) were homogenized with a small amount of quartz powder in 80.0% acetone and made up to a final volume of 5.0 mL. The solutions were centrifuged (5418 R, Eppendorf AG.) at 14,000 rpm for 5 min at room temperature, and the light absorbance of the supernatant was measured at 480 nm, 644 nm, and 663 nm. The total chlorophyll and carotene content of the samples was calculated from the light absorbance using the following formula:
chlorophyll a + b (µg g.−1) = (20.2 × A644 + 8.02 × A663) × 5.0 mL per measured weight (g)
carotene (µg g.−1) = 5.01 × A480 × 5 mL per measured weight (g)
Peroxidase enzyme activity was determined according to Kay et al. (1967). Frozen plant samples at − 37 °C were homogenized in ice-cold mortar with 1200.0 µL of K-phosphate buffer (pH = 6.5). The samples were centrifuged (5418 R, Eppendorf AG.) at 13,500 rpm for 20 min at 4 °C. For the measurement, 1650.0 µL of Na-acetate buffer pH 4.5, 30.0 µL of H2O2 diluted 1000-fold, 20.0 µL of orthodianisidine (3,3′-dimethoxybenzidine 10 mg mL−1) (Sigma-Aldrich) solution, and finally 50.0 µL of plant sample supernatant was weighed in glass cuvettes. Using a Genesis 10vis spectrophotometer at 460 nm, the change in light absorbance of the solution (deepening of the solution color) was measured every 10 s for 2 min. Enzyme activity was calculated using the following formula:
enzyme activity = (ΔA2 × Diluted)/ε [unit mL.−1]
where:
ΔA2 is the 2-min change in absorbance (the reading)
ε = 11.3 the extinction coefficient of orthodianisidine
The results obtained were converted to units mg−1 of the exact weight of plant tissue (Kay et al. 1967).
Statistical analysisPlant weight, shoot length, root development, proline content, pigment content, and peroxidase enzyme activity values were averaged for each treatment group. To determine whether observed differences among treatments were statistically significant, one-way analysis of variance (ANOVA) was employed. Following ANOVA, Duncan’s multiple range test was used as a post hoc comparison to identify which specific treatments differed significantly from one another. Duncan’s test was selected for its sensitivity in detecting pairwise differences in biological data where treatment effects are expected to vary. A 5% significance level (p < 0.05) was used throughout the analysis. The results were interpreted within this statistical framework to determine significant differences in plant growth parameters. All statistical analyses were performed using IBM SPSS software, ensuring robust evaluation of the experimental data.
Comments (0)