
Remember me
This was a single-arm pragmatic feasibility study, part of a larger project aimed at evaluating supramaximal HIT for older adults. A previously used programme [14, 15] was adapted in collaboration with exercise instructors. We used a convergent mixed-methods design [25] in which qualitative and quantitative data were collected and analysed in parallel [26] and thereafter integrated by the use of an analytical matrix (taxonomy) reflecting implementation outcomes [25]. The study was approved by the Swedish Ethical Review Authority (Ref. no.: 2022-06401-01), pre-registered at Open Science Framework [27], and the results are reported in accordance with the consolidated criteria for reporting qualitative research (COREQ) guideline [28]. In the pre-registration the sample size was determined to n = 26. The sample size calculation was based on a previous RCT showing a within-group change in maximal oxygen consumption of 1.4 (mL/kg/min), a standard deviation of 2.4 [15], 80% power and a 0.05 significance level. This sample size was not reached during the available time for recruitment and therefore only descriptive statistics were used.
Participants and recruitmentParticipants were both exercise participants and exercise instructors. Exercise participants were recruited with local advertisements through advocacy groups with interests in health for older adults and through the research group network. Eligible exercise participants were adults aged 65 years or older, at the time not involved in structured vigorous training, and with the ability to undertake a twice-weekly training programme for three months. Exclusion criteria were movement-related dysfunction, heart or lung conditions with exercise-induced symptoms, poorly controlled or untreated arterial hypertension, insulin-treated diabetes, or chronic and progressive neurological disease. Potential exercise participants provided written informed consent and underwent a medical examination led by an experienced cardiologist (BJ), including 12-lead electrocardiography and blood pressure, before inclusion.
Four exercise instructors were purposefully recruited through management using convenience sampling from the staff with permanent positions at a local training facility with 20,000 members and an extensive selection of group sessions. The selected instructors, comprising three women and one man, 37 to 53 years of age, and with 12 to 18 years of varied experience in group exercise instruction.
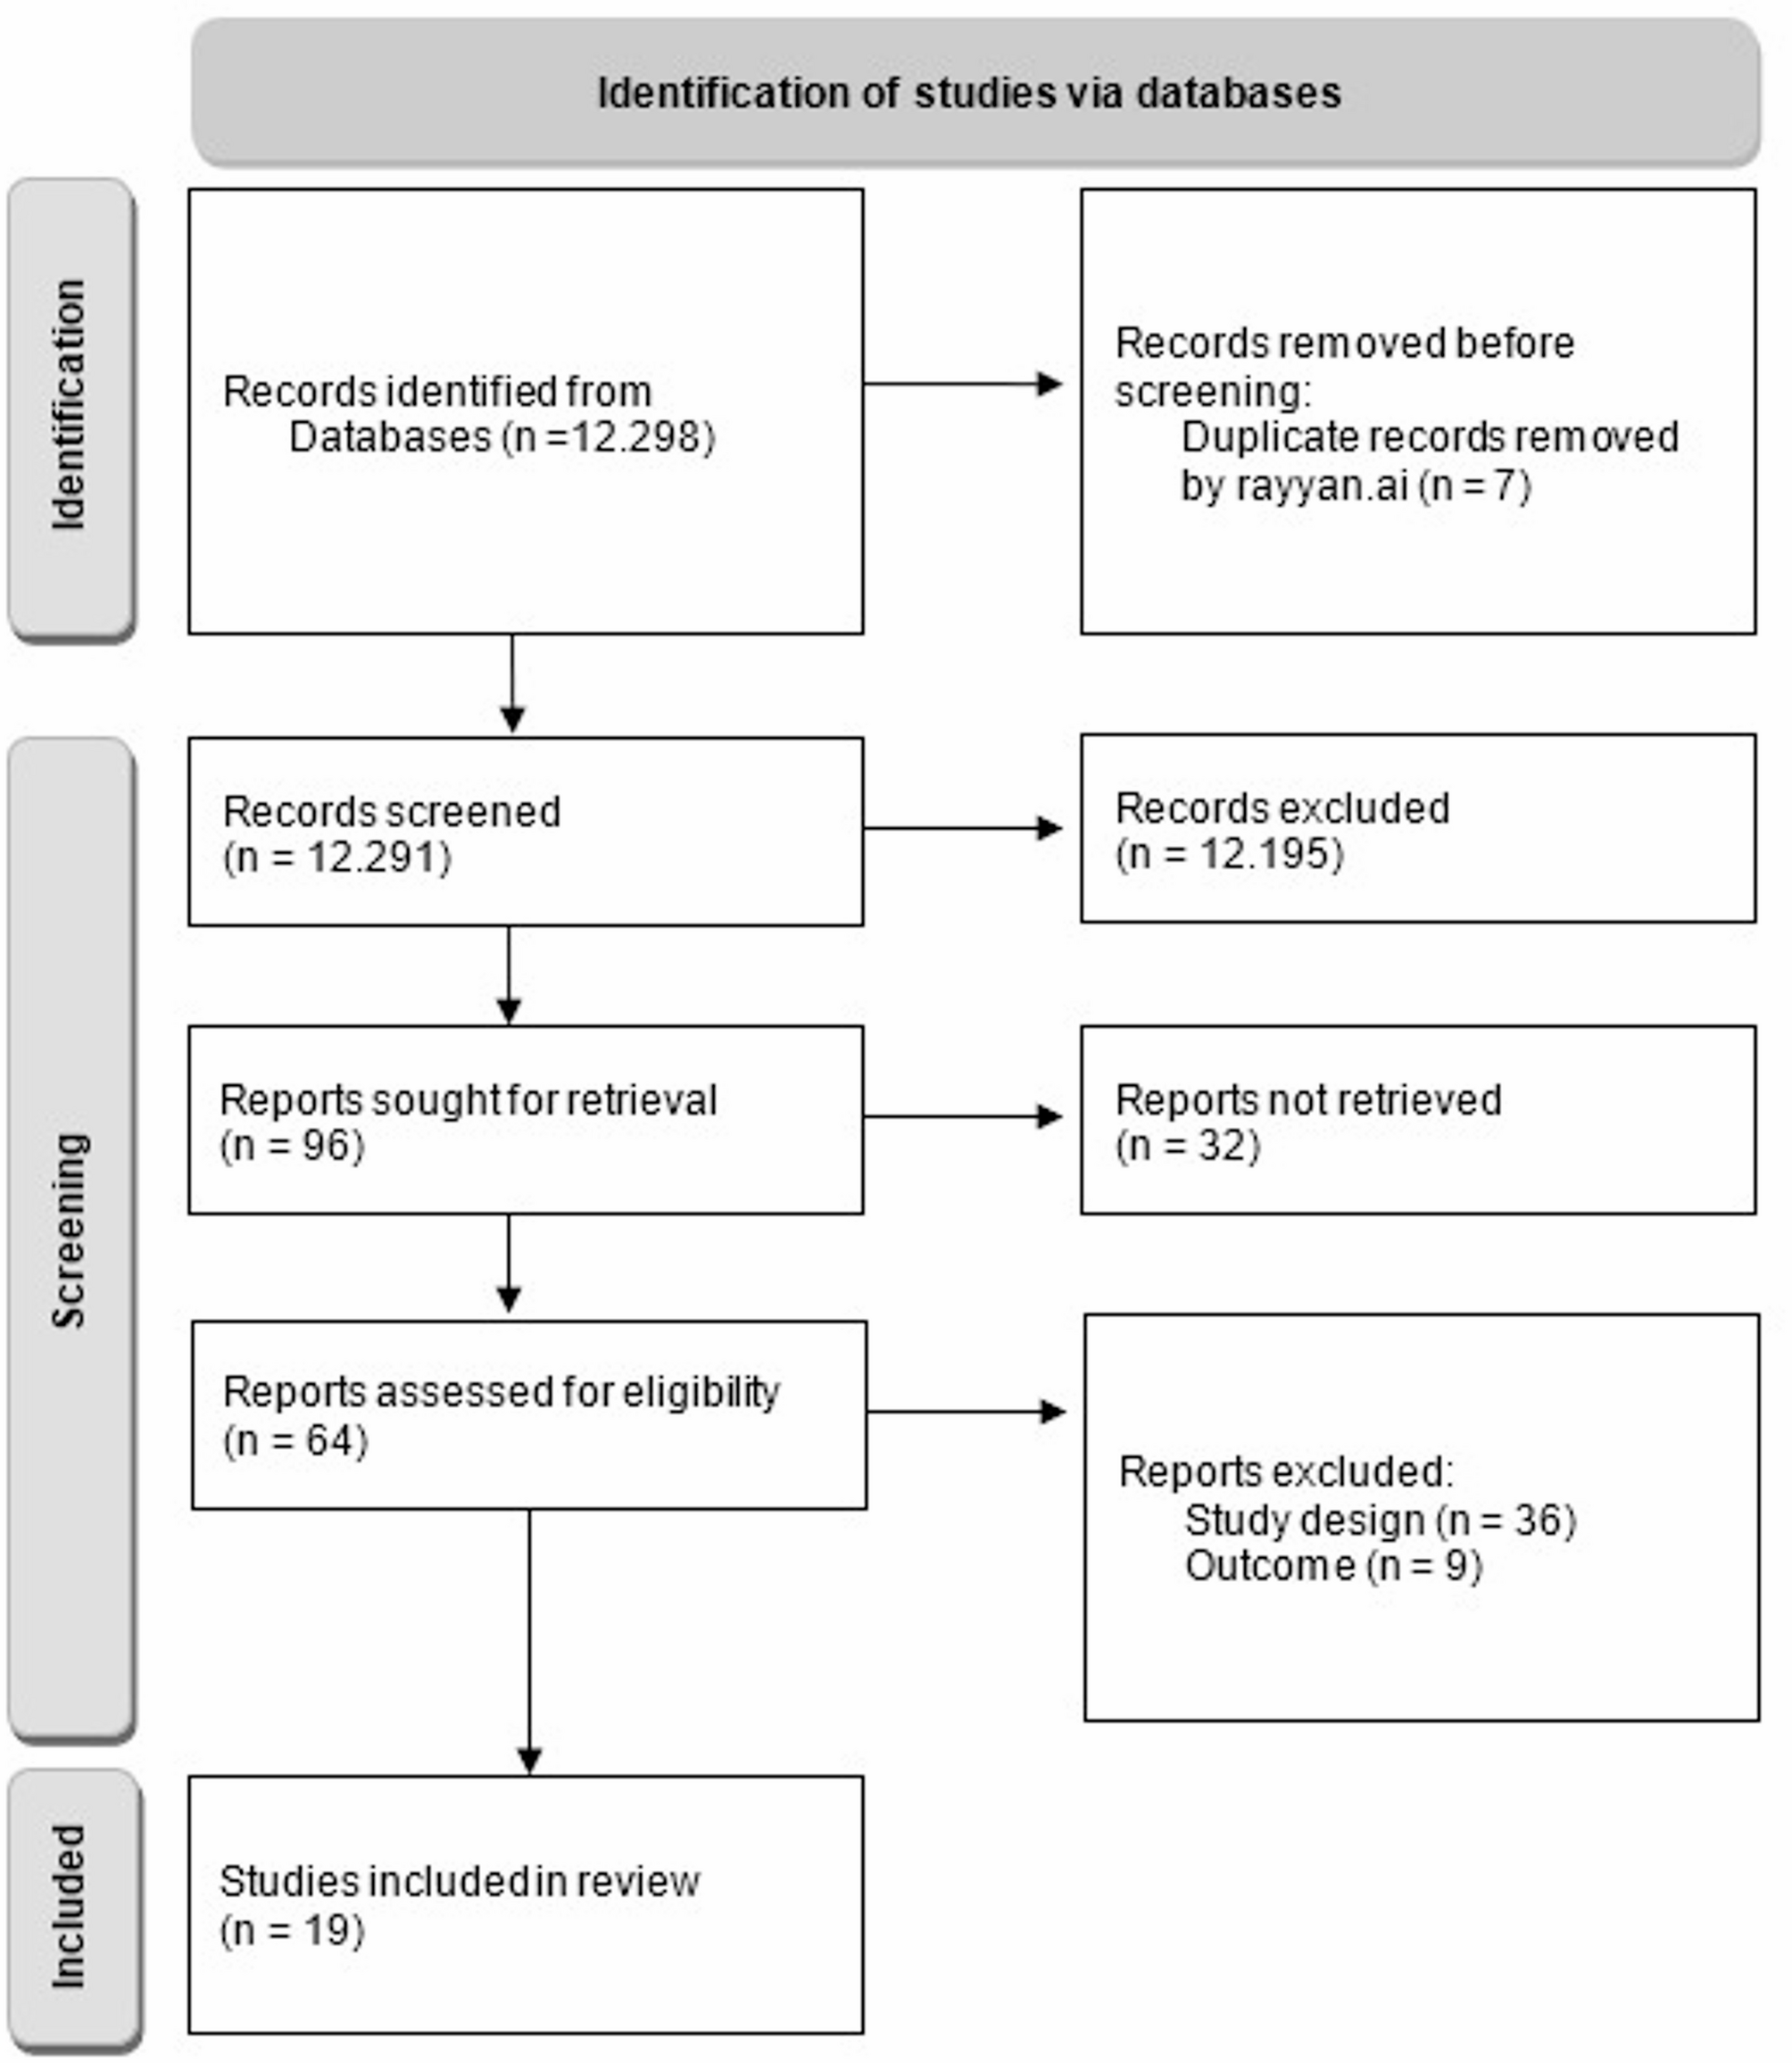
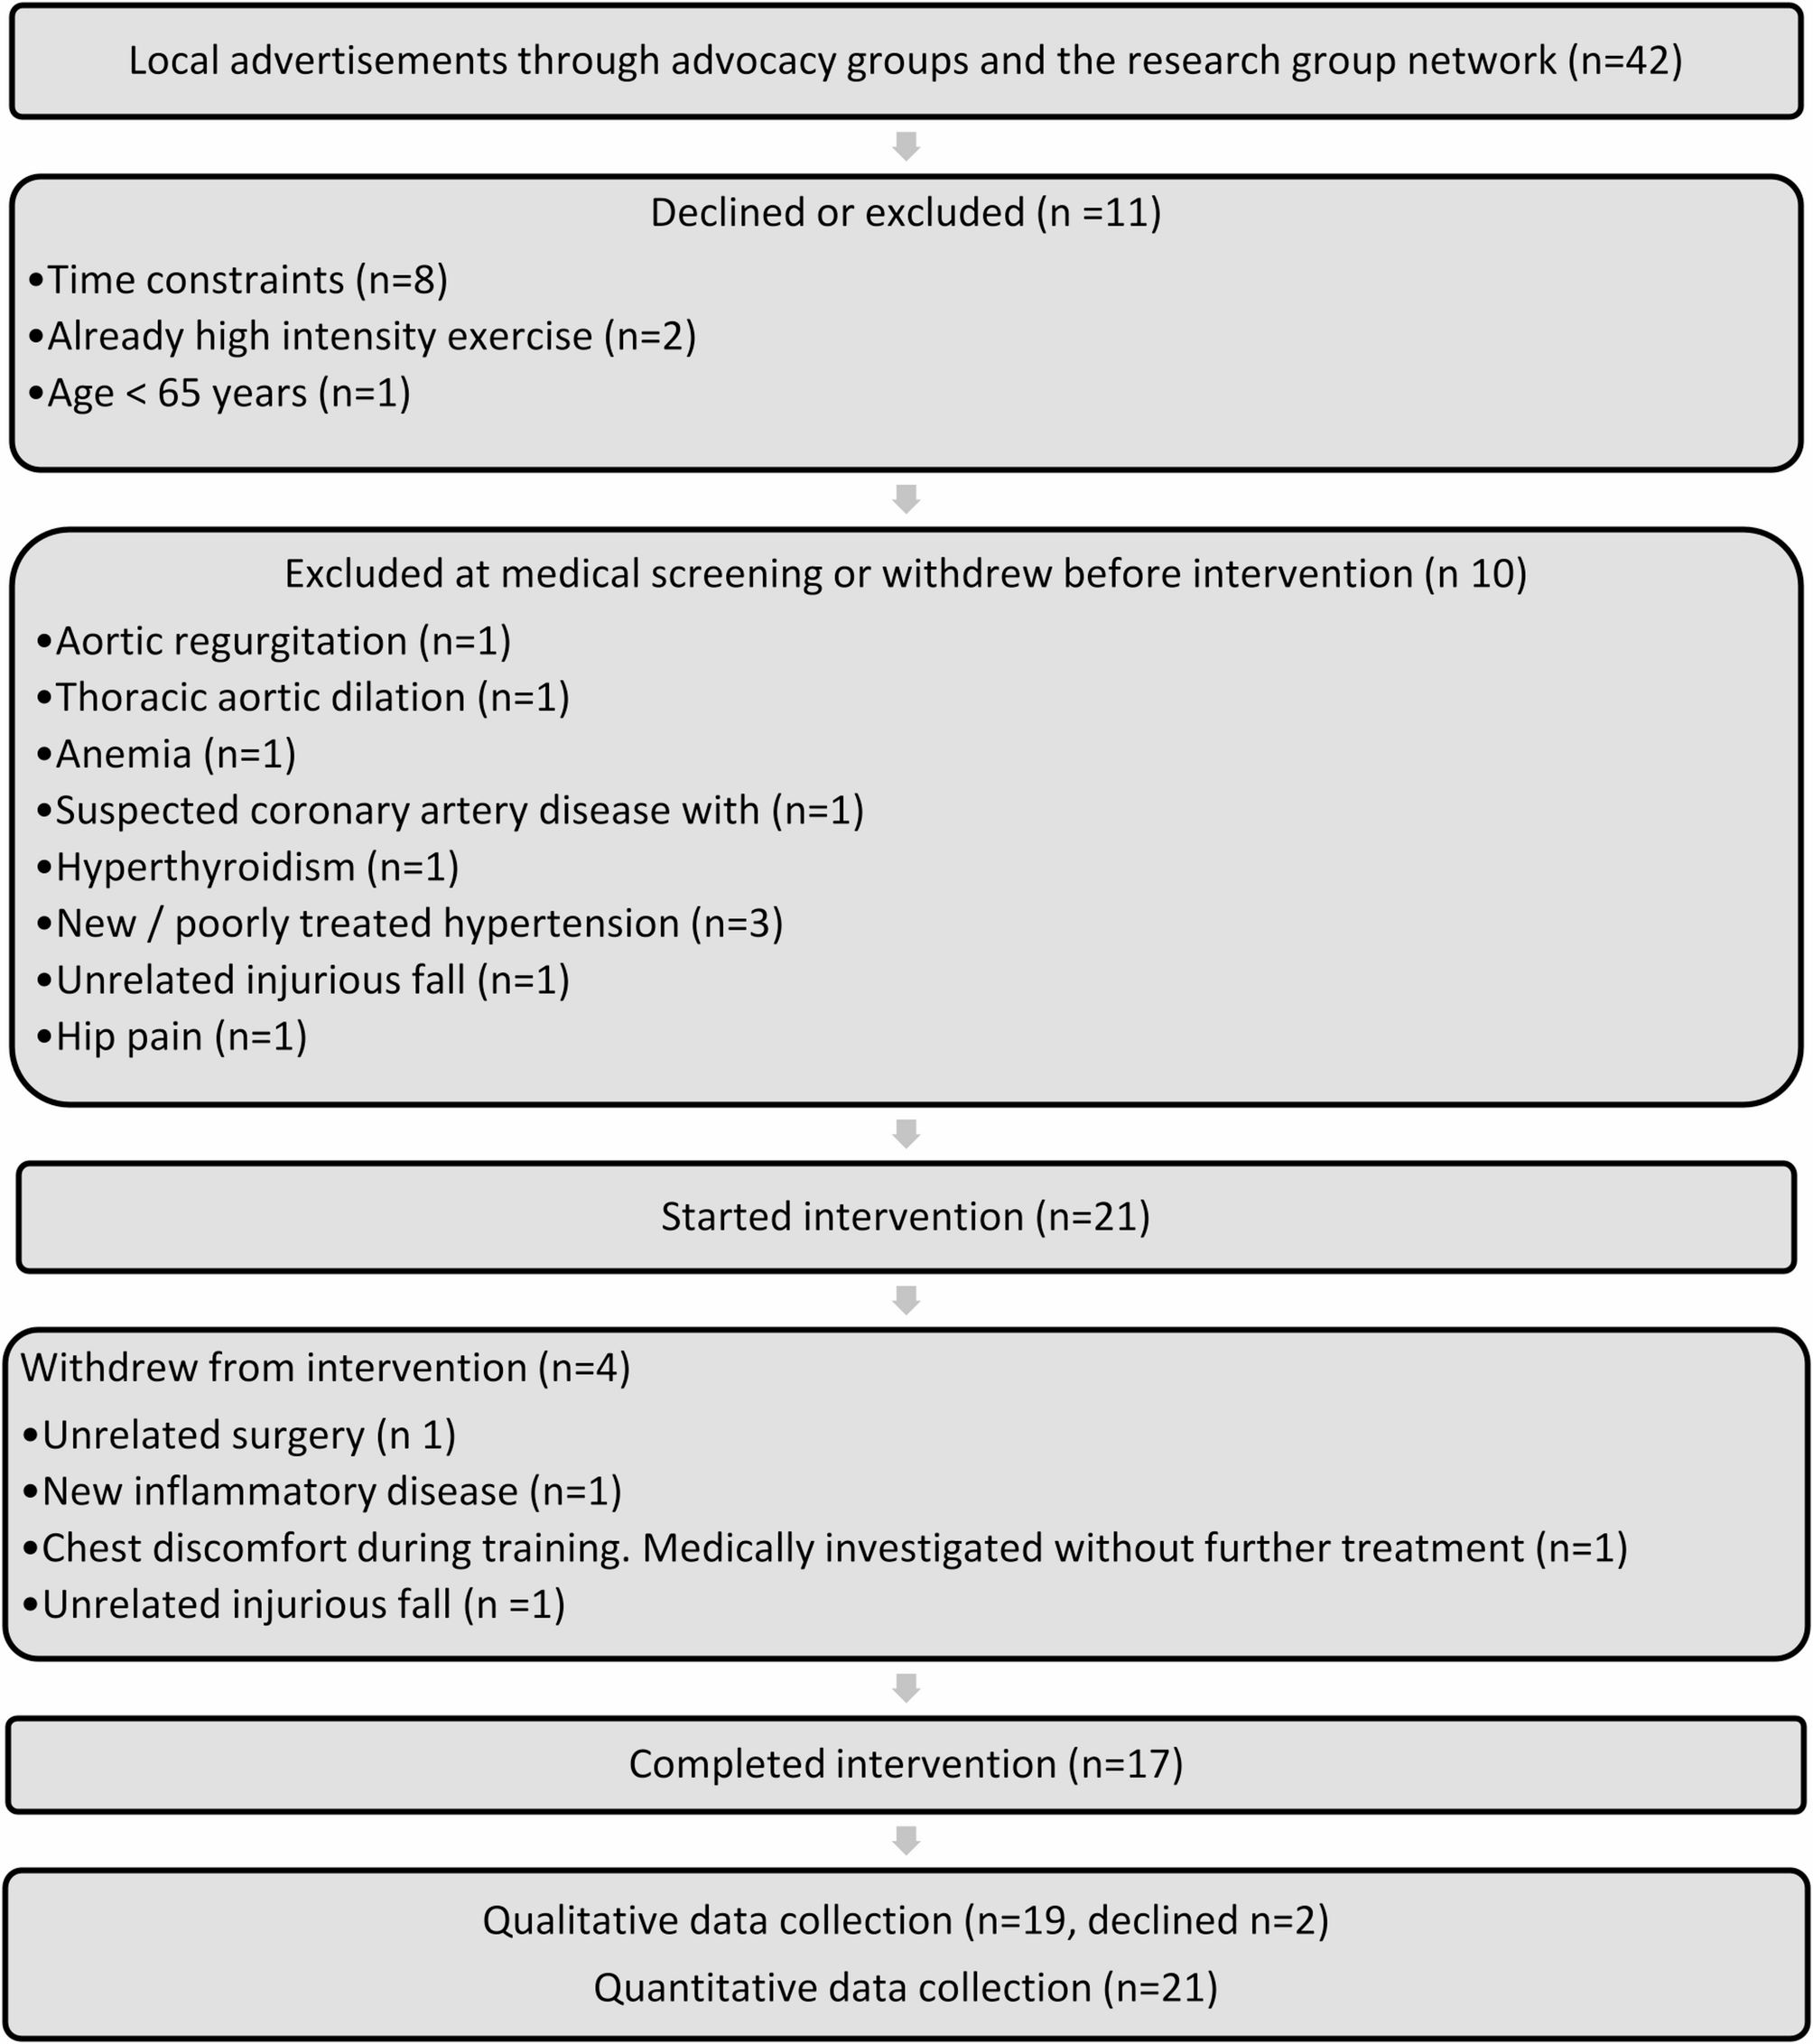
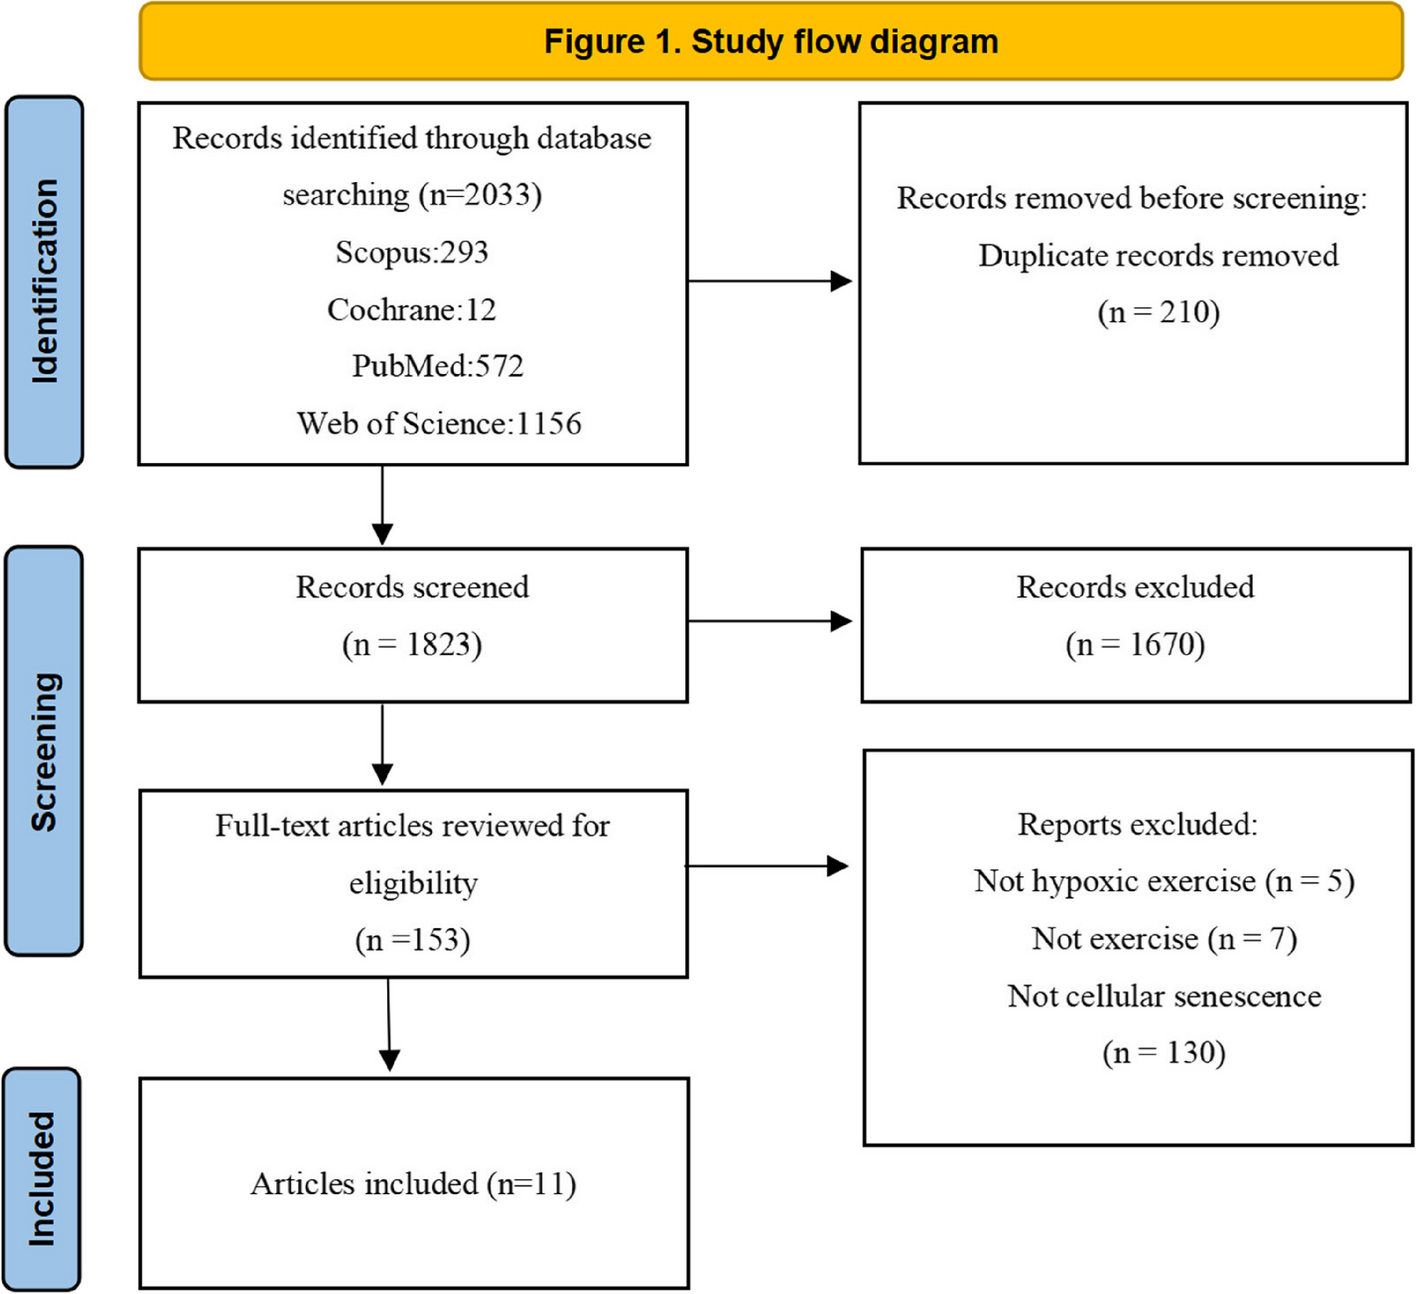
Figure 1 describes participant flow in the study and Table 1 describes participants at baseline. Twenty-one exercise participants (14 women and seven men) started the intervention and were divided into two exercise groups based on preferred time. Nineteen of 21 participants self-reported some exercise experience in adult age. Examples from an open-ended follow-up question were mixed and ranged in intensity from walking to various group training formats at training facilities and in recreational sport activities.
Fig. 1
Exercise participant flow
Table 1 Characteristics of exercise participants at baselineExercise interventionThe original supramaximal HIT programme was repeated twice weekly for a total of 25 sessions for three months. One session took 20 min and consisted of warm-up, cool-down, and ten 6-second intervals on indoor bicycles with 54 s of rest between intervals. The programme is described in detail in Simonsson et al. [15].
Core components kept from the original protocol [15] included the 6-second intervals, that exercise intensity was individually prescribed as external target power output in absolute watts, and was regulated by standardized pedal frequency and individual adjustment of the brake resistance. The interval target power output started at 60% of the participant’s maximum mean 6-second power output, estimated at baseline with a modified Borg Cycle Strength Test [29]. The intensity was the same for all the ten intervals within-session but was allowed to change, up or down, after each session by pre-defined criteria. To increase resistance, the participant should have (1) the ability to maintain standardized pedal cadence during the session and judge that one additional interval would have been possible to perform; (2) a rating of perceived exertion (RPE) less than ‘very hard’ [30]; and (3) a wish to increase intensity.
A notable pre-decided deviation from the original protocol [15] was the removal of support from two supervisors during training. In the previous study, the supervisors prepared the equipment, monitored the training, and collected data related to adherence and interval intensity, as well as change criteria. Between sessions, they adjusted interval intensity accordingly. In this study, the tasks were managed by the exercise participants themselves receiving only standard guidance typically provided by instructors during regular sessions at the training facility.
Up-skilling and co-design of the exercise programmeBefore the training intervention period, the exercise instructors from the training facility took part in one up-skilling session and one co-designing workshop. Up-skilling involved learning the core components of the supramaximal HIT programme [15]. After up-skilling, they were asked to participate in a co-designing workshop to further adapt the programme. The intention was to make the programme as applicable as possible within the context of the specific training facility.
The co-designing process involved developing the logbooks used, session planning and verbal instructions that could be personalized during exercise sessions, suitable music using the specific equipment, and regulations applicable to the setting. They also reduced the cool-down time (2 min) in favour of a longer warm-up (8 min) including brief increases in cadence and resistance, respectively (as opposed to the previously used constant load for 5 min). This was done for consistency with the interval nature of the rest of the session. The decision was made to keep a previously used visual timer screen but remove the sound to be able to provide more verbal instructions. The exercise instructors rotated to allocate 45 min of working time to each 20-minute session, with two sessions (for the two groups of participants) conducted back-to-back on Wednesday and Friday mornings.
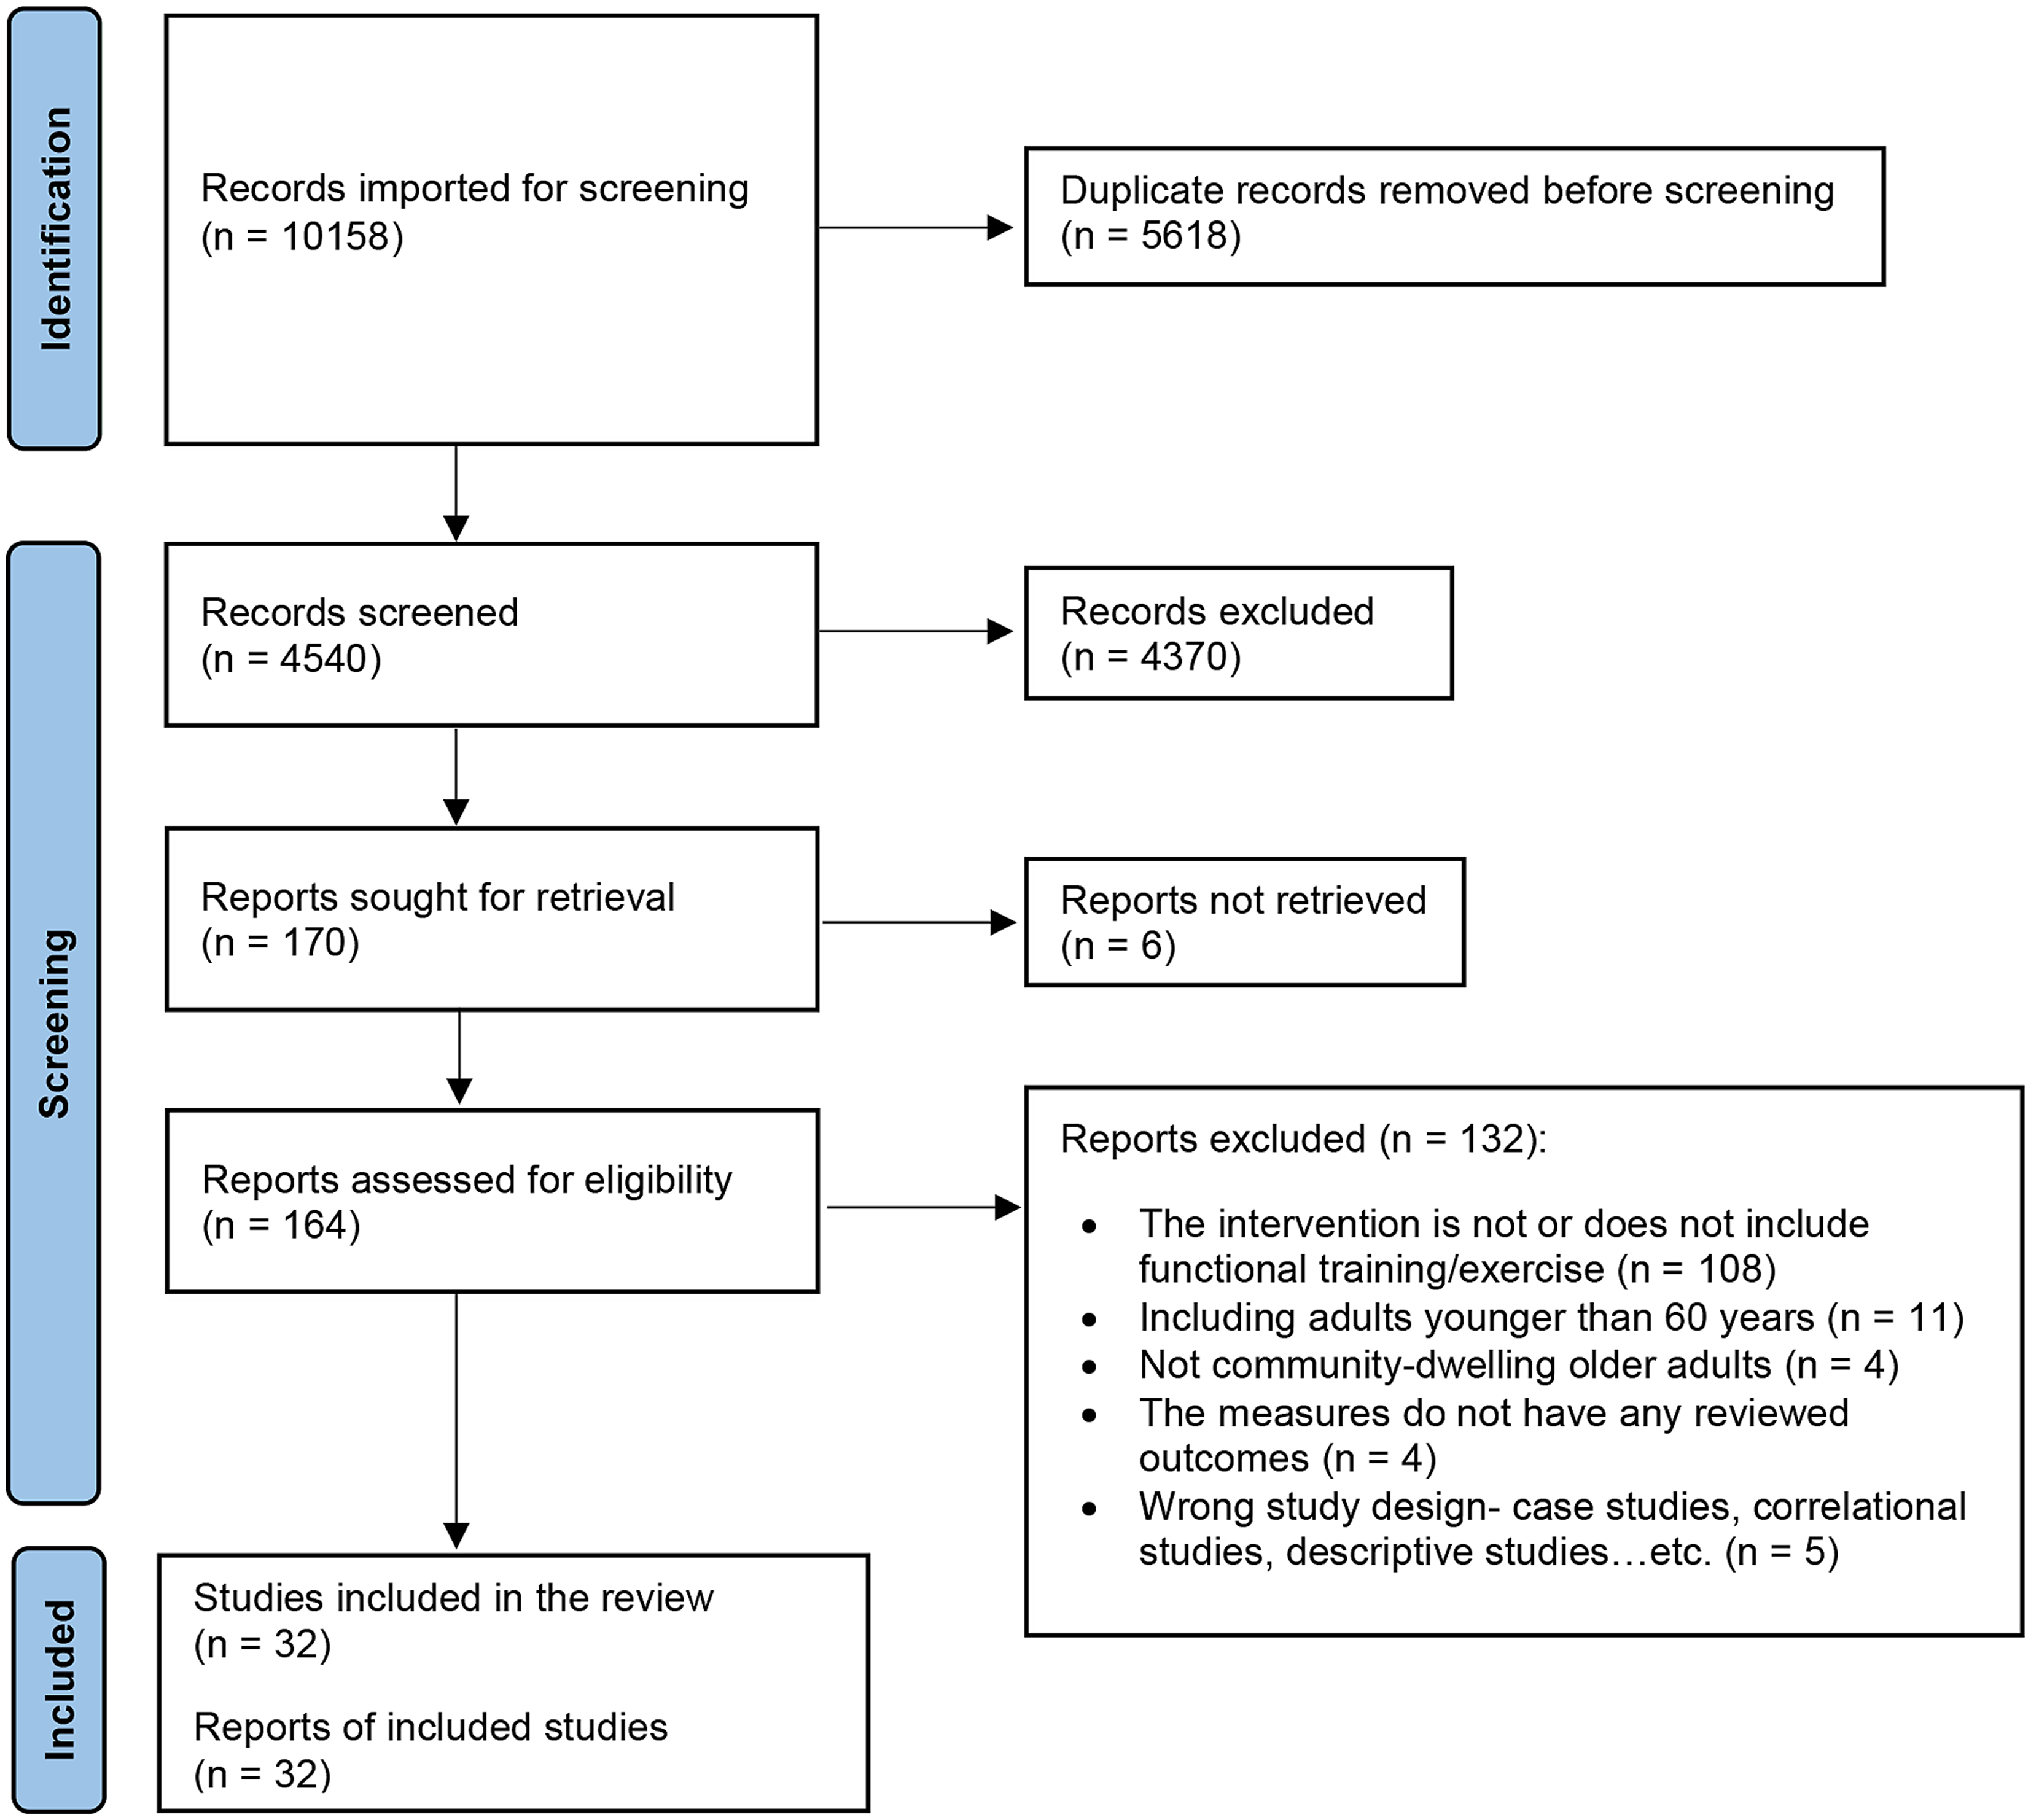
Data collectionMultiple methods were used for data collection. Interviews were used to address all research questions, complemented by questionnaires, physical tests, and observations. Thereafter were all data integrated in the analytical matrix (taxonomy) reflecting implementation outcomes. At the start of the study, descriptive data of participant characteristics were collected from both exercise participants and instructors through a questionnaire. Exercise participants also completed questionnaires assessing their exercise self-efficacy, exercise motivation, and physical activity, and conducted two physical tests. During the intervention period, researchers (BP and EF) conducted observations on two training sessions. Following the intervention, individual interviews were conducted (Fig. 2).
Fig. 2
Overview of the mixed-methods process, from data collection at baseline and follow-up, the intervention period (25 sessions over 3 months), and parallel analyses to integration of findings through a narrative weaving approach
Qualitative data collectionAll exercise participants who had started the intervention (n = 21) and all exercise instructors were invited to participate in an individual interview after the intervention. Nineteen exercise participants and all four exercise instructors accepted. The reasons for declining participation in the interview stemmed from a sense of not having engaged enough (n = 1) and ongoing medical evaluation (n = 1).
All the interviews were conducted by BP, who has expertise in qualitative interviewing. She had no relationship with the participants prior to the study and they were only informed that she was employed within the study. All interviews with the exercise participants were conducted in a lab environment designed as an apartment, which facilitated a relaxed interview environment. Three of the interviews with the exercise instructors were held in a conference room at their workplace, and one via video conference call. The interviews were conducted between May and June 2023. Interviews with the exercise participants lasted 20–80 min (median 46 min) and 34–49 min (median 45 min) with the exercise instructors. The interviews were all audio-recorded and transcribed verbatim by a professional transcriber.
Semi-structured interview guides with open-ended questions were used, one for the exercise participants and one for the exercise instructors. Both interview guides were informed by the taxonomy of implementation outcomes [24] and included questions about how the intervention was accepted and fitted into the context of a group training programme at the local training facility. In addition, they explored barriers and facilitators at both individual and organizational levels (Supplementary file 1). All interviews also explored the participants’ experiences of and attitudes toward the intervention.
Observations were conducted during sessions 17 and 18. On the first occasion, the focus was on group dynamics, including the role of exercise instructors, their support for participants, and participant interactions, as well as routines surrounding the exercise. The second occasion focused on whether participants followed instructions regarding cadence, resistance, and effort levels. Field notes from both observations were included in the qualitative analysis.
Quantitative data collectionAll quantitative pre- and post-data collection was done during one visit at each timepoint conducted by EF. The data collection was performed at an exercise lab (Umeå Movement and Exercise Laboratory), during two weeks before (pre) and after (post) the intervention. The visit lasted about one hour and was scheduled during daytime based on participant preferences. The timeline of the data collection followed the description below.
Maximal oxygen consumption was estimated using Ekblom-Bak tests conducted on a Monark cycle ergometer (Monark 839E, Monark, Vansbro, Sweden) with continuous heart rate monitoring (Polar H10 heart rate sensor, Polar, Kempele, Finland). Total duration of the test was 8 min, with an initial 4-min stage at a fixed work rate, directly followed by a higher individualized work rate for 4 min [31]. Maximal oxygen consumption was estimated using published equations that have been found to explain 86 and 83% of the variation (adjusted R-squared) in maximal oxygen consumption in men and women respectively with a coefficient of variation of 8.7% and standard error of the estimate of 0.28 L/min [31].
Physical activity was assessed with the Swedish National Board of Health and Welfare indicator questions regarding physical activity with categories and translated to activity minutes for interpretability [32]. The indicator questions have been shown to detect insufficient physical activity accessed with accelerometers with 63% sensitivity and 67% specificity in adults [32].
Exercise-related self-efficacy was assessed using the Swedish Exercise Self-Efficacy Scale (S-ESES) [33, 34]. The S-ESES contains 10 items with a four-point scale ranging from 1 (not at all true) to 4 (always true). The scores are summed together, ranging between 10 and 40, with higher scores indicating a stronger confidence in one’s ability to exercise. The S-ESES has in a Swedish sample shown very high-reliability with an intraclass correlation coefficient of 0.92 and standard error of measurement of 5.3 points [33].
Exercise-related motivation was assessed using the Swedish version of Behavioral Regulations in Exercise Questionnaire-2 (BREQ-2) [35,36,37]. This questionnaire consists of 19 items with a five-point Likert scale ranging from 0 (not true for me) to 4 (very true for me). First, a unit-weighted composite score was computed for each of the five factors. Second, a relative autonomy index (RAI) was calculated with the score from each factor weighted and summed, ranging from − 24 to 20, with higher scores indicating greater relative autonomy [36, 38]. An increase in relative autonomy has been shown to be indicative of future engagement in physical exercise [39].
Expectation of training adaptations was assessed with a single question, ‘Do you expect this form of training to improve your aerobic fitness?’, with a five-point scale ranging from 1 (No) to 5 (Yes, very much).
Maximal 6-second mean power output was estimated with a modified Borg Cycle Strength Test [29] using Tomahawk IC7 indoor bicycles (Indoor Cycling Group, Nürnberg, Germany). In our adapted version of the test, 30-second incremental work stages were intercepted with 30 s of active rest and continued until failure to complete a work stage or until a rating of ‘very hard’ on the Borg RPE scale [14, 30]. Partially completed stages were added to the highest completed stage proportionally to give a continuous result in watts [40]. The maximum 6-second mean power output was estimated as 1.75 times the 30-second performance [14]. In the original version the estimated maximal 30-second power had a correlation (Pearson’s r) of 0.90 to maximal performance [29].
After each session were exercise participants encouraged to note attendance, external target power output in absolute watts, use of escalation guidelines, ratings of perceived exertion [30], and any adverse event in a logbook and separate adverse event forms. The exercise participants could also select if the adverse event was related to by any or several of the following: general vitality, equipment, disease, musculoskeletal condition, cardiorespiratory condition, or emotional reactions related to the session itself. Adverse events were defined as serious if resulting in death, risk of death, hospitalization, disability or permanent damage, required an intervention to prevent disability or permanent damage, or other serious medical events. The logbook was analysed after the training period regarding target power output across sessions, peak RPE, and adverse events.
AnalysisWe used a taxonomy for implementation outcomes to deductively analyse and integrate qualitative and quantitative results, aiding the translation of our findings into terms relevant for future implementation. The taxonomy was developed by Proctor et al. [24] through synthesis of the literature and expert consensus. The taxonomy includes eight categories: acceptability, adoption, appropriateness, cost, feasibility, fidelity, penetration, and sustainability. It can be applied regardless of the underlying implementation theory, covering a wide range of outcomes [24]. Although participant perspectives are traditionally not included across all categories, we recognized the unique insights gained by incorporating both participant and instructor perspectives into each outcome. This approach enhances the relevance of our findings for practical implementation, particularly in promoting self-management within exercise interventions.
In line with the convergent mixed-methods design, qualitative and quantitative data were analysed in parallel after the intervention (Fig. 2) [26], and integrated through a merging approach [25]. This involved combining findings from both methods for overlapping concepts, such as presenting verbal expressions of exercise motivation alongside self-reported questionnaire data on the same topic [25]. Proctor et al.’s taxonomy of implementation outcomes [24] guided both the deductive qualitative analysis and its integration with the quantitative data. A qualitative inductive analysis generated subcategories, into which the relevant quantitative data were incorporated during the narrative phase of result presentation.
Qualitative analysis of the interviews and field notes employed a two-stage qualitative content analysis methodology: initially deductive guided by the taxonomy of implementation outcomes [24], followed by an inductive approach. Qualitative content analysis helped examine details in the data by highlighting differences and similarities within the codes and categories [41]. The deductive approach was used to explore pre-existing knowledge in a new setting [42], while the inductive method, guided by the data, helped us discover new insights by identifying recurring patterns and moving towards a deeper understanding within each construct of the used taxonomy [43].
Before the deductive phase, a coding sheet was established by the authors based on the taxonomy of implementation outcomes [24] (Supplementary file 2). The taxonomy includes eight categories, but the categories of cost and penetration were excluded from the coding sheet as these elements were not covered by the intervention. BP coded the material and concurrently sorted the codes according to the coding sheet.
After completing the deductive phase, an inductive stage was commenced to compare and contrast the codes, leading to the formation of subcategories within each category concerning the taxonomy of implementation outcomes. Data analysis was conducted using MAXQDA 2020 software. Throughout the analysis process, triangulation through ongoing discussions among four authors (BP, EF, MW, and NL) ensured consensus regarding both the coding sheet and the results of the analysis. Additionally, to enhance credibility, the four authors independently performed analyses on one interview each, subsequently discussing their interpretations collectively.
Quantitative analyses were done descriptively with R [44] and RStudio [45], using tidyverse packages [46].
Comments (0)