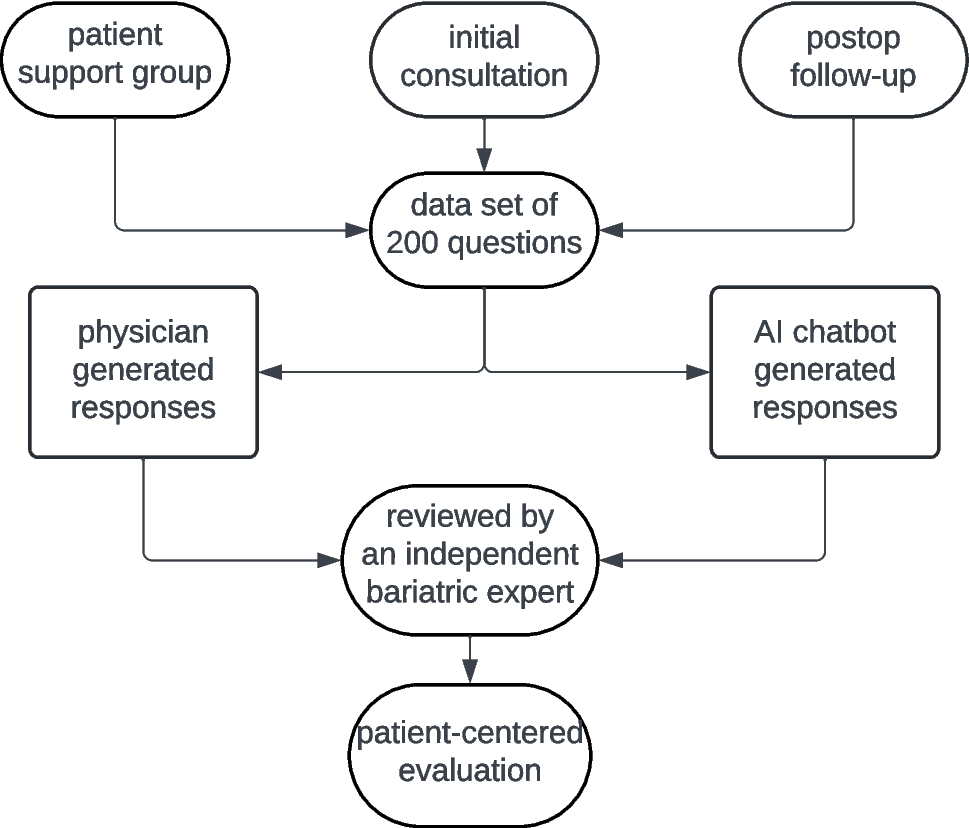
Question Source, Type, and Difficulty Level
Between January and May 2024, we collected 200 real-world questions related to bariatric surgery, among which 41 (20.5%) derived from patient support groups, 159 (79.5%) from initial consultation at the bariatric center and from follow-up visits after bariatric surgery. The bariatric experts categorized 97 questions (48.5%) as easy, 90 (45.0%) as medium, and 13 (6.5%) as hard based on medical complexity.
Generation of Quality of Responses
For all questions, human bariatric experts needed significantly more time to generate responses (219.1 vs. 8.7 min total). Time needed to generate responses varied by question difficulty: human experts needed 54.2 ± 34.9 s for easy, 81.5 ± 47.8 s for medium, and 125.9 ± 81.3 s for hard questions. In comparison, the LLM generated answers in 2.4 ± 1.6 s, 2.7 ± 1.3 s, and 3.0 ± 2.3 s, respectively (p < 0.0001 for easy and medium questions, p = 0.0002 for hard questions).
Human-generated responses were significantly shorter than LLM-generated answers measured by the number of characters (262.6 vs. 607.5, p = 0.001). This difference is present through all categories (easy: 161.7 ± 108.9 vs. 489.4 ± 278.6, p < 0.0001; medium: 281.6 ± 123.6 vs. 674.2 ± 369.9, p < 0.0001; hard: 344.5 ± SD 190.4 vs. 658.9 ± 335.6, p = 0.001 respectively).
Overall quality was rated on a 5-point Likert scale (1–5). For easy questions, LLM answers achieved the best score (5) more frequently than physician answers for both easy (89.7% vs. 61.9%, p < 0.0001) and medium questions (83.3% vs. 61.1%, p = 0.004). There were no significant differences in response quality for hard questions. However, both LLM and physician responses showed similar accuracy and completeness across all difficulty categories.
Correction of Responses
Based on the independent bariatric expert’s assessment, 13 (6.5%) of the LLM-generated responses required correction and 9 (4.5%) of the human expert-generated responses required revision.
Among the LLM-generated responses requiring correction, one of the answers was categorized as potentially dangerous for patients because critical information was missing (supplementary table S2). For physician-generated responses requiring corrections, 77.8% of corrections took less than 1 min and 22.2% 1–3 min. For LLM-generated responses needing correction, 15.2% required under 1 min and 84.6% 1–3 min.
Patient-Centered EvaluationParticipants’ Demographics
Of 189 participants who responded to the survey, 165 (87.3%) were females, with a mean age of 48.2 ± 11.2 years (range, 21–76). Regarding the self-reported highest educational qualification, 163 (86.2%) had secondary qualifications (19.6% lower, 48.7% intermediate, 18% college entrance qualification), 23 (12.2%) university degree (bachelor, master, doctorate), and 3 (1.6%) no formal qualification.
Response Quality Assessment
The best possible rating for the answer length was “3” (“1” was considered far too short, “5” was considered far too long). Regardless of the level of difficulty, LLM responses outperformed physician responses across all aspects: LLM responses were rated closer to the optimal length (3.4 vs. 2.4; p < 0.0001), clearer (4.8 vs. 4.6; p < 0.0001), more complete (4.5 vs. 3.4; p < 0.0001), and more empathetic (4.1 vs. 3.2; p < 0.0001) (Table 2).
Table 2 Patients’ rating of the length, clarity, completeness, and empathy of LLM and humans’ responses for all answersThe quality of physician responses improved when the question difficulty increased: the ratings were higher for empathy (3.3 vs. 3.0, p = < 0.0001), length (2.6 vs. 2.3, p < 0.0001), and completeness (3.6 vs. 3.3, p = 0.0003) for medium/hard questions when compared to easy ones. For LLM responses, there were no significant differences between the difficulty levels for the ratings (Table 3).
Table 3 Patients’ ratings of the length, clarity, completeness, and empathy by the difficulty level of the questionsDemographic Influences
Gender significantly affected response preferences. Women gave higher ratings to LLM responses for empathy (4.1 vs. 3.9, p = 0.008), clarity (4.8 vs. 4.7, p = 0.0003), and completeness (4.6 vs. 4.4, p = 0.02). Men rated physician responses significantly higher for empathy (3.3 vs. 3.1, p = 0.02), length (2.6 vs. 2.3, p = 0.003), and completeness (3.6 vs. 3.4, p = 0.004).
Educational background also influenced preferences. Lower-educated participants rated physician responses higher for empathy, length, and completeness, while higher-educated participants gave better ratings to LLM responses for completeness (Table 4).
Table 4 Patient ratings of the length, clarity, completeness, and empathy by gender and educational levelOverall, 64.9% of participants preferred LLM-generated responses, 18.5% favored physician responses, and 16.6% rated both equally.

Comments (0)