2.1 Study design
An analytical cross-sectional study was conducted among 368 adults at PHCs in Makkah, Saudi Arabia who agreed to sign a written informed consent. The study took place between March and June 2023.
2.2 Sample size
The sample size was calculated using a standard cross-sectional calculation [18]: n = [Zα/22P (1-P)]/d2, where the Z value corresponds to the anticipated level of confidence (Z = 1.96 for a 95% confidence interval (CI)), P is the probable prevalence (P = 0.4 [19]), and d is the precision level (d = 0.05). A total of 368 respondents were required to gain a 95% confidence interval.
2.3 Sampling technique
Makkah city is divided into four districts: north, east, west, and south. A cluster random sampling technique was applied, with two PHCs randomly selected from each district, resulting in a total of eight PHCs. A systematic random sample was taken from these centers by selecting every fifth patient from the registration list to ensure a representative sample. The interval was determined based on the total number of patients and the required sample size. Patients were enrolled equally across all centers until the target sample size was achieved. To secure approval for the research, the researcher engaged with PHCs management, providing a comprehensive explanation of the study’s objectives and methodology.
2.4 Study tools2.4.1 Questionnaire
Data were collected using a structured and pre-validated questionnaire to assess factors associated with obesity and the participants'awareness, attitude, and practice related to it. The questionnaire was adapted from previous studies [20, 21] The questionnaire consisted in total of four sections. Section 1 inquired about sociodemographic data and variables linked to obesity, including age, gender, marital status, family history of obesity, chronic illnesses, history of hormone disruptions, smoking, current behaviors, and dietary habits. Section 2 included questions that assessed participants’ awareness of obesity, such as the definition of the normal BMI of an adult, its risk factors, and the burden of obesity on health. Section 3 addressed the participants’ attitudes toward obesity, including perceptions of obesity as a disease and attitudes toward body weight and shape. Section 4 included questions on the participants’ dietary modifications, patterns of water intake, sleep habits, and exercise routines. The awareness, attitude, and practices part of the questionnaire included eighteen items across three categories. The awareness section included seven items, focusing primarily on participants’ awareness of the risk factors and complications related to obesity. The attitude section consisted of four items aimed at evaluating perceptions of obesity and motivation for weight loss. The body weight-related practice component of the tool comprised seven questions about eating habits and physical activity.
The validity of the questionnaire was assessed using content and face validity. Content validity addresses all significant parts of the questionnaire based on previous studies, while face validity is determined by expert judgment. In addition, we conducted a pilot study with a small sample of the target population to ensure its suitability in the current situation, and minor changes were made based on feedback from the pilot study.
The reliability of the questionnaire was analyzed using Cronbach’s α analysis, which yielded a value of 0.79 for the questionnaire as a whole. The independent Cronbach’s α values for the awareness, attitude, and practices domains were 0.78, 0.77, and 0.70, respectively. The analysis confirmed acceptable internal consistency and reliability.
Scoring system for awareness, attitude, and practices towards obesity
The scoring system for evaluating awareness, attitude, and practices related to obesity was structured as follows. Each section’s overall score was calculated by summing the correct responses. Awareness scores were categorized as “good” or “adequate” if they reached or exceeded 75% of the total possible score, whereas scores below this threshold were classified as “poor.” In parallel, an attitude was deemed “favorable” if the score was 75% or higher of the total attitude score. Likewise, practice was considered “adequate” if the score was 75% or higher of the total practice score [22, 23].
2.4.2 Anthropometric measurements
Weight and height were used to calculate BMI.
Weight and height measurements
The participants’ weights were determined using a properly calibrated digital scale. They were instructed to wear light clothing and stand barefoot and upright on the scale. Height was measured using a calibrated stadiometer, which provides a precise reading. Participants were asked to remove their shoes and stand upright with their heels together, back straight, and head in a neutral position. The measurement was taken to the nearest centimeter, ensuring that the participant was looking straight ahead and not slouching. This standardized approach helped to minimize variability and provided consistent data for analysis. The weight and height were rounded to the closest 0.1 kg (kg) and 0.5 cm (cm), respectively [24].
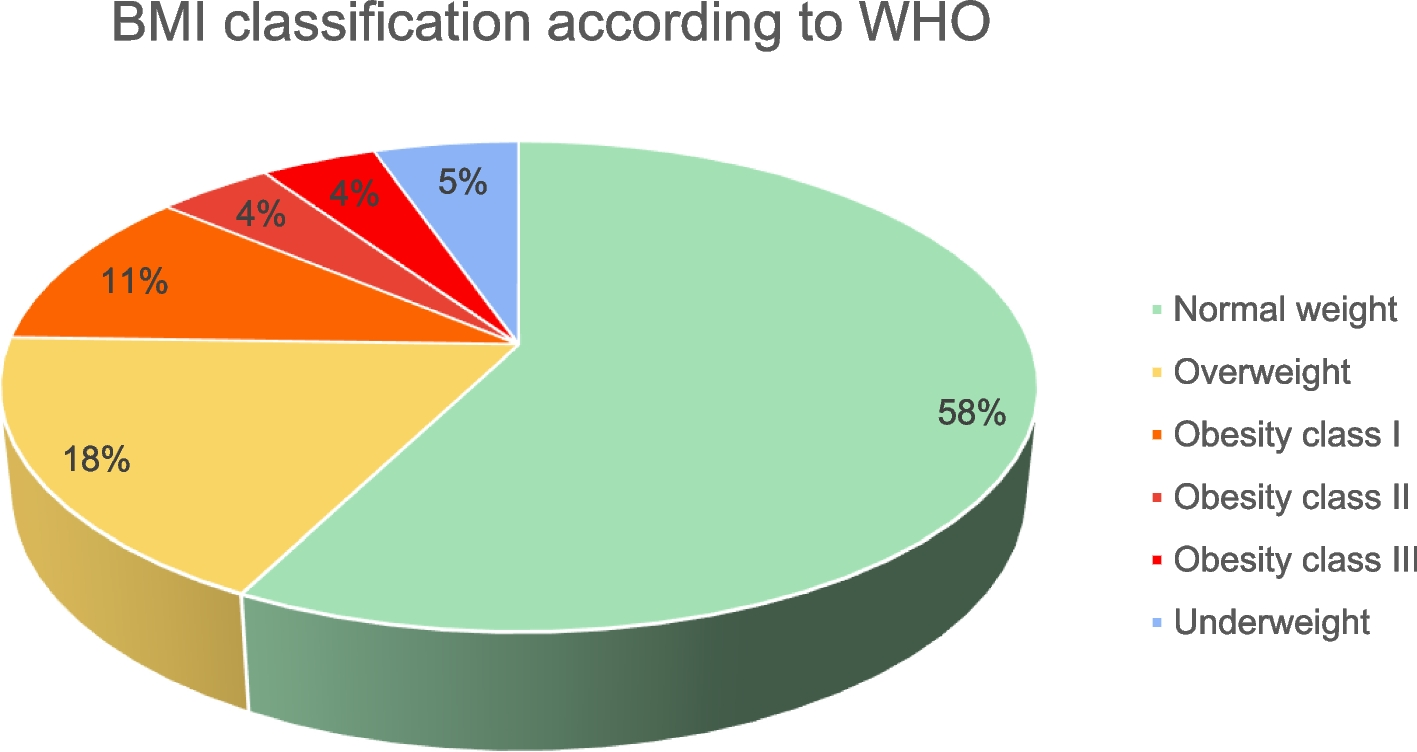
Estimation and classification of body mass index
The BMI was calculated by dividing weight in kg by height in m2. The WHO’s classification method was used to categorize BMI and obesity [25]. According to this classification, individuals with a BMI of less than 18.5 kg/m2 are considered underweight. Those with a BMI between 18.5 and < 25 kg/m2 are classified as having a normal weight. Individuals with a BMI between 25 and < 30 kg/m2 are considered overweight. Those with a BMI of ≥ 30 kg/m2 are considered obese. Class I obesity includes individuals with a BMI between 30 and < 35 kg/m2. Class II obesity includes those with a BMI between 35 and < 40 kg/m2. Class III obesity refers to individuals with a BMI ≥ 40 kg/m2 [26].
2.5 Statistical analysis
The data were analyzed using the SPSS package, version 25. For presenting sociodemographic characteristics, factors associated with obesity, awareness, attitude, and practices regarding obesity, frequency and percentage were used for categorical variables, and the mean, and standard deviation (SD) were utilized to present quantitative variables. To determine the relationship between sociodemographic and other associated factors and obesity, the chi-square test was used for qualitative variables, and the Student’s t-test was used for quantitative variables. In addition, logistic regression was conducted for multivariate analysis to estimate odds ratios (OR), while 95% confidence intervals (CI) were utilized to identify predictors of obesity. Statistical significance was defined as a p-value less than 0.05.


Comments (0)