
Remember me
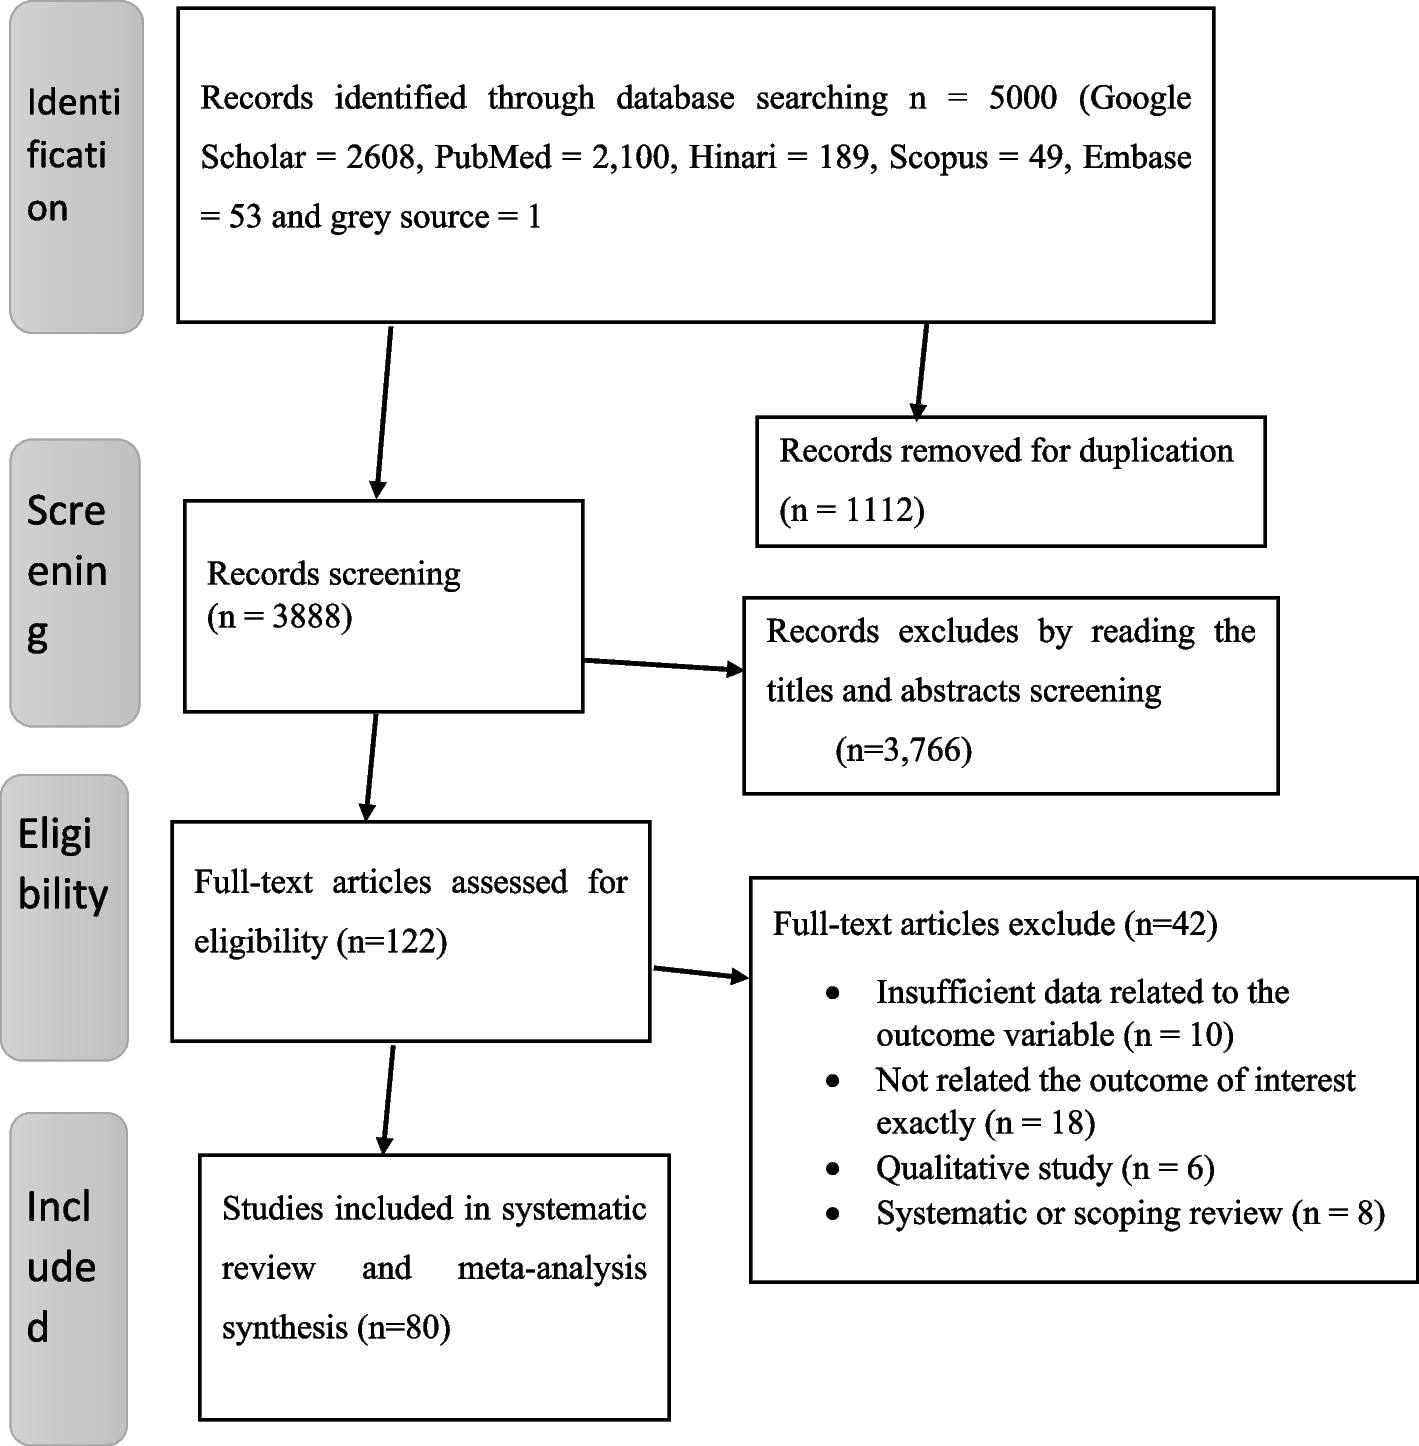
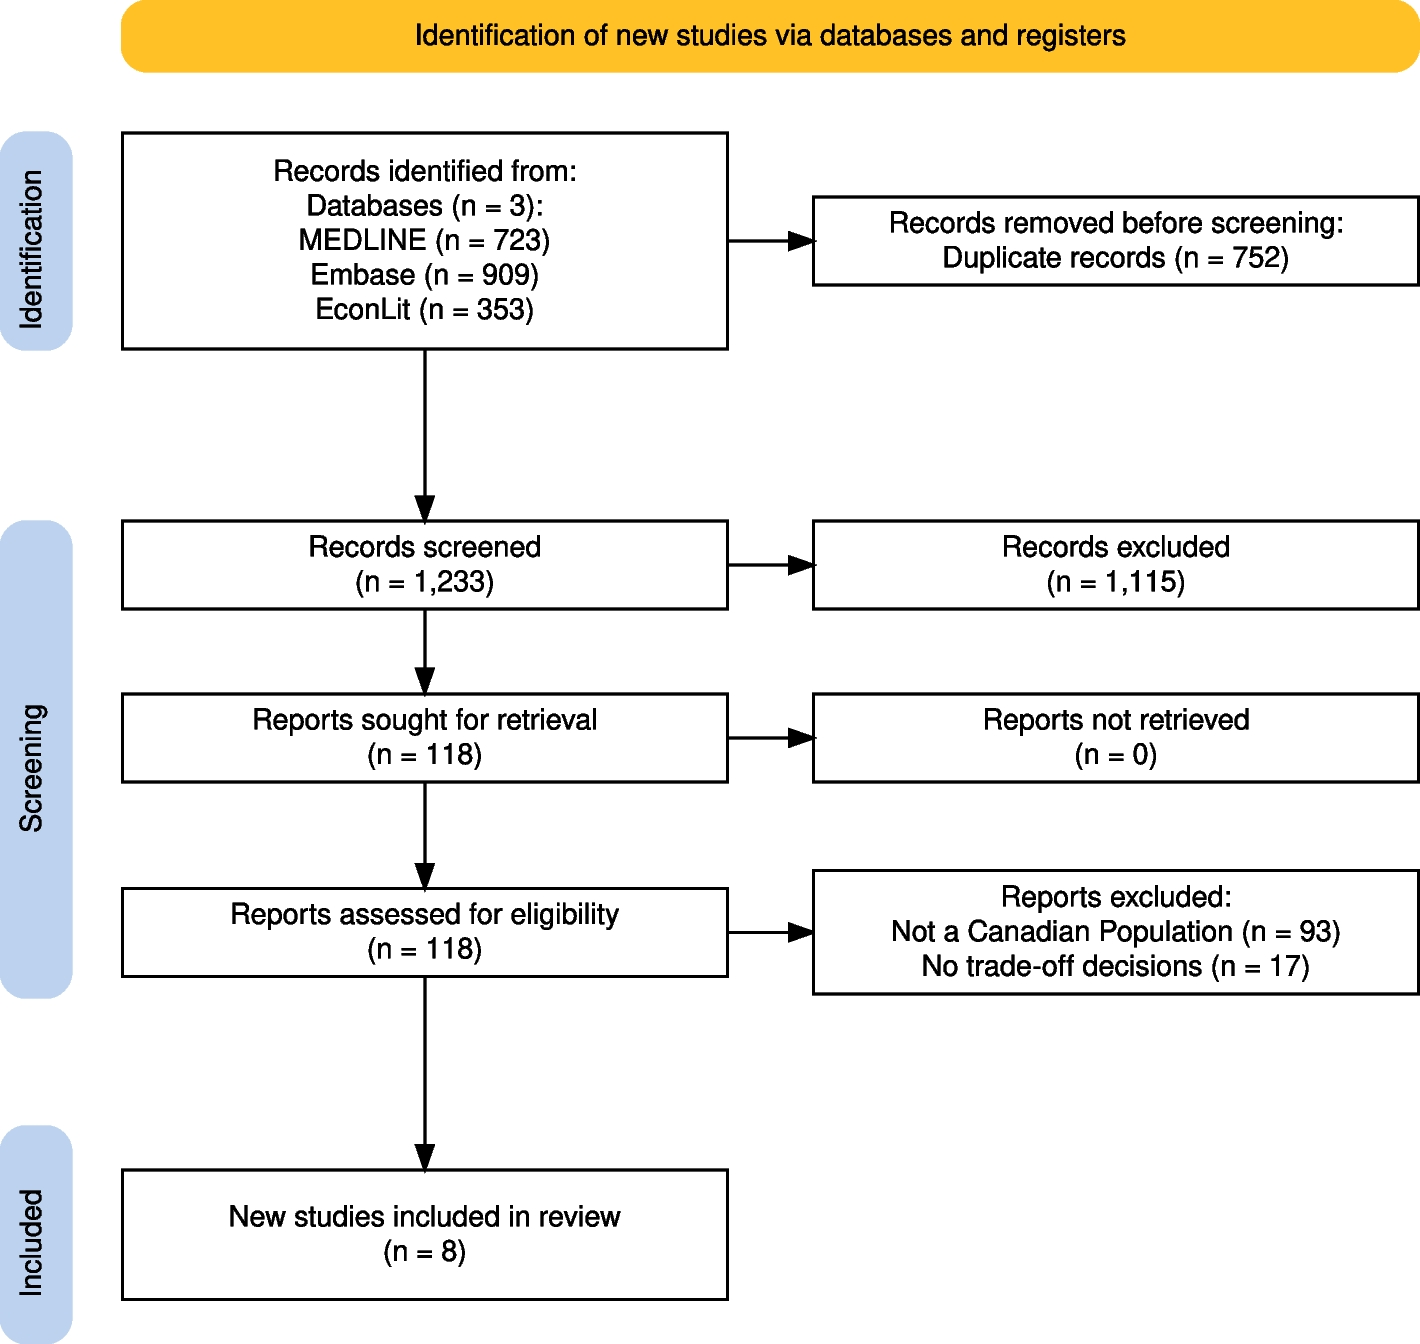
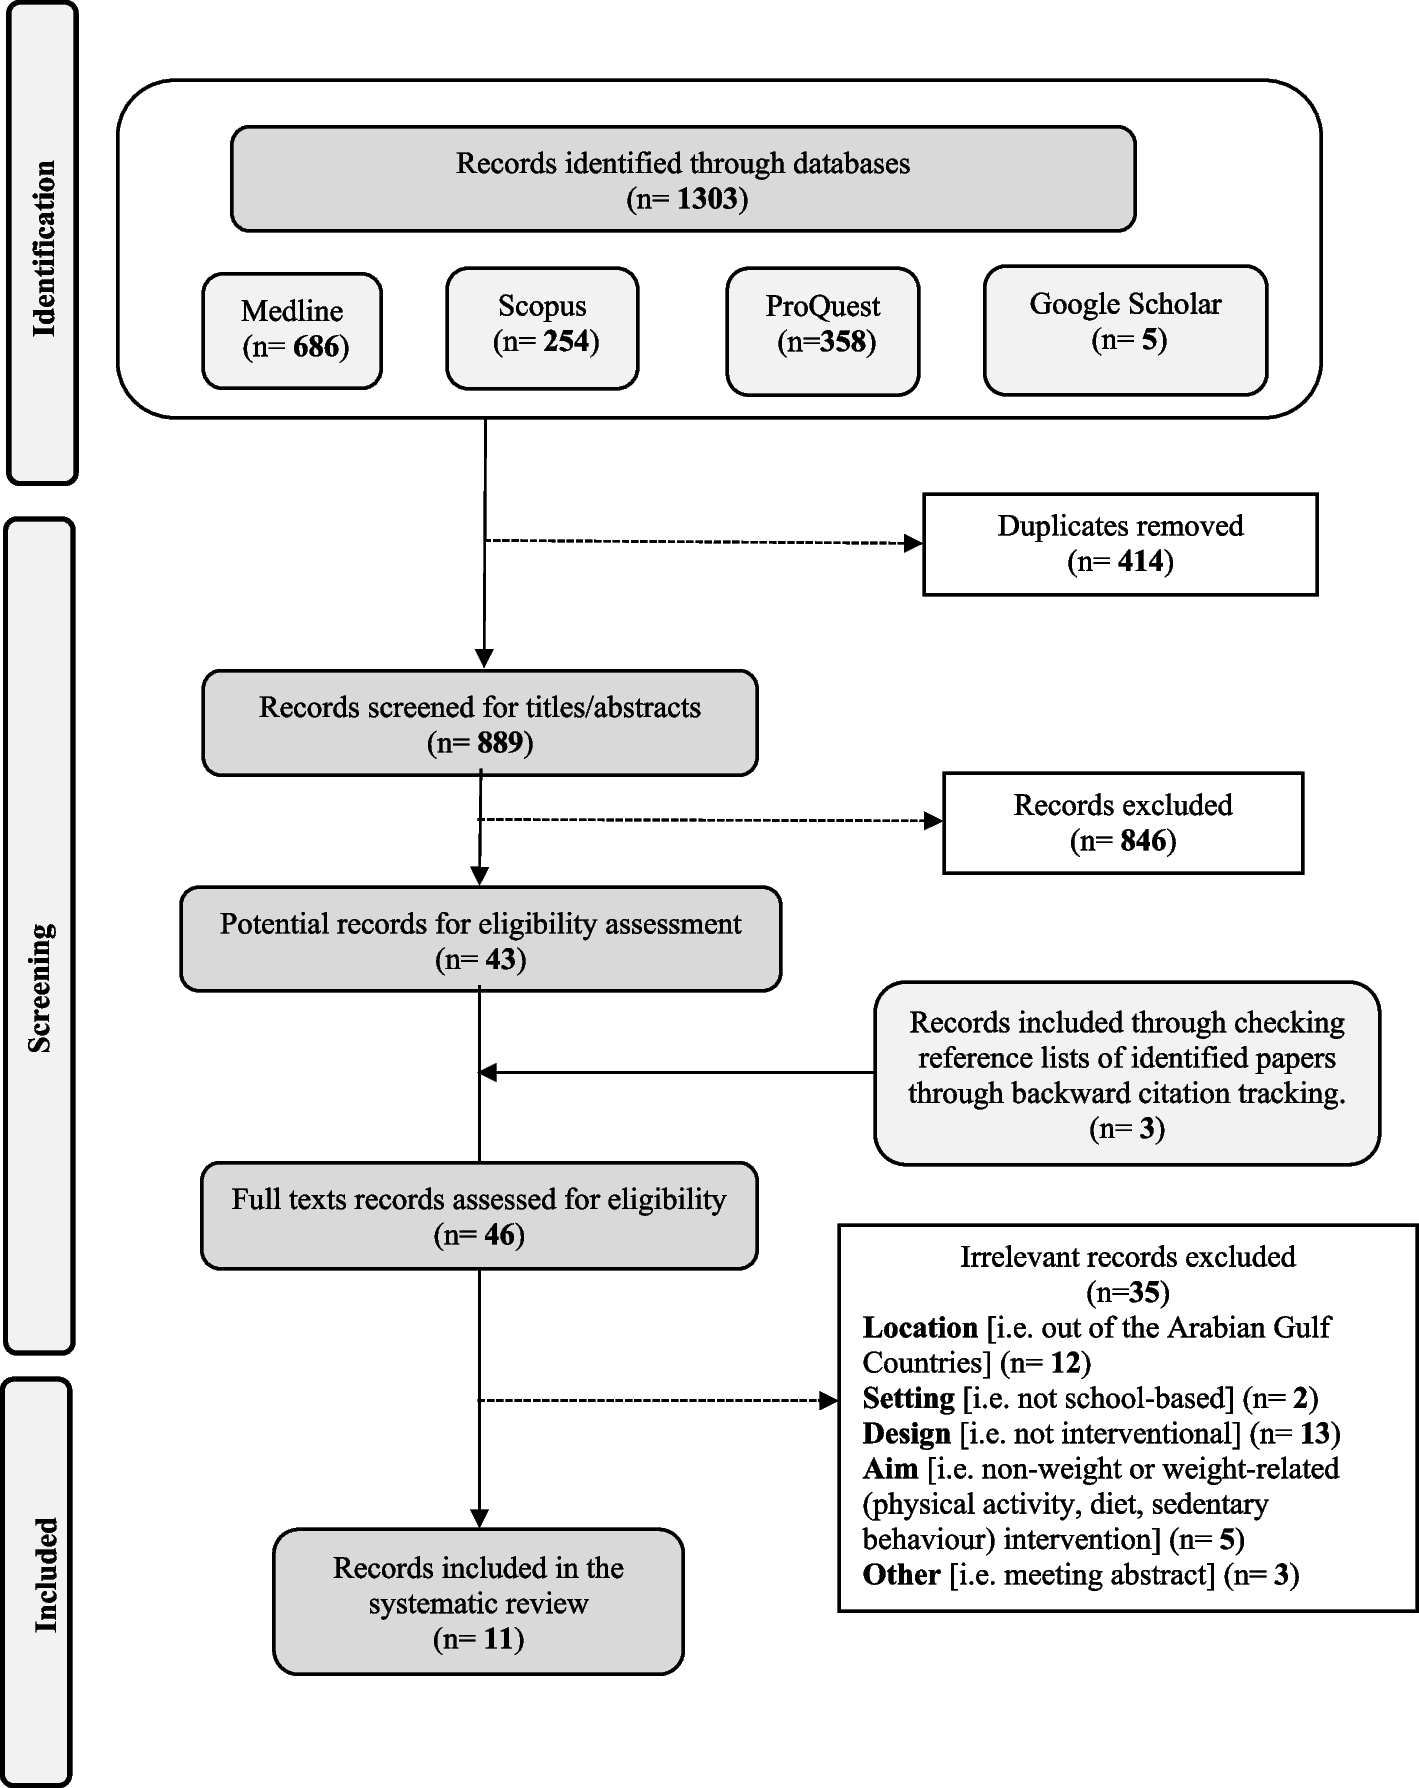


A total of 1995 studies were retrieved from the three electronic databases. After removing duplicates, 1233 references were screened, with 118 selected for full-text review. Eight studies were included in the systematic review (Appendix 2). The most common reason for exclusion was that the sample population did not meet the inclusion criteria. Details on the exclusion process are described in the PRISMA flowchart (Fig. 1).
Fig. 1
PRISMA flowchart of screening and review process
Characteristics of included studiesThe included studies were published between 1997 and 2022. Characteristics of the included studies are presented in Table 1 (note: the included studies are labeled S1–S8 to distinguish them from the general reference list). Four studies used national samples [S2, S3, S5, S6] and the remaining four used provincial samples from Alberta or Ontario [S1, S4, S7, S8]. The sample size of the selected studies ranged from 32 participants [S8] to 2020 participants [S4]. Recruitment methods primarily involved sending letters via post or emails to randomly selected residents. Six studies stratified their samples by age and sex [S2-6, S8]. One study stratified by region [S2], while another included stratification by income and education levels, along with age and sex [S8].
Table 1 Characteristics of included studiesDesign of questionnaire experimentsDetails of the study designs are included in Table 2. All studies focused on trade-off scenarios where participants were asked to allocate resources to different population groups. One study focused on choosing between policies that differentially impact socioeconomic groups [S4], four looked at age-related allocations [S1, S2, S5, S8], two on rare or common diseases [S3, S7], and one study on cancer [S6]. Other studies addressed multiple factors including disease severity, life expectancy and quality, duration of disease, and the number of individuals treated [S1, S6, S7, S8]. In terms of measurement, one study estimated inequality aversion concerning income, health and income-related health distributions [S4]. The others used mean preference scores [S2, S5], percentage preferences [S1, S3], compensating variation [S6], rate of agreement between respondent groups [S8], and effect of equity domains on participant utility [S7].
Table 2 Design of the included studiesSix studies used online questionnaires [S2-7], one used a paper-based questionnaire sent by post [S1], and one employed an in-person discussion method [S8]. Six studies used single questionnaires [S1-4, S6, S7], while the other two employed repeated questionnaires [S5, S8]. Among the repeated questionnaires, one occurred on the same day [S8], and the other after 7 weeks [S5]. Two experimental studies randomly distributed a moral reasoning exercise to half of the respondents [S2, S5]; one of them had the respondents complete the exercise before each scenario [S2], while the other had them complete it after each scenario description [S5]. Another experimental study assigned participants to different questionnaire versions with varied framing effects [S3].
Public values in preference studiesThe results of preference studies are presented in Table 3 and discussed below.
Table 3 Results of included studiesPreferences related to income and fairnessOnly one study [S4] examined preferences in relation to income, health and income-related health inequalities. Specifically, it asked participants about their preferred allocation of income, health and income-related health quintiles. The study presented two policy options that required participants to make a trade-off between equity and efficiency. The findings revealed that participants were willing to sacrifice ~ 56% of the mean societal income to achieve a more equitable income distribution. Similarly, there was statistically significant evidence of aversion to income-related health inequality, with participants willing to sacrifice 3% of the mean health-expected life expectancy to support equity. In contrast, there was limited support for sacrificing overall health to improve inequality in the distribution of health. Interestingly, ~ 50% and ~ 20% of participants expressed weak inequality aversion or even “inequality-lovin” preferences in relation the health and income-related health distributions.
The study quantified inequality aversion using the Atkinson parameter, with the values for income, health and income-related health inequality aversion being 3.27, 1.17 (not statistically significant) and 1.66, respectively. The authors found heterogeneity in preferences, based on age, income, education and employment status. Over 90% of respondents provided reasoning in the open-ended space. Rationale for inequality averse responses included concern for the worse off and preference for fairness, while the rationale for less inequality averse responses included equal claim of individuals to good health and the principle of the greatest good for the greatest number.
Another study, Spackman et al. [23] included a discrete choice experiment involving 1445 participants in Alberta to investigate the decision utility associated with patient and treatment attributes. The authors found that prioritizing patients who were unfairly treated by the society increased participant utility by 0.09 while treatments that respected patients’ beliefs increased utility by 0.17. However, the study did not provide an interpretation of the relative magnitude of preference values.
Preferences related to ageFour studies examined age-based preferences in healthcare resource allocation [S1, S2, S5, S8]. Age groups in scenario descriptions varied across studies. Choudhry et al. [19] compared 5- and 65-year-olds, as well as 30- and 50-year-olds. Denburg et al. [20] examined 10- and 40-year-olds for chronic disease treatment prioritization, liver transplantation, and cancer therapy scenarios, and 15- and 45-year-olds for eating disorder treatment. Johri et al. [22] compared 35- and 65-year-olds, while Stafinski et al. [24] included 20–30 and 60–70 age groups.
In two studies [S2, S5], a similar design was used in which half of the respondents were randomly selected to complete a moral reasoning exercise (intervention) prior to completing the survey—these studies calculated mean preference scores for the intervention and control groups by scenario. Preference scores ranged from − 5, representing the strongest preference for children/younger patients, to + 5, representing the strongest preference for adults/older patients; 0 indicated no age preference. Preference scores were used to determine which program the respondents would rather fund, i.e., one favouring children/younger patients and another favouring adults/older patients. The moral reasoning exercise exposed participants in the intervention group to the ethical principles relevant to resource allocation decisions that considered a range of ideas, including equal access to care and funding treatment based on effectiveness, age, capacity to benefit, suffering, risk of death, rarity, dependence on others, family responsibilities, personal responsibility for health, economic productivity and numbers treated. Denburg et al. [20] performed only a single survey comparing intervention and control results whereas, Johri et al. [22] repeated this study after 7 weeks to compare the preference scores from baseline and follow-up surveys.
Johri et al. [22] included liver transplant, palliative care, depression treatment, lung transplant, and coronary bypass in their study as hypothetical resource allocation scenarios. This study found that, in all cases except palliative care, respondents preferred allocating resources to younger patients. When exposed to the moral reasoning exercise, participants preference for prioritizing patients with specific conditions over others, reduced significantly. Additionally, rates of no preference were also higher for the moral reasoning group. Denburg et al. [20] included chronic disease, liver transplant, cancer therapy, palliative care, and eating disorder treatment in their study as hypothetical funding scenarios, and found similar results as Johri et al., i.e., participants preferred resource allocation to children but those exposed to the moral reasoning exercise had weaker preference for children. The difference in preference between the reasoning and control groups was largest for cancer therapy and eating disorder treatment scenarios.
Choudhry et al. [19] surveyed senior health officials on funding preferences, finding a general preference for younger patients, especially when the benefits varied significantly. However, when the age gap decreased between scenarios, the proportion of undecided/indifferent individuals increased. When the distributional difference was large (e.g., 500 people gain 20 years of life expectancy vs. 10,000 people gain 1 year of life expectancy), respondents preferred the scenario with larger benefits for a smaller number of people suggesting evidence of a distributional preference. When the distributional difference scenario was combined with a minor age difference, respondents preferred the program that provided more benefits to fewer patients when these patients were younger.
Finally, Stafinski et al. [24] conducted Citizens’ Juries in Edmonton and Calgary involving 32 participants who participated in small group and plenary sessions. Participants were presented with trade-off scenarios involving age, current health state, health outcome with treatment, prognosis without treatment and dependents. No quantitative analysis was conducted other than assessing agreement rate between two Juries. There was a preference for funding the younger population unless the older patients faced imminent death and can receive the same health gain as the younger patients. Additional preferences were identified in relation to funding the worst-off, those facing imminent death and treating the larger number of patients unless the gains in the smaller group are large.
Preferences related to orphan drugsDragojlovic et al. [21] focused on resource allocation decisions involving treatment for common diseases versus those for rare diseases (i.e., orphan drugs). The cost of orphan drugs tends to be high and may not be cost-effective based on the conventional willingness-to-pay thresholds. As a result, policy makers struggle when it comes to resource allocation decisions involving rare diseases. This study surveyed 2005 Canadian adults and included trade-offs involving treatments for rare versus common diseases. Overall, the study found that the majority of respondents preferred to fund patients with common diseases over those with rare diseases. However, ~ 27% of participants were indifferent between the two disease categories [2]. This study had a lower indifference rate than a similar study conducted in Norway which reported an indifference rate of ~ 65% [25]. In Dragojlovic et al. [21], when respondents selected the indifference option, they were asked to distribute funds between common and rare disease patients; 32% to 48% of respondents allocated the funds equally between the two diseases. Interestingly, when indifference was not provided as a decision option, 60% of respondents chose to fund rare disease patients. However, when costs were presented as unequal (i.e., rare diseases costing four times as much as common diseases), only 30% of participants chose the rare disease option. Finally, the choice was not influenced by whether the allocated funds were considered additional money or existing. In addition to Dragojlovic [21], Spackman et al. [23] also included disease rarity in their DCE design; however, this attribute did not appear to have an impact on the decision utility of participants.
Preference related to cancer patientsSkedgel et al. [14] developed a discrete choice experiment to evaluate participant preferences for cancer treatment in relation to the health maximization versus distributive justice. The attributes considered include patient age, disease severity, final health state, duration of benefit and distributional concerns. Each attribute was assigned three levels, and levels were evenly spaced across plausible values (e.g., for the attribute age, three levels were specified (ages 10, 40, and 70)). The trade-off was calculated as compensating variation (CV) between attributes. CV was calculated as changes from the baseline level either upwards to the high level or downwards to the low level. CV can be interpreted as the willingness to sacrifice life-years in order to give greater priority to a more desirable level or lesser priority to a lesser desirable level. The findings suggest that only 3% of respondents favored allocation based on health maximization across all choice scenarios. Participants were willing to prioritize treating younger and larger patient groups as well as patients with the greatest life expectancy. This indicates a preference for distributive justice, rather than a solely based on maximizing QALYs.
Preference related to life expectancy and quality-of-life and the size of health gainsThe DCE study conducted by Spackman et al. [23] also included attributes related to health gains. The study found that baseline life expectancy and quality-of-life were not significantly associated with decision utility. On the other hand, treatment-related gain in life expectancy and improvement in quality-of-life increased decision utility by 0.21 per year gained and 0.05 per 0.01 improvement in quality-of-life.
Assessment of study qualityStudies identified in this review employed diverse sampling frames and strategies, with most drawing from existing online panels or inviting residents from specific geographic regions. One study recruited senior officials from the Ontario Ministry of Health. As such, the representativeness and generalizability of the findings remain uncertain.
The level of missing data varied across studies; one study did not present this value [S3], three studies had a high/medium level of missing data [S1, S2, S5] and the remainder had a low level of missing data, i.e., less than 15%. The survey response rate was only reported in five studies and varied from medium to low adequacy [S1, S2, S4, S5]. The majority of studies pilot-tested their questionnaires prior to the study or referred to a previous systematic review to identify important concepts. The reliability of the survey instruments was considered high overall, with some concerns relating to the large amounts of missing data and the generally low response rate. Spackman et al. [23] did not include information on missing data. Details on the risk of bias assessment are provided in Appendix 3.
Comments (0)