Cells and culture conditions
V6.5 murine embryonic stem cells (mESCs) were a gift from R. Young of the Whitehead Institute for Biomedical Research. V6.5 are male cells derived from a C57BL/6(F) × 129/sv(M) cross. Naive V6.5 mESCs were grown as previously described [19]. Briefly, KnockOut DMEM (Thermo Fisher Scientific, 10829–018) was supplemented with 15% fetal bovine serum (VWR, 97068–085, lot 170K19), 1 × GlutaMAX (Thermo Fisher Scientific, 35050–061), 1 × non-essential amino acids (Thermo Fisher Scientific, 11140–050), 0.1 mM beta-mercaptoethanol (Gibco, 21985–023), homemade LIF (1:500), and 100 U/mL penicillin and 100 ug/mL streptomycin (Thermo Fisher Scientific, 15140–122). Cell counts were obtained on a Countess II FL Automated Cell Counter (Invitrogen). For ChIP-seq spike-in normalization, human embryonic kidney cells (HEK293T, female) were grown in DMEM (Gibco, 11995065) supplemented with 10% Bovine Calf Serum (Seradigm, 2100–500), 100 U/mL penicillin, and 100 ug/mL streptomycin.
Chromatin immunoprecipitation (ChIP)
mESCs were trypsinized (Gibco, 12604–013) and counted prior to crosslinking. Cells were crosslinked with 1% formaldehyde (Thermo Fisher Scientific, 28906) in PBS for 5 min then quenched with 2.5 M glycine. Crosslinked cells were washed twice with cold PBS then lysed with 10 ml of cold Lysis Buffer 1 (50 mM Hepes–KOH pH 7.5, 140 mM NaCl, 1 mM EDTA, 10% glycerol, 0.5% NP-40, and 0.25% Triton X-100) by rotating for 10 min at 4 °C. After pelleting at 1350 × g for 5 min at 4 °C, nuclei were lysed in 5 ml Lysis Buffer 2 (10 mM Tris–HCl pH 8, 200 mM NaCl, 1 mM EDTA, and 0.5 mM EGTA) by rotating for 20 min at 4 °C. After pelleting at 1350 × g for 5 min at 4 °C, supernatant was removed and tubes were washed with 1 ml of cold Shearing Buffer (10 mM Tris pH 7.5, 1 mM EDTA, 0.1% SDS) and spun at 1350 × g for 5 min. Chromatin (pellet) was resuspended in 1 ml of Shearing Buffer and 5% of HEK293T chromatin (extracted using the same protocol) was added prior to sonication to be used later for spike-in normalization. Sonication of chromatin was performed using a Covaris E220 in milliTUBEs (Covaris, 520130) with the following settings: Duty Factor 5, PIP/W 140, and 200 cycles per burst for 20 min. Following sonication, insoluble material was pelleted and removed by spinning samples for 10 min at 15,000 rpm at 4 °C. ChIPs were performed using RAD21 antibody (5ug, Abcam, ab992), WDR5 antibody (4 uL, Cell Signaling Technology, D9E1I), SP1 antibody (5ug, Millipore 07–645), or Rabbit IgG antibody (5ug, Bethyl, P120-101) incubated with 50 uL Protein A Dynabeads (Invitrogen, 10002D), or using NFYA antibody (2.5ug, Santa Cruz Biotechnology, sc-17753) or Mouse IgG (2.5 ug, Santa Cruz Biotechnology, sc-2025) incubated with 50 uL Protein G Dynabeads (Invitrogen, 10004D). Antibodies were incubated with beads for 4–6 h prior to the IP. Beads were washed three times with PBS to remove unbound antibody prior to the addition of chromatin. 2% Input was removed, then chromatin from 1 × 10⁷ cells was added to antibody-conjugated beads and incubated in ChIP buffer (20 mM Tris pH 8, 2 mM EDTA, 0.1% SDS, 225 mM NaCl, and 1.5% Triton X-100), rotating overnight at 4 °C. The next day, beads were washed with cold Wash Buffer 1 twice (20 mM Tris pH 8, 2 mM EDTA, 0.1% SDS, 150 mM NaCl, and 1% Triton X-100), then with cold High Salt Wash Buffer (20 mM Tris–HCl pH 8, 500 mM NaCl, 2 mM, EDTA, 0.1% SDS, and 1% Triton X-100), cold LiCl Wash Buffer (10 mM Tris–HCl pH 8, 250 mM LiCl, 1 mM EDTA, and 1% NP-40), and cold TE Wash Buffer (10 mM Tris pH 8, 1 mM EDTA, and 50 mM NaCl), each for 5 min rotating at 4 °C. All buffers listed above were supplemented with 1X protease inhibitor cocktail (PIC) (Sigma Aldrich, 11697498001) and 1 mM PMSF (Thermo Fisher, 36978). Chromatin was eluted from beads by adding 100 uL IP Elution Buffer (50 mM Tris pH 8, 10 mM EDTA, and 1% SDS) and incubating at 65 °C for 1 h, vortexing every 15 min. Supernatant (and 2% Input chromatin samples) was incubated at 65 °C overnight with addition of 5 uL Proteinase K (NEB, P8107S) to reverse crosslinks. The next day, DNA was purified using a ChIP DNA Clean and Concentrate kit (Zymo, D5205), per manufacturer’s instructions. Samples were then used for ChIP-qPCR and/or ChIP-seq.
ChIP library preparations and high throughput sequencing
ChIP-Sequencing libraries were prepared using a Hyper Prep kit (Roche/Kapa Biosciences, KK8502) according to manufacturer’s instructions. 50 bp paired-end sequencing was performed on NovaSeq 2000 P2, NextSeq 2000 P3, and NovaSeq 6000 S1 platforms using Illumina reagents according to manufacturer’s instructions by the High Throughput Sequencing Facility at UNC Chapel Hill.
ChIP-seq analysis
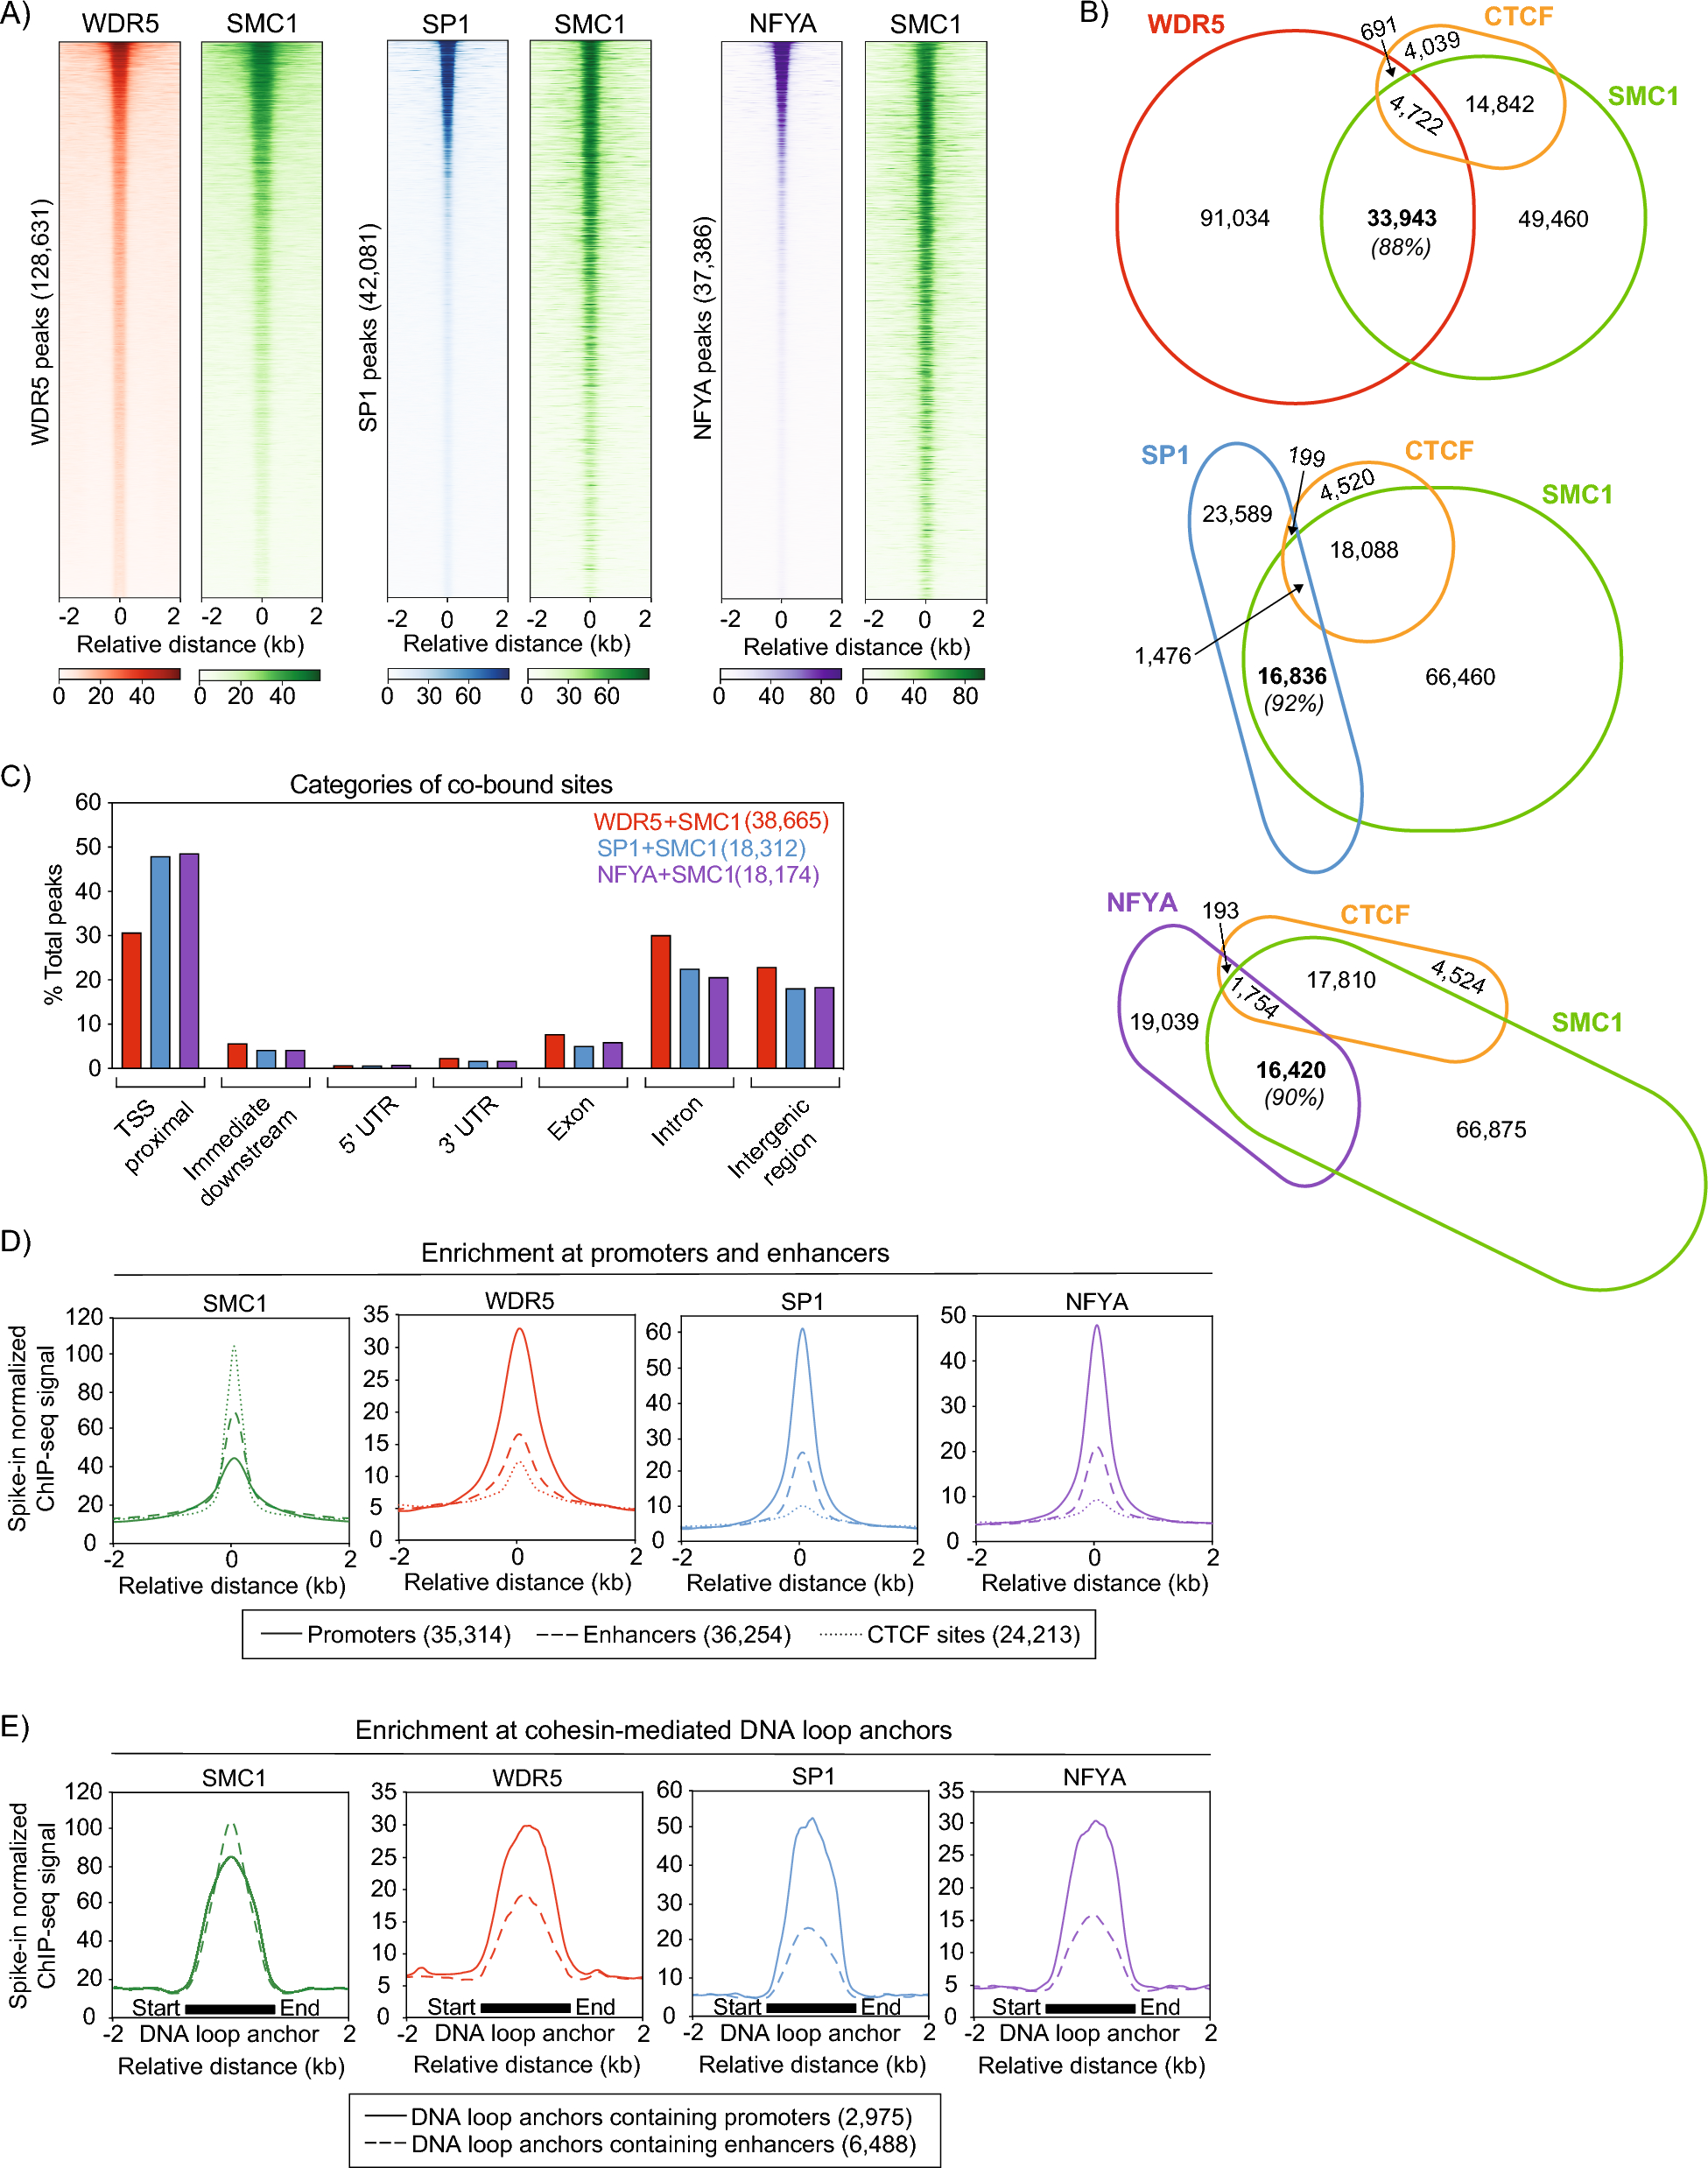
Accession numbers of all ChIP-seq data generated or utilized in this study can be found in Additional file 1: Table S1 [16, 17, 30]. ChIP-seq processing and spike-in normalization was performed as previously described [14]. ChIP-seq peaks were called using MACS2 [31] with a q value of 0.01; narrow peaks were called for cohesin, SP1 and NFYA; narrow and broad peaks were called and combined for WDR5. Heatmaps were generated using deeptools computeMatrix and plotHeatmap. Note that heatmaps in Figs. 1a and S1B were originally generated as one image but were separated during figure-making for the manuscript. Therefore, the heatmaps in Figs. 1a and S1B are generated using the same peak set in the same order. Average signal plots were generated using deeptools with no directionality considerations. Promoters were defined as transcription start sites as annotated by UCSC genome browser [32]. Enhancers were defined as peaks identified in merged OCT4, SOX2, and NANOG ChIP-seq data [33]. DNA loop anchors were defined via SMC1 ChIA-PET, identified in Dowen et al. [19].
The Integrative Genomics Viewer was used to visualize ChIP-seq peaks and create genome browser track images [34]. Peaks were annotated using HOMER [35], command annotatePeaks.pl. PANTHER was used for all GO analyses reported in Fig. 3f, g and Additional file 5: Table S4 [36].
To create Venn diagrams, we used the R package eulerr to generate Area-proportional Euler diagrams [37]. To generate scatter plots, we used rtracklayer to import bigwig files to R version 4.2.2, the GenomicRanges function summary to calculate the mean ChIP-seq signal from the imported bigwig files at overlapping peaks, and ggplot2 to plot the result [38,39,40]. In order to directly compare principal components of publicly available datasets with our generated WDR5, SP1, and NFYA datasets, alignments to the mouse genome were normalized to counts per million using deeptools bamCoverage after extending the reads by 200 bp. Using deeptools multiBigwigSummary, the average score for each resulting bigwig file was computed for consecutive 10 kb bins across the entire genome. The UCSC RepeatMasker was used to blacklist repetitive regions of the genome. PCA plots were generated using deeptools plotPCA.
To illustrate differences between siGlo and siWDR5/siSP1/siNFYA ChIP-seq samples, Deeptools bigwigCompare was used to generate a bigwig file representing the log2 fold change in spike-in normalized ChIP-seq signal between conditions. Differential binding site occupancy analysis was performed using DiffBind [41], as previously described [14].
ChIP-Atlas
ChIP-Atlas’s Colocalization Tool (https://chip-atlas.org/colo), which uses available ChIP-seq data, predicted colocalization between cohesin and WDR5, cohesin and SP1, and cohesin and NFYA in the same/similar cell types. Specific studies referenced in Fig. 2 are listed in Additional file 3: Table S2. Further information about the algorithm and methods ChIP-Atlas’s Colocalization Tool uses, as well as the Z-score cuttoffs, can be found at https://github.com/inutano/chip-atlas/wiki#algorithms (Sect. 6). Briefly, ChIP-Atlas’s Colocalization Tool predicts colocalization partners of given TFs, evaluated through comprehensive and combinatorial similarity analyses of all public ChIP-seq data. It has been programed so that MACS2 scores in each BED4 file were fitted to a Gaussian distribution, dividing the BED4 files into three groups: H (High binding; Z-score > 0.5), M (Middle binding; − 0.5 ≤ Z-score ≤ 0.5), and L (Low binding; Z-score < − 0.5).
Co-immunoprecipitations (Co-IPs)
Cells were collected via scraping in cold PBS with 1X PIC and 1 mM PMSF. Cells were incubated in cold 1X Hypotonic Buffer (Nuclear Complex Co-IP Kit, Active Motif, 54001) for 15 min, rotating at 4 °C, then detergent was added (per manufacturer instructions) to isolate nuclei. Nuclei were pelleted then resuspended in Nuclear Digestion Buffer A (10 mM HEPES pH 7.9, 10 mM KCl, 1.5 mM MgCl2, 340 mM sucrose, and 10% glycerol) supplemented with 10U of Benzonase (Sigma Aldrich, E1014), and incubated for 15 min at 37 °C. EDTA was then added to quench the Benzonase and samples were centrifuged at 5000 × g for 5 min at 4 °C. Protein levels in supernatants containing nuclear proteins were measured using Protein Assay Dye Reagent Concentrate (BioRad 5000006), Input samples were removed, and equal protein concentrations were used in each IP reaction. Cold High-stringency co-IP Buffer (per Active Motif Nuclear Complex Co-IP Kit (54001) instructions, 37510) was added to each sample to achieve equal volumes, then antibodies conjugated to beads were added and samples were incubated overnight, rotating at 4 °C. IP antibodies used include WDR5 (Cell Signaling Technology, D9E1I), SP1 (Millipore, 07–645), NFYA (Santa Cruz Biotechnology, sc-17753), RAD21 (Abcam, ab992), SMC3 (Abcam, ab9263), and IgG (Bethyl, P120101). 50 uL of Protein A Dynabeads (Invitrogen, 10002D) or G Dynabeads (Invitrogen, 10004D) were incubated with antibody for 4–6 h prior to addition of protein extracts. The next day, beads were washed 3 × with cold High-stringency co-IP Buffer supplemented with 1 mg/mL BSA (Sigma Aldrich, A4503), then washed 3 × with High-stringency co-IP Buffer (no BSA). All buffers used up to this point were supplemented with 1X PIC and 1 mM PMSF. Protein complexes were eluted from beads in 50 uL IP Elution Buffer (50 mM Tris pH 8, 10 mM EDTA, and 1% SDS) at 65 °C for 1 h, vortexing every 15 min. Western blotting was performed on samples (as explained below).
Western blotting
1 × Laemmli Buffer (BioRad, 1610747) and 50 mM DTT (Thermo Fisher Scientific, PR-V3151) was added to each protein sample and samples were boiled at 95 °C for 10 min before being run on 4–20% Tris–Glycine gels (BioRad, 4568094), and transferred to PVDF membranes (VWR, BSP0161). Membranes were blocked for 15 min with 5% blocking grade buffer (BioRad, 1706404) and incubated in primary antibody overnight, rocking at 4 °C. Primary antibodies used were WDR5 (Cell Signaling Technology, D9E1I), SP1 (Millipore, 07–645), NFYA (Santa Cruz Biotechnology, sc-17753), RAD21 (Abcam, ab992), SMC3 (Abcam, ab9263), STAG1 (Bethyl, A300-157 A), STAG2 (Bethyl, A300-158 A), NIPBL (Santa Cruz Biotechnology, sc-374625), and GAPDH-HRP (Cell Signaling Technology, 8884S). All washes were 3 × 5 min with 1X TBS-T. Blots were incubated with secondary antibody for 2 h, rocking at 4 °C. Secondary antibodies used were Donkey anti-Rabbit (GE Healthcare, NA934), Rabbit anti-Goat (Abcam, ab97100), Goat anti-Mouse (Invitrogen, A16072) and Light-Chain Specific Mouse anti-rabbit (Cell Signaling Technology, D4W3E). Membranes were imaged using either Thermo SuperSignal West Pico PLUS (34577) or Thermo SuperSignal West Femto (34094) chemiluminescent substrates. Gels were stained with Bio-safe Coomassie Stain (BioRad, 1610786) to detect total protein levels. Gels and membranes were imaged with an Amersham Imager 600 (GE Healthcare). Quantification of blots were performed using ImageStudio.
Serial ChIP
Cells were collected and crosslinked, nuclei were isolated, and chromatin was sheared as explained in ChIP methods section above. Serial ChIPs were performed using RAD21 antibody (5 ug), WDR5 antibody (4 uL), SP1 antibody (5 ug), or Rabbit IgG antibody (5 ug) incubated with 50 uL Protein A Dynabeads (Invitrogen, 10002D), or using NFYA antibody (2.5 ug) or Mouse IgG antibody (2.5 ug) incubated with 50 uL Protein G Dynabeads (Invitrogen, 10004D). For the first IP, antibodies were incubated with beads for 4–6 h prior to the IP, then washed three times with PBS to remove unbound antibody prior to the addition of chromatin. 0.67% Input was removed, then chromatin from 3 × 10⁷ cells was added to antibody-conjugated beads and incubated in ChIP buffer, rotating overnight at 4 °C. For the second IP, the next day, antibodies were incubated with beads for 4–6 h prior to the IP, then washed three times with PBS to remove unbound antibody prior to the addition of chromatin. Beads from the first IP were washed with cold Wash Buffer 1 twice, then with cold High Salt Wash Buffer, cold LiCl Wash Buffer, and cold TE Wash Buffer, each for 5 min rotating at 4 °C. Chromatin was eluted from beads by adding 150 uL IP Elution Buffer and incubating at 65 °C for 15 min. Eluate was split into three tubes for the second IP: (1) for positive control sample, (2) for negative control (IgG) sample, and (3) sample for testing the interaction of interest. Antibodies conjugated to beads, Shearing Buffer, and ChIP Buffer were added to these samples, which were then incubated, rotating overnight at 4 °C. The next day, beads were washed with cold Wash Buffer 1 twice, then with cold High Salt Wash Buffer, cold LiCl Wash Buffer, and cold TE Wash Buffer, each for 5 min rotating at 4 °C. All buffers, except IP Elution Buffer, were supplemented with 1X PIC and 1 mM PMSF. Chromatin was eluted from beads by adding 100 uL IP Elution Buffer (50 mM Tris pH 8, 10 mM EDTA, and 1% SDS) and incubating at 65 °C for 1 h, vortexing every 15 min. Supernatant (and 0.67% Input chromatin samples) was incubated at 65 °C overnight with addition of 5 uL Proteinase K to reverse crosslinks. The following day, DNA was purified using a ChIP DNA Clean and Concentrate kit (Zymo, D5205), per manufacturer’s instructions. qPCR was then performed on Serial ChIP samples (as explained below).
qPCR analysis of ChIP samples
ChIP samples were analyzed by qPCR using PowerUp SYBR Green Master Mix (Applied Biosciences, A25742) and primers described in Additional file 6: Table S5. ChIP signals were calculated as percent input. ChIP experiments were completed in biological triplicate. Statistics listed in Additional file 4: Table S3.
siRNA depletions
mES cells were counted and 3–5 × 10⁶ cells were plated per 10 cm plate. 50 nM of siRNA (pools of 4) or siGLO transfection control was transfected per well using DharmaFECT 1 transfection reagent (Dharmacon, T-2001) following manufacturer’s instructions. siRNA reagents used include siGLO (Horizon Discovery, D-001630-01-0), siSMC3 (Horizon Discovery, M-064492-01-0005), siWDR5 (Horizon Discovery, M-047406-00-0005), siSP1 (Horizon Discovery, M-040633-02-0005), and siNFYA (Qiagen, 1027416). Cells were harvested after 48 h for ChIP-qPCR (as explained above) and protein extractions. Protein extraction: 1 million cells per sample were washed with cold PBS then lysed in cold 200 uL Kischkel buffer (50 mM Tris pH 8.0, 150 mM NaCl, 5 mM EDTA, 1% Triton X-100, 1X PIC, 1 mM PMSF) on ice for 5 min. Samples were spun down at max speed, for 5 min at 4 C, then supernatant was saved and protein expression levels were assessed via western blot (as explained above).
Motif analysis
To identify motifs enriched in Persistent cohesin peaks, we utilized the MEME suite tool MEME-ChIP (v 5.5.7) in Differential Enrichment mode with default settings. Bed files for Persistent peaks (defined as all siGlo-RAD21 peaks minus any Lost or Differential Peaks; siGlo-RAD21 peaks unaffected by WDR5 knockdown) were used for the analysis.


Comments (0)