
Remember me


Acquiring clear images in a pelvic examination, particularly for small structures, can be challenging. Proper patient preparation and the adoption of an appropriate protocol are crucial to minimizing motion and common artifacts (Table 2). General recommendations for optimizing image quality include the use of an antiperistalsis agent to decrease bowel and uterine peristalsis, ensuring the removal of rectal air, and following a precise protocol for prostheses to prevent distortion artifacts. These measures are essential for enhancing the overall quality of the images [31].
Table 2 Suggested MRI protocol for the study of EC and CCFor our protocol setup, the examination is performed with the patient lying in the supine position using a 3-T MRI scanner. We employ a single body matrix coil in conjunction with a spine array coil. Although an endorectal or endovaginal coil could be used to improve image quality further, we have opted not to utilize these in this case to maintain patient comfort and streamline the procedure [32].
Our choice of a 3-T MRI scanner (MAGNETOM Vida, Siemens Healthineers, Erlangen, Germany) provides high-resolution images, which are particularly beneficial for visualizing small pelvic structures. The higher field strength enables faster scan times and enhances functional techniques like diffusion-weighted imaging (DWI) and dynamic contrast-enhanced imaging, providing more reliable diagnostic data. Furthermore, the increased contrast-to-noise ratio (CNR) at 3 T facilitates better differentiation of tissue interfaces, aiding in the detection and staging of pelvic cancers such as those of the cervix, endometrium, and prostate. The combination of a body matrix coil and a spine array coil allows for comprehensive coverage and optimal signal reception. This setup strikes a balance between image quality and patient comfort, making it suitable for a broad range of clinical scenarios. This setup ensures adequate signal coverage across the pelvic region while maintaining a high signal-to-noise ratio (SNR). The close proximity of the body matrix coil to the region of interest significantly enhances signal reception, while the spine array coil contributes to uniform signal acquisition, especially for deeper structures.
Advanced imaging methods, such as IVIM and magnetic resonance spectroscopy (MRS), also benefit from improved SNR and metabolite peak resolution at 3 T, aiding in tumor characterization and treatment monitoring. Challenges like susceptibility artifacts are mitigated through optimized protocols and advanced sequences, making 3-T MRI a powerful tool for accurate and efficient pelvic imaging.
By adhering to these general recommendations and our specific protocol setup, we aim to achieve the best possible imaging outcomes for pelvic examinations.
A morphological phase is the core of the examination, involving the acquisition of T1-weighted and T2-weighted turbo spin echo images. Subsequently, a functional phase takes place, including the acquisition of DWI and dynamic contrast-enhanced (DCE) images. Finally, after the administration of contrast medium, a high-resolution 3D T1 Fat-saturated image is acquired.
Morphological imaging and dynamic contrast-enhanced (DCE) MRIDue to the natural contrast between the signal intensity of the uterus and the surrounding fat, T2-weighted imaging (T2WI) plays a vital role in pelvic MRI. A high-contrast resolution T2WI can effectively depict all four layers of the cervix [31], requiring a proper combination of parameters. It consists of 3 mm slice thickness, a field-of-view of tailored to the extent of the uterus, while keeping it as small as possible to strike a suitable compromise for resolution (Fig. 1a–c).
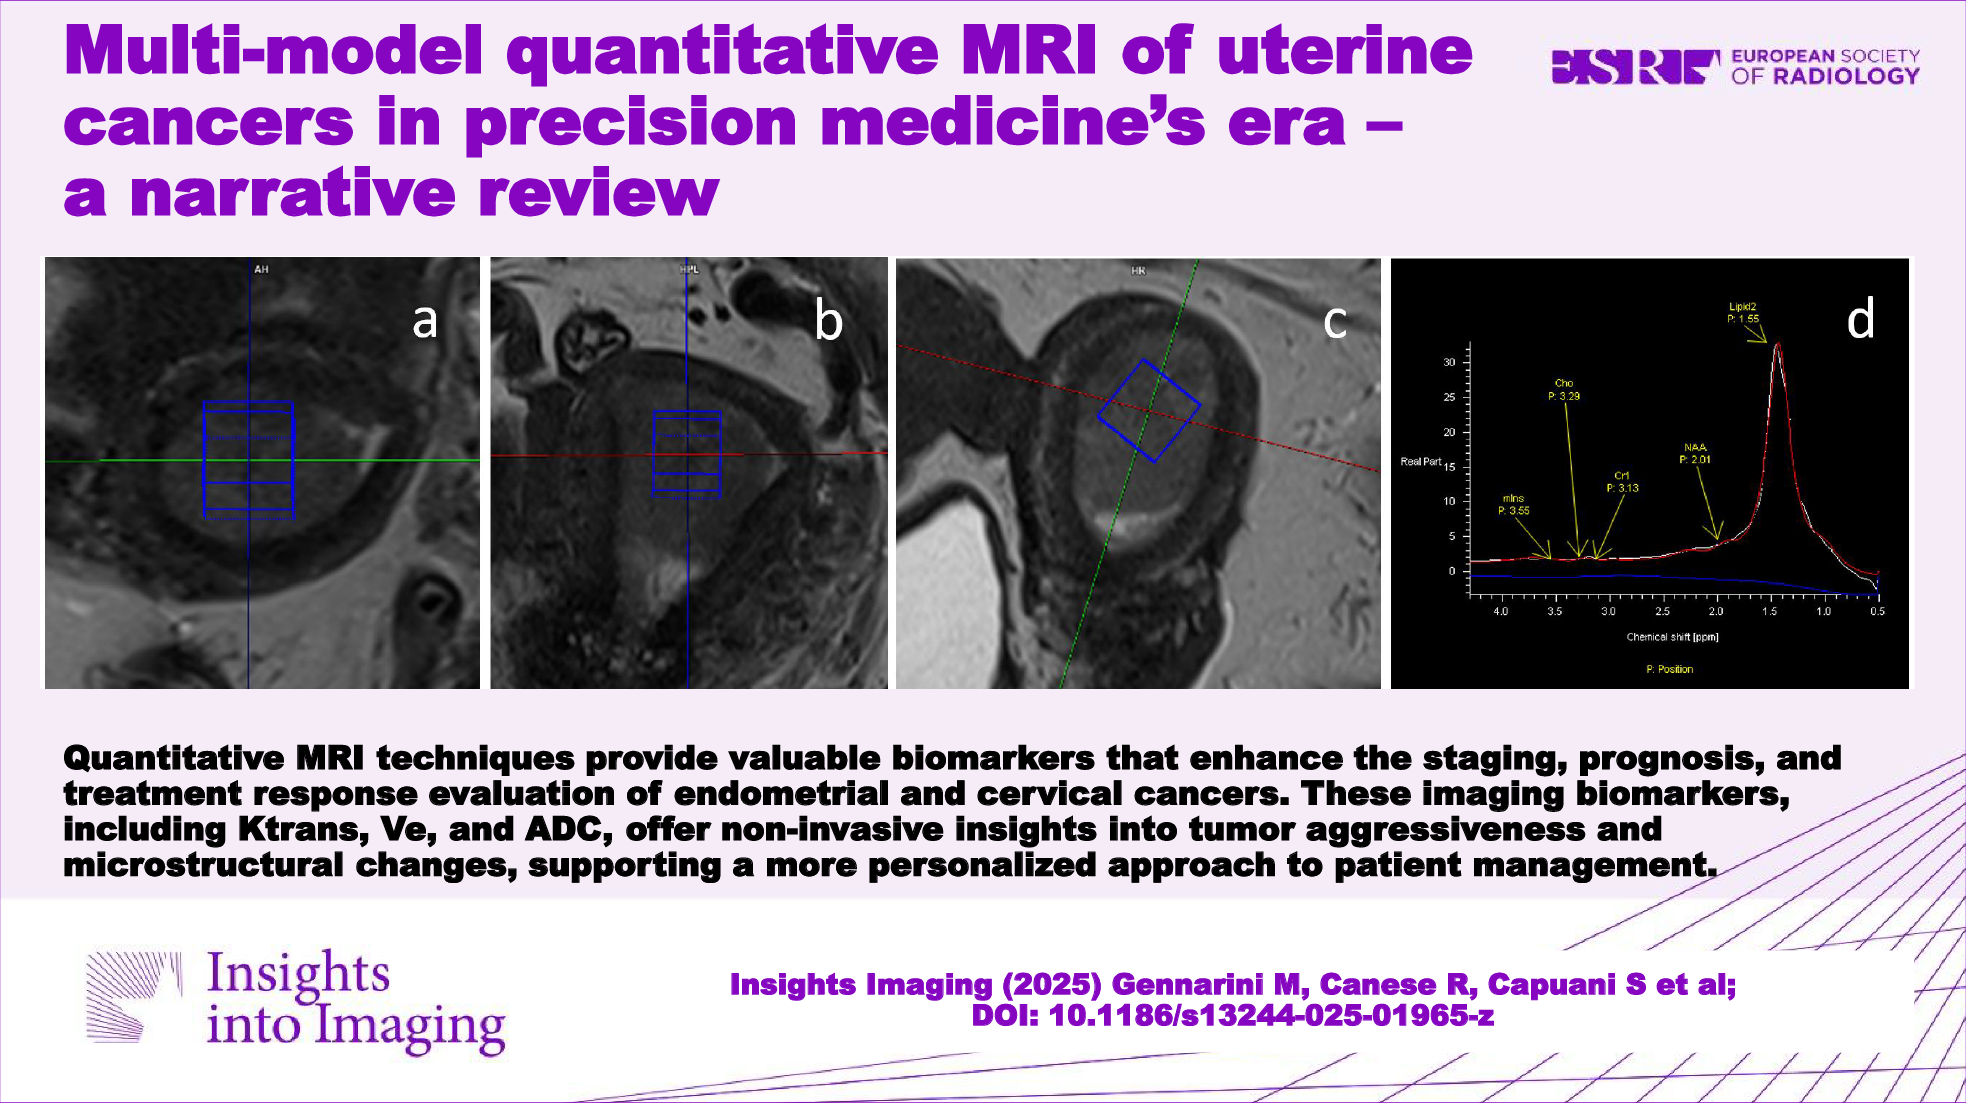
Fig. 1
Acquisition on a 67-year-old patient with endometrial cancer for whom images were optimized for optimal contrast, respectively: (a) sagittal plane, (b) coronal plane, (c) axial plane. Acquisition on a 71-year-old patient: d post-contrast T1 3D volumetric, e subtraction between pre-contrast and post-contrast in T1 3D volumetric, (f) fusion between sagittal T2 and isotropic b2000
In this study, the T2 weighting of the imaging sequence was manipulated by extending the relaxation time and adjusting the Turbo Factor proportionately. To enhance the differentiation among the various layers of the cervix, a deliberate decision was made to keep the echo time at a lower value. This resulted in a grayish appearance of fluids, a characteristic that was corrected using the RESTORE technique.
The high-resolution T1 fat-saturated image utilizes a VIBE sequence with DIXON suppression and a voxel size of 0.9 × 0.9 × 0.9 mm3 (Fig. 1d, e).
This approach offers several advantages for pelvic MRI, ensuring precise anatomical evaluation and optimized diagnostic utility. The isotropic voxel size guarantees equal spatial resolution across all three dimensions, facilitating accurate multi-planar reconstructions (MPR) without degradation of image quality. This capability is crucial for the detailed evaluation of small structures and for detecting subtle anatomical or pathological changes, particularly in complex pelvic anatomy. Additionally, isotropic imaging supports advanced post-processing techniques, including 3D segmentation, volumetric analysis, and fusion with other images, such as DWI.
The DIXON technique is optimized by ensuring precise echo time (TE) settings to accurately separate fat and water signals. Multi-echo DIXON is preferable for robust fat suppression in regions affected by field inhomogeneities, such as the pelvis. This results in improved contrast resolution, which is essential for identifying enhancing lesions, delineating tumor margins, and evaluating surrounding tissue structures. Achieving optimal T1-weighted contrast requires fine-tuning of repetition time (TR) and TE. A shorter TR is used to enhance T1 contrast while maintaining a TE that minimizes susceptibility artifacts. The use of gadolinium-based contrast agents can further enhance contrast resolution, particularly for evaluating enhancing lesions and tumor vascularity.
Higher receiver bandwidths reduce chemical shift artifacts and susceptibility-induced distortions, making them particularly beneficial in pelvic imaging. However, excessive bandwidth can lead to noise amplification, requiring careful adjustment. For 3-T MRI systems, attention must be given to mitigate B1 inhomogeneities and dielectric effects, which can impact signal uniformity, especially in deeper pelvic structures.
The DCE sequence employs a VIBE (Volume Interpolated Breath-hold Examination) sequence combined with a TWIST (Time-Resolved Angiography With Stochastic Trajectories) algorithm. This approach optimizes dynamic contrast-enhanced imaging by dividing the k-space into two distinct regions: a central region, which contains low spatial frequency information critical for image contrast, and a peripheral region, which captures high spatial frequency details important for spatial resolution. By prioritizing the acquisition of the central region more frequently than the peripheral one, TWIST achieves a higher temporal resolution without significantly compromising spatial resolution or image quality [33]. To further enhance the optimization of this protocol, parameters such as the sampling density and the temporal footprint of the peripheral region are carefully adjusted. These adjustments are tailored to the clinical requirements, such as the speed of contrast uptake and washout, ensuring that even rapid vascular dynamics are adequately captured. The choice of temporal resolution strikes a balance between capturing the necessary physiological changes and maintaining an adequate SNR.
DCE-MRI is a new functional imaging technique that assesses quantitative physiological parameters associated with tissue microcirculation [34].
The capillary network allows bidirectional exchanges between blood and tissues, and any alteration at this level can be used as an imaging biomarker for diagnosis, prognostic evaluation, and treatment of various diseases, especially in the neoplastic setting [35, 36].
DCE-MRI involves the rapid acquisition of T1-weighted images before, during, and after injection of an intravenous contrast media (CM) (0.1–0.2 mMol/kg of gadolinium-based CM delivered at a flow rate of 2–4 mL/s) [37] and enables the assessment of tissue enhancement kinetics at different time intervals based on the principle that a bolus of paramagnetic low-molecular-weight CM is temporarily confined within the vascular space as it traverses the capillary bed; subsequently, it rapidly transitions into the extravascular extracellular space, commonly referred to as the dispersion space. This transition occurs at a rate influenced by the permeability, surface area, and blood flow of the microvessels [34, 36].
Thus, the dynamics of low molecular weight contrast agents within tissues are determined by three primary factors: blood perfusion, the passage of contrast agents through vessel walls, and the diffusion of contrast media into interstitial space.
In this context, utilizing specialized software employing suitable mathematical models facilitates the extraction of the following parameters associated with tissue perfusion and microvascular status [38, 39]:
Tissue blood flow: the flow of blood entering (and exiting) a tissue volume.
Voxel capillary blood volume (Vs): the fraction of blood volume contained within the voxel; also known as blood volume fraction.
Interstitial volume (Ve): the fraction of extravascular and extracellular volume.
Ktrans: the rate of transfer from blood to extravascular extracellular space. Ktrans is the most significant perfusion-related parameter in DCE-MRI [40].
It has been shown that tumor perfusion parameters are quantitative biomarkers that reflect the mirable features of neoplasm progression. The ability to trace molecular features and parameters correlated with disease aggressiveness, may represent a breakthrough in the management of many cancers, and allow preoperative risk stratification to guide surgical treatment and adjuvant therapy [34].
To achieve the best results in quantitative MRI analysis, it is essential to standardize imaging protocols across various platforms. This involves using calibration phantoms to ensure that scanner performance is consistently aligned. Additionally, the regular validation of analysis software through the use of digital reference objects is vital for ensuring both accuracy and reproducibility. By maintaining consistent imaging parameters and using the same contrast agents, variability can be greatly reduced, thus enhancing the reliability of the results. These thorough practices of standardization and validation are not only crucial for the success of multi-center studies but also significantly improve the clinical utility of quantitative MRI diagnostics.
In June 2023, the International Federation of Gynecology and Obstetrics (FIGO) updated the staging system for EC by introducing different histologic types, tumor patterns, and molecular classifications [9].
This new system incorporates molecular features and other non-anatomic parameters into clinical consideration and marks a significant departure from traditional staging methodologies that generally neglect histologic and molecular parameters.
Considering the new staging system, DCE-MRI offers the possibility of obtaining quantitative information on physiologic and microstructural aspects associated with disease aggressiveness and facilitating the identification of critical prognostic factors for EC.
Quantitative imaging could represent a major impactful change in the therapeutic course of EC contributing significantly to the staging process, reflecting the complex nature of different histologic subtypes and various underlying biological behaviors.
The use of DCE offers the advantage of being able to assess tissue behavior at different time intervals.
In patients with EC, the myometrial invasion is more readily recognizable during the equilibrium phase of DCE (2 min and 30 s after the administration of the CM).
The subendometrial invasion—recognizable by the presence of an interruption in the enhancement of the subendometrial zone—is better visualized in the earlier phases at around 35–40 s after the administration of the CM. This aspect is of fundamental importance since the exclusion of myometrial invasion allows for conservative therapeutic approaches with fertility preservation.
The clinical management and prognosis of EC are intricately linked to the extent of cervical invasion (CI). CI is deemed present when abnormal signal intensity extends into the cervical canal or stroma, or when the cervical canal displays widening. In DCE-MRI, cervical invasion is characterized by the interruption of the enhancement of the normal cervical epithelium. CI is better assessable in later scans at approximately 4–5 min after the administration of the CM.
DCE-MRI showed superior diagnostic performance compared with T2WI in identifying cervical invasion. Combining T2WI with DCE-MRI demonstrated higher aggregate specificity, positive likelihood ratio, diagnostic odds ratio and area under the curve (AUC) than using T2WI or DCE-MRI alone.
Recently, several authors have highlighted the increasing contribution of DCE-MRI as a source of quantitative biomarkers (Ve, Vs, Ktrans) reflecting progression/recurrence, histologic subtype (aggressiveness) and clinical course in ECs.
Many tumors often exhibit aggressive hypoxia-related biological features [41, 42]: advanced grade endometrial tumors with aggressive features, such as grade 3, advanced FIGO stage, and non-endometrioid subtype show rapid growth (hypercellularity) and contextual areas of necrosis resulting in tissue hypoxia [43, 44].
The dynamic enhancement pattern observed in MRI reflects both tumor blood flow and oxygenation status [45, 46].
Satta et al [47] demonstrated that elevated Ktrans and Ve values are linked to a more favorable prognosis in EC. Their study revealed a statistically significant correlation between Ktrans and Ve values and tumor grading (p = 0.01 and < 0.01, respectively). Higher values were associated with well-differentiated G1-G2 tumors (Ktrans: 0.55 ± 0.31 mL/min/100 mL; Ve: 0.31 ± 0.13 mL), whereas lower values were observed in less differentiated G3 tumors (Ktrans: 0.32 ± 0.25 mL/min/100 mL; Ve: 0.18 ± 0.09 mL).
Further studies confirm previous findings: Haldorsen et al [48] observed that diminished tumor blood flow (bf) and lower Ktrans levels were significantly linked to a decrease in the progression-free survival/recurrence ratio, backing the theory that disorganized angiogenesis and hypoxia contribute to the advancement of tumors and the spread of metastases in ECs.
Similarly, Fasmer et al [49] showed that reduced tumor bf and a lower rate constant for contrast agent intravasation (kep) were associated with high-risk histologic subtypes (p ≤ 0.04 for both), leading to poorer prognosis (p ≤ 0.09).
In a study by Haldorsen et al [44], reductions were observed in bf, E (extraction factor), Vb, Ve, PS, and Ktrans compared to normal myometrium. Non-endometrioid carcinomas (n = 12) exhibited lower bf and E levels compared to endometrioid carcinomas (n = 43; p < 0.05), demonstrating the feasibility of DCE-MRI in reflecting histological subtype and identifying patients at increased risk of recurrence.
Finally, Wang et al [50] explored the contributory value of quantitative parameters obtained from dynamic contrast-enhanced magnetic resonance imaging (DCE-MRI) in distinguishing between TP53 mutant and TP53-wild types, as well as low-risk and non-low-risk early-stage EC, providing a potential reference for the clinical management of early-stage EC.
In the TP53 mutant group (low risk), higher values of Ktrans and Kep were observed compared to the TP53-wild group (non low risk). When identifying early-stage low-risk and non-low-risk EC, Ktrans, Ve, and f emerged as independent predictors, with their combined use demonstrating optimal diagnostic efficacy (AUC, 0.947; sensitivity, 83.33%; specificity, 93.18%). These results are in line with previous studies and suggest a potential association between elevated k trans values in the mutant group with the ability of the TP53 gene to stimulate angiogenesis [51, 52], further indicating the potential role of Ktrans in risk stratification of early-stage EC.
Within the realm of cervical cancer, DCE-MRI assumes a crucial role in prognosticating therapeutic efficacy [53, 54]. This is achieved through the correlation of quantitative measurements with tumor response in CC patients [55, 56].
It is hypothesized that inadequate tumor blood supply, impaired oxygenation status, and the existence of hypoxic cells are determinants of treatment failure (radiotherapy and chemotherapy) [57,58,59].
DCE-MRI holds promise in potentially predicting early resistance to angiogenesis-related treatments or assessing the response to drugs targeting angiogenesis, as supported by the following research studies [60].
Mayr et al [56] conducted a comparison of dynamic enhancement values in tumors, revealing that patients with advanced CC who exhibited low dynamic enhancement values had a substantially greater likelihood of recurrence compared to those with high dynamic enhancement (78% vs. 0%, p = 0.002). Additionally, tumors exhibiting higher mean dynamic enhancement values demonstrated a more favorable response and indicated improved overall blood and oxygen supply.
Parameters including Ktrans-e0, Kep-e0, ΔKtrans, and ΔVe exhibited positive correlations with the tumor regression rate. The average values of Ktrans-e0, Ktrans-e3, ΔKtrans, and ΔVe were elevated in the group without residual tumor compared to the group with residual tumor and emerged as independent prognostic factors for predicting residual tumor occurrence [61].
In conclusion, quantitative imaging could help in distinguishing between benign and malignant cervical tumors, thereby averting unnecessary radical surgery. Song et al [62] illustrated that quantitative parameters such as Kep, Ktrans, and Ve derived from DCE-MRI were markedly superior in the malignant tumor group compared to the benign tumor group (p < 0.05). The specificity and sensitivity of Kep, Ktrans, and Ve were notably higher in malignant cervical tumors than in benign ones (Table 3).
Table 3 DCE studies conclusionsT2 mappingT2 mapping is an advanced MRI technique that quantitatively measures the transverse relaxation time of tissues, providing a detailed characterization of tissue properties. This quantitative imaging tool is especially useful in the context of uterine tumors, where conventional MRI relies heavily on subjective interpretation by radiologists.
The utility of T2 mapping extends to differentiating various uterine conditions without the need for contrast agents, making it a safer option for patients who may be allergic to gadolinium or have renal insufficiency. Studies have shown that T2 mapping can effectively discriminate between benign and malignant uterine lesions, such as differentiating adenomyosis and myoma from cervical and endometrial cancers by analyzing the variation in T2 relaxation times [63,64,65].
Furthermore, T2 mapping has been shown to enhance the preoperative assessment of endometrial carcinoma, offering valuable insights into tumor grading and the extent of myometrial invasion, which are critical for treatment planning [65].
Diffusion-weighted imaging (DWI) applicationsDWI is an advanced MRI technique that provides unique insights into the microscopic motion of water molecules within tissues. It measures the random motion of water molecules, known as diffusion, which can be affected by tissue microstructure and pathology. In highly cellular tissues (e.g., tumor tissue), the tortuosity of the extracellular space and cell membrane density limit the apparent diffusion of water molecules. In contrast, cystic and necrotic tissues have fewer barriers to water diffusion and the apparent diffusion is relatively free [66].
A significant optimization was performed for the diffusion-weighted sequence, with two series acquired to meet specific diagnostic objectives. For the calculation of the ADC, b-values of 0, 500, and 1000 s/mm² were chosen. This range was selected because b-values below 1200 s/mm² are optimal for accurately estimating ADC, balancing signal decay and image quality while minimizing noise and motion artifacts. A high b-value of 2000 s/mm² was also acquired but excluded from ADC calculations. Instead, this high b-value was specifically utilized to enhance the visualization of damaged or pathological areas by suppressing signals from normal tissues and fluids, which remain visible at lower b-values.
The 2000 s/mm² sequence was acquired using an isotropic voxel size of 1.8 × 1.8 × 1.8 mm³. This isotropic resolution was selected to facilitate the precise fusion of hyperintensity values from diffusion imaging with the T2-weighted morphological sequence, ensuring better anatomical correlation and improved delineation of lesions.
This combination of b-values leverages the strengths of DW-MRI for evaluating gynecological malignancies, enabling detailed assessment of tissue microstructure for initial detection, localization, and monitoring of treatment response.
Different DW-MRI applications in the assessment of cervix and endometrium cancers are found in the literature, ranging from initial detection and localization to treatment response monitoring. The ability of diffusion models to provide functional information about tissue microstructure makes diffusion a valuable tool in the comprehensive evaluation of these gynecological malignancies.
In quantitative diffusion studies, the ADC is quantified.
In CC investigations, ADC value has been investigated both as a prognostic factor [67,68,69] and for the prediction of response to therapy and local recurrence detection [70,71,72]. Lower values of ADC compared to the surrounding cervical tissue were associated with CC area and low ADC was associated with higher risks of tumor recurrence.
The ADC value is obtained using a mono-exponential fit to DWI data acquired using at least one b-value and b = 0 s/mm2. Therefore, the ADC value that quantifies diffusion can be partly biased by the perfusion parameters, which are quantified at low b-values (0–150 s/mm2 in tissues) [73]. Differently from mono-exponential DWI, intravoxel incoherent motion (IVIM) distinguishes the diffusion of water molecules in the extracellular space from capillary micro-perfusion. Using a bi-exponential model to fit diffusion signal decay at different b-values, three quantitative parameters were quantified: the diffusion (D) that quantifies the true diffusion of water molecules in the extracellular space; the pseudo-diffusion (D*) that quantifies the movement of blood water molecules in the capillary network; and the perfusion fraction (fp) representing the volume percentage of water flowing in the capillaries [74].
The choice of b-values is a critical factor influencing the quantification of IVIM parameters alongside the SNR of each DWI in the IVIM protocol. A balance is generally sought between adequate SNR, a sufficient number of b-values, and a reasonable scan time. The b-values should also be optimized according to the tissue type being analyzed.
For highly perfused tissues, b-values equal to 0, 10, 30, 50, 75, 100, 200, 400, 700, 1000 s/mm² are typically used, with at least six b-values under 150 s/mm² to effectively estimate perfusion parameters [75]. For tissues with normal or poor perfusion, such as tumor tissue characterized by hypercellularity, b-values exceeding 1000 s/mm² are necessary to accurately capture slow water dynamics in carcinomas.
Specific protocols vary by application: for CC investigation, a commonly used IVIM protocol includes b-values of [76] 0, 10, 20, 30, 50, 75, 100, 150, 300, 500, 800, and 1000 s/mm², while for EC, the protocol includes 0, 30, 50, 150, 500, 800, 1000, and 1500 s/mm² [47]. Additionally, shorter scan time protocols, such as 0, 25, 100, 175, 200, 1000 s/mm², have shown no significant differences in parameter quantification compared to protocols with double the number of b-values [76].
In recent years, some authors have investigated IVIM parameters concerning cervical cancer, with major interest focused on discriminating between CC and healthy tissue [77,78,79], showing that tissue D and fp were significantly lower in cervix cancer than normal tissue. Some studies were performed for the prediction of lymph node metastasis [80] and for the response to concurrent chemo-radiation therapy [81]. Wang et al showed that the D and ADC values were all significantly higher for the responders than for the nonresponders, but no significant differences were observed in the D* and f values [82]. A recent study investigated whether quantitative parameters obtained from IVIM model at baseline MRI correlated with histological parameters and response to neoadjuvant chemotherapy in patients with locally advanced cervical cancer (LACC) [83]. Authors highlighted that D showed significantly higher values in good responder patients and in moderate/high tumor-infiltrating lymphocytes, while fp showed significantly higher values in squamous cell tumors.
Concerning EC investigation, several authors highlighted the growing contribution of diffusion MRI as a source of quantitative biomarkers [84, 85], and some correlation studies between quantitative MR data and prognostic factors have been performed using DWI and IVIM model. Some of these reported results on ADC values to discriminate grading in EC, in particular showing lower ADC values in Grade 3 EC [86,
Comments (0)