Study design
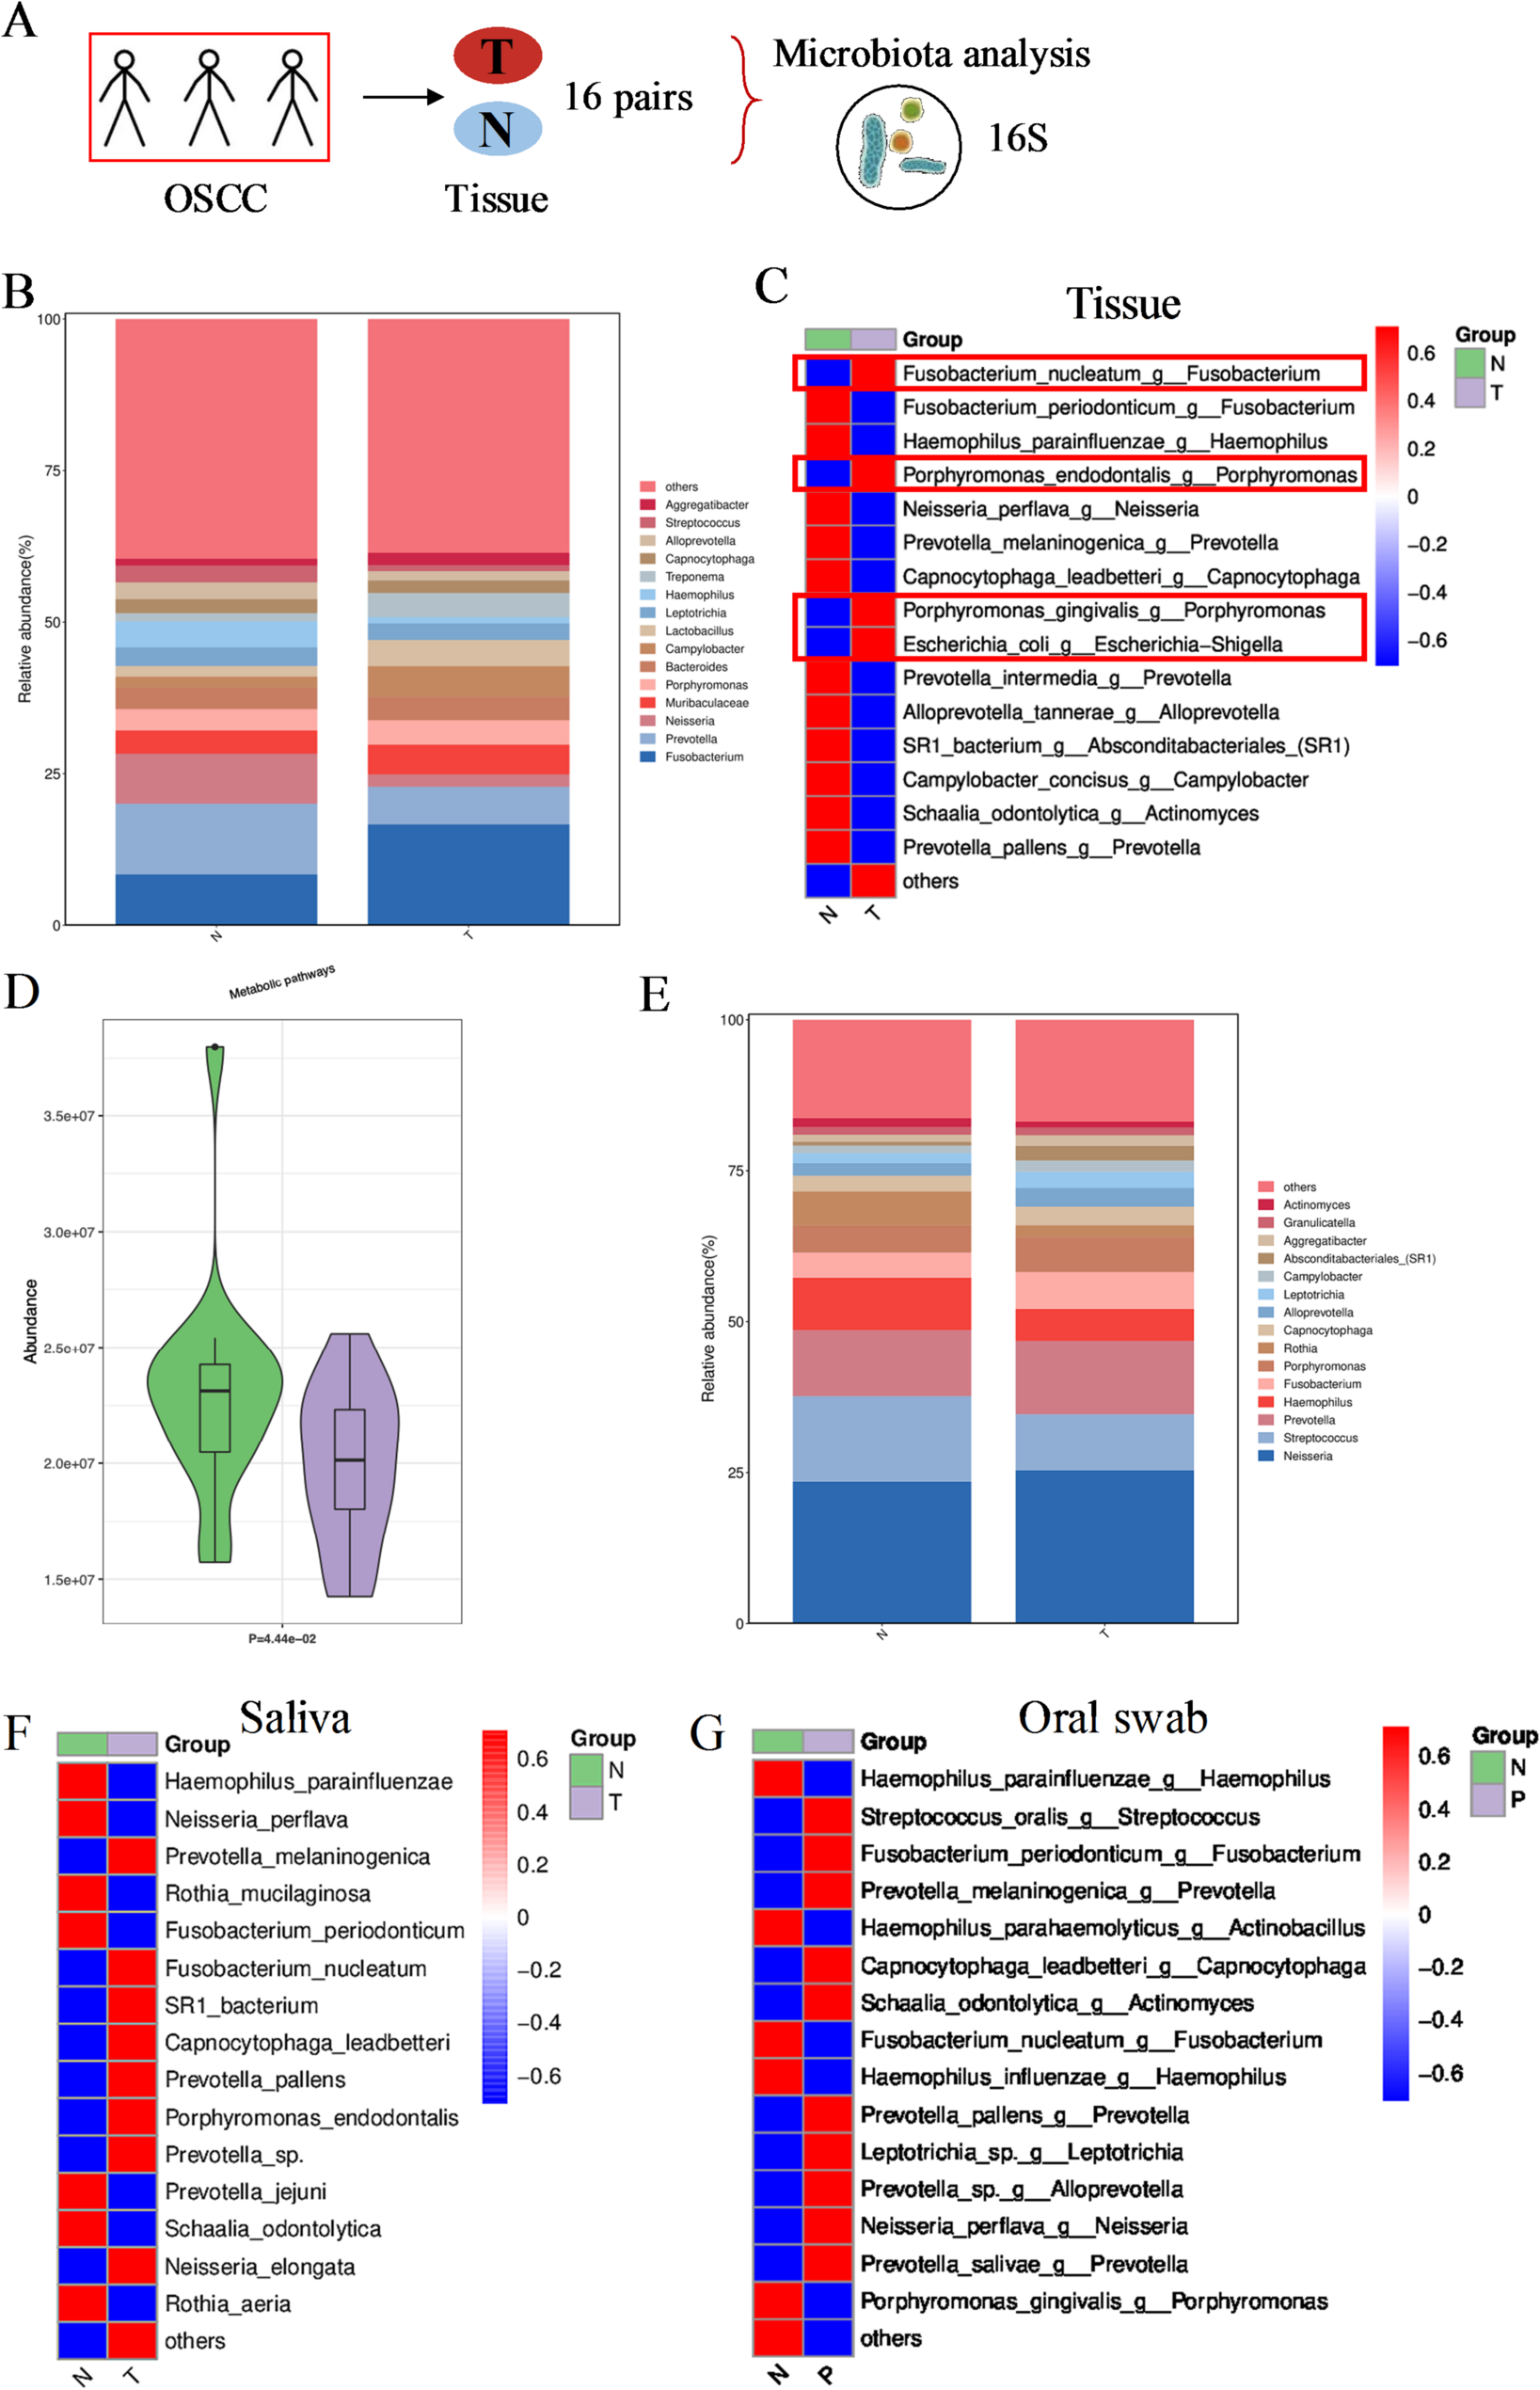
The oral cancer tissues and adjacent normal tissues from patients with oral squamous cell carcinoma (OSCC) were collected to explore the tissue microbiota by 16S rRNA sequencing. The saliva and oral swabs from OSCC patients and healthy individuals were also collected to detect the oral microbiota. The participants had no antibiotic use in the past one month before sampling. Moreover, analysis of metabolites from cancer tissues compared with adjacent normal tissues and saliva from OSCC patients compared with healthy individuals was performed by liquid chromatograph-mass spectrometry (LC-MS/MS) and gas chromatograph-mass spectrometry (GC-MS). This study was approved by Shanghai Ninth People’s Hospital Ethics Committee.
Sample collection
The oral cancer tissues and adjacent tissues were collected by sterile surgical instruments and frozen in sterile tubes at -80℃. These cancer tissues were collected from two different batches including 7 paired tissues in first batch and 9 paired ones in second batch. These 16 paired tissues from two batches were subjected to 16S rRNA sequencing, and the 9 paired tissues in second batch were also performed metabolite analysis by LC-MS/MS and GC-MS.
The saliva from patients with OSCC and healthy individuals were collected in sterile cup with cover and transferred into sterile tubes frozen at -80℃. A total of 13 saliva from patients and 13 saliva from healthy individuals were subjected to detect microbiota by 16S rRNA sequencing. Additionally, a total of 9 saliva from patients and 7 saliva from healthy individuals were subjected to metabolite analysis by LC-MS/MS and GC-MS.
The oral swabs from patients with OSCC and healthy individuals were collected and stored at -80℃. A total of 9 oral swabs from patients and 9 oral swabs from healthy individuals were subjected to detect microbiota by 16S rRNA sequencing.
16S rRNA sequencing
Total genomic DNA from tissues/saliva/oral swabs was extracted using DNA Extraction Kit following the manufacturer’s instructions. Concentration of DNA was verified with NanoDrop and agarose gel. The genome DNA was used as template for PCR amplification with the barcoded primers and Tks Gflex DNA Polymerase (Takara). V3-V4 variable regions of 16S rRNA genes was amplified with universal primers 343F (5’-TACGGRAGGCAGCAG-3’) and 798R (5’-AGGGTATCTAATCCT-3’). Amplicon quality was visualized using gel electrophoresis, purified with AMPure XP beads (Agencourt), and amplified for another round of PCR. After purified with the AMPure XP beads again, the final amplicon was quantified using Qubit dsDNA assay kit. Equal amounts of purified amplicon were pooled for subsequent sequencing. Raw sequencing data were in FASTQ format. Paired-end reads were then preprocessed using cutadapt software to detect and cut off the adapter. After trimming, paired-end reads were filtering low quality sequences, denoised, merged and detect and cut off the chimera reads using DADA2 with the default parameters of QIIME2 (2020.11). At last, the software output the representative reads and the amplicon sequence variant (ASV) abundance table. The representative read of each ASV was selected using QIIME2 package. All representative reads were annotated and blasted against Silva database Version 138 or Unite using q2-feature-classifier with the default parameters. The amplicon sequencing and analysis were conducted by OE biotech Co., Ltd. (Shanghai, China).
LC-MS/MS
Tissues or saliva stored at -80℃ were thawed at room temperature. 30 mg tissues or 100 µL saliva was added to a 1.5 mL Eppendorf tube with L-2-chlorophenylalanine (0.06 mg/mL) dissolved in methanol as internal standard, and the tube was vortexed. Subsequently, ice-cold mixture of methanol and acetonitrile was added, and the mixtures were vortexed for 1 min, and the whole samples were extracted by ultrasonic for 10 min in ice-water bath, stored at -20 ℃ for 30 min. The extract was centrifuged at 4 °C (13000 rpm) for 10 min. 120 µL of supernatant in a glass vial was dried in a freeze concentration centrifugal dryer. Also, the mixture of methanol and water (1/4, vol/vol) were added to each sample, samples vortexed for 30 s, extracted by ultrasonic for 3 min in ice-water bat, then placed at -20 °C for 2 h. Samples were centrifuged at 4 °C (13000 rpm) for 10 min. The supernatants (150 µL) from each tube were collected using crystal syringes, filtered through 0.22 μm microfilters and transferred to LC vials. The vials were stored at -80 °C until LC-MS analysis. QC samples were prepared by mixing aliquot of the all samples to be a pooled sample.
An ACQUITY UPLC I-Class plus (Waters Corporation, Milford, USA) fitted with Q-Exactive mass spectrometer equipped with heated electrospray ionization (ESI) source (Thermo Fisher Scientific, Waltham, MA, USA) was used to analyze the metabolic profiling in both ESI positive and ESI negative ion modes. An ACQUITY UPLC HSS T3 column (1.8 μm, 2.1 × 100 mm) were employed in both positive and negative modes. The binary gradient elution system consisted of (A) water (containing 0.1% formic acid, v/v) and (B) acetonitrile (containing 0.1% formic acid, v/v) and separation was achieved using the following gradient: 0.01 min, 5% B; 2 min, 5% B; 4 min, 30% B; 8 min, 50% B; 10 min, 80% B; 14 min, 100% B; 15 min, 100% B; 15.1 min, 5% and 16 min, 5%B. The flow rate was 0.35 mL/min and column temperature was 45℃. All the samples were kept at 10℃ during the analysis.
The original LC-MS data were processed by software Progenesis QI V3.0 (Nonlinear, Dynamics, Newcastle, UK) for baseline filtering, peak identification, integral, retention time correction, peak alignment, and normalization. Main parameters of 5 ppm precursor tolerance, 10 ppm product tolerance, and 5% product ion threshold were applied. Compound identification were based on precise mass-to-charge ratio (M/z), secondary fragments, and isotopic distribution using The Human Metabolome Database (HMDB), Lipidmaps (V2.3), Metlin, and self-built databases. The extracted data were then further processed by removing any peaks with a missing value (ion intensity = 0) in more than 50% in groups, by replacing zero value by half of the minimum value, and by screening according to the qualitative results of the compound. Compounds with resulting scores below 36 (out of 60) points were also deemed to be inaccurate and removed. A data matrix was combined from the positive and negative ion data. The metabolomic data analysis was performed by Shanghai Luming biological technology Co., Ltd (Shanghai, China).
GC-MS
Tissues or saliva stored at -80℃ were thawed at room temperature. 30 mg tissues or 100 µL saliva was added to a 1.5 mL Eppendorf tube with L-2-chlorophenylalanine (0.06 mg/mL) dissolved in methanol as internal standard, and the tube was vortexed for 10 s. Subsequently, ice-cold mixture of methanol and acetonitrile (2/1, vol/vol) was added, and the mixtures were vortexed for 30 s, and the whole samples were extracted by ultrasonic for 10 min in ice-water bath, stored at -20℃ for 30 min. The extract was centrifuged at 4 °C (13000 rpm) for 10 min. The supernatant in a glass vial was dried in a freeze concentration centrifugal dryer. An aliquot of the 120 µL supernatant was transferred to a glass sampling vial for vacuum-dry at room temperature. And 80 µL of 15 mg/mL methoxylamine hydrochloride in pyridine was subsequently added. The resultant mixture was vortexed vigorously for 2 min and incubated at 37 °C for 90 min. 50 µL of BSTFA and 20 µL n-hexane were added into the mixture, which was vortexed vigorously for 2 min and then derivatized at 70 °C for 60 min. The samples were placed at ambient temperature for 30 min before GC-MS analysis. QC samples were prepared by mixing aliquot of the all samples to be a pooled sample.
The derivatived samples were analyzed on an Agilent 7890B gas chromatography system coupled to an Agilent 5977 A MSD system (Agilent Technologies Inc., CA, USA). A DB-5MS fused-silica Capillary Column (30 m × 0.25 mm × 0.25 μm, Agilent J & W Scientific, Folsom, CA, USA) was utilized to separate the derivatives. Helium (> 99.999%) was used as the carrier gas at a constant flow rate of 1 mL/min through the column. The injector temperature was maintained at 260℃. The initial oven temperature was 60℃ held at 60 °C for 0.5 min, ramped to 125℃ at a rate of 8℃/min, to 210℃ at a rate of 5℃/min, to 270℃ at a rate of 10℃/min, to 305℃ at a rate of 20℃/min, and finally held at 305℃ for 5 min. The temperature of MS quadrupole and ion source (electron impact) was set to 150 and 230℃, respectively. The collision energy was 70 eV. Mass spectrometric data was acquired in a full-scan mode (m/z 50–500).
The obtained GC/MS raw data in.D format were transferred to.abf format via software Analysis Base File Converter for quick retrieval of data. Then, data were imported into software MS-DIAL, which performs peak detection, peak identification, MS2Dec deconvolution, characterization, peak alignment, wave filtering, and missing value interpolation. Metabolite characterization was based on LUG database. A data matrix was derived. The three-dimensional matrix includes: sample information, the name of the peak of each substance, retention time, retention index, mass-to-charge ratio, and signal intensity. In each sample, all peak signal intensities were segmented and normalized according to the internal standards with RSD < 0.1 after screening. After the data was normalized, redundancy removal and peak merging were conducted to obtain the data matrix. The metabolomic data analysis was performed by Shanghai Luming biological technology Co., Ltd (Shanghai, China).
Statistical analysis
For 16S rRNA sequencing, the quality control of raw reads was performed to gain clean tags. And the clean tags were filtered, denoised and cleaned off the chimera reads to get the valid tags. The valid tags were normalized and shown in ASV abundance tables. The community structure of bacteria was shown by barplot at top 15 genus levels and shown by heatmap at top 15 species levels. The barplot at top 15 genus levels and the heatmap at top 15 species levels between the oral cancer tissues and adjacent tissues were compared using t-test or Wlicoxon test. The heatmaps at top 15 species levels of saliva and oral swabs between OSCC patients and healthy individuals were also compared using t-test or Wlicoxon test. Kyoto Encyclopedia of Genes and Genomes (KEGG) analysis based on 16S rRNA data between the oral cancer tissues and adjacent tissues was conducted and compared using t-test, and top fifteen KEGG pathways were displayed.
For analysis of metabolites, internal quality control samples were included for LC-MS/MS and GC-MS quality control. Principle component analysis (PCA) was used to evaluated and assessed for the quality. A two-tailed Student’s t-test was further used to verify whether the metabolites of difference between two groups were significant. Differential metabolites were selected with VIP values greater than 1.0 and p-values less than 0.05. Differential metabolites were further used to for KEGG pathway (http://www.genome.jp/kegg/) enrichment analysis.


Comments (0)