
Remember me
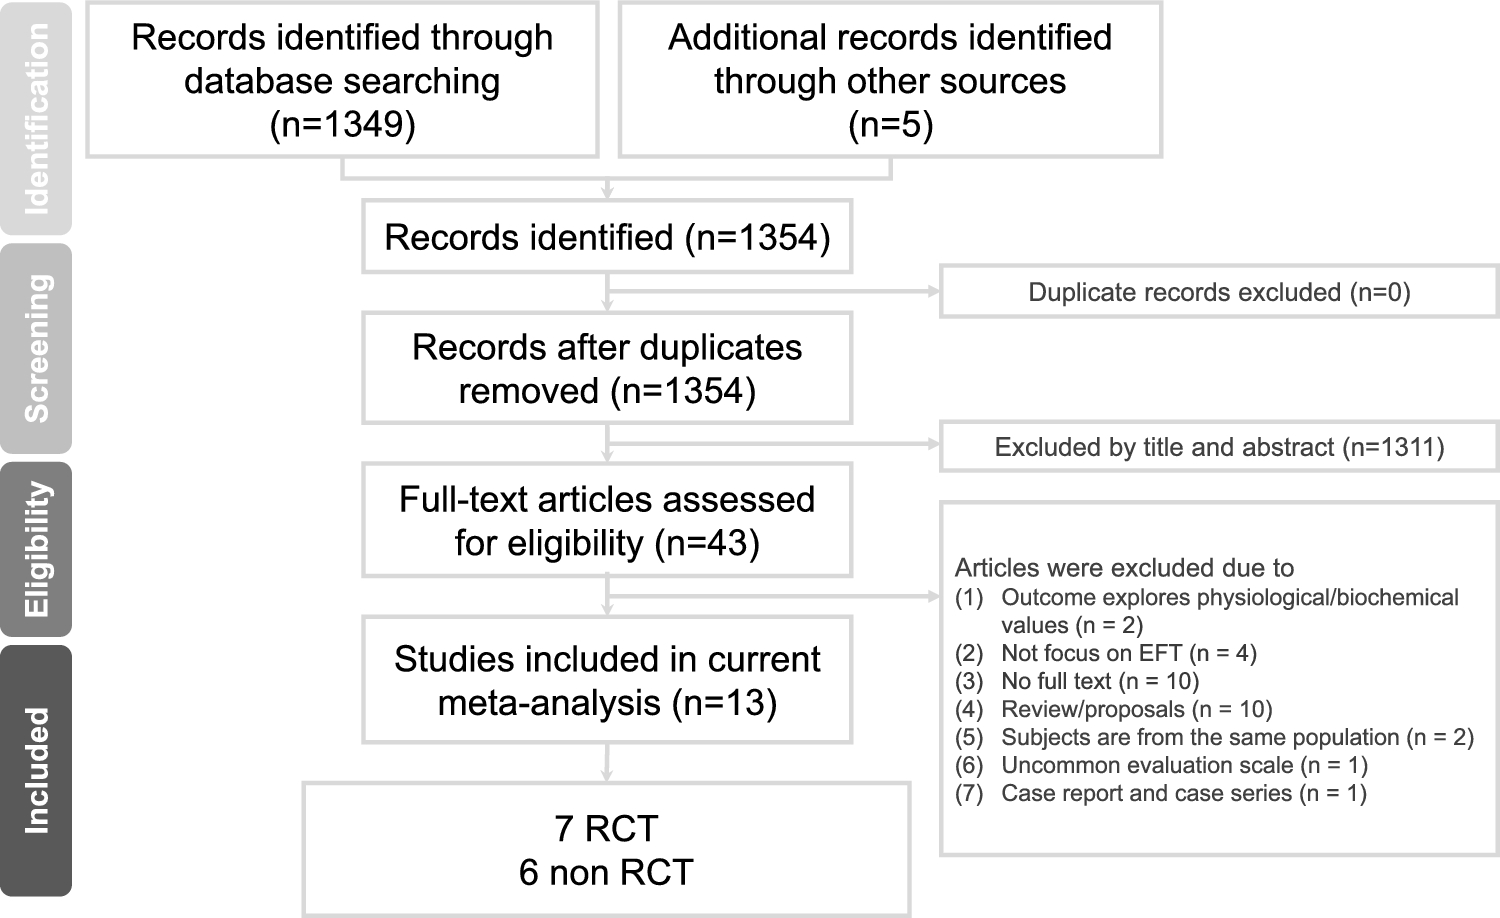
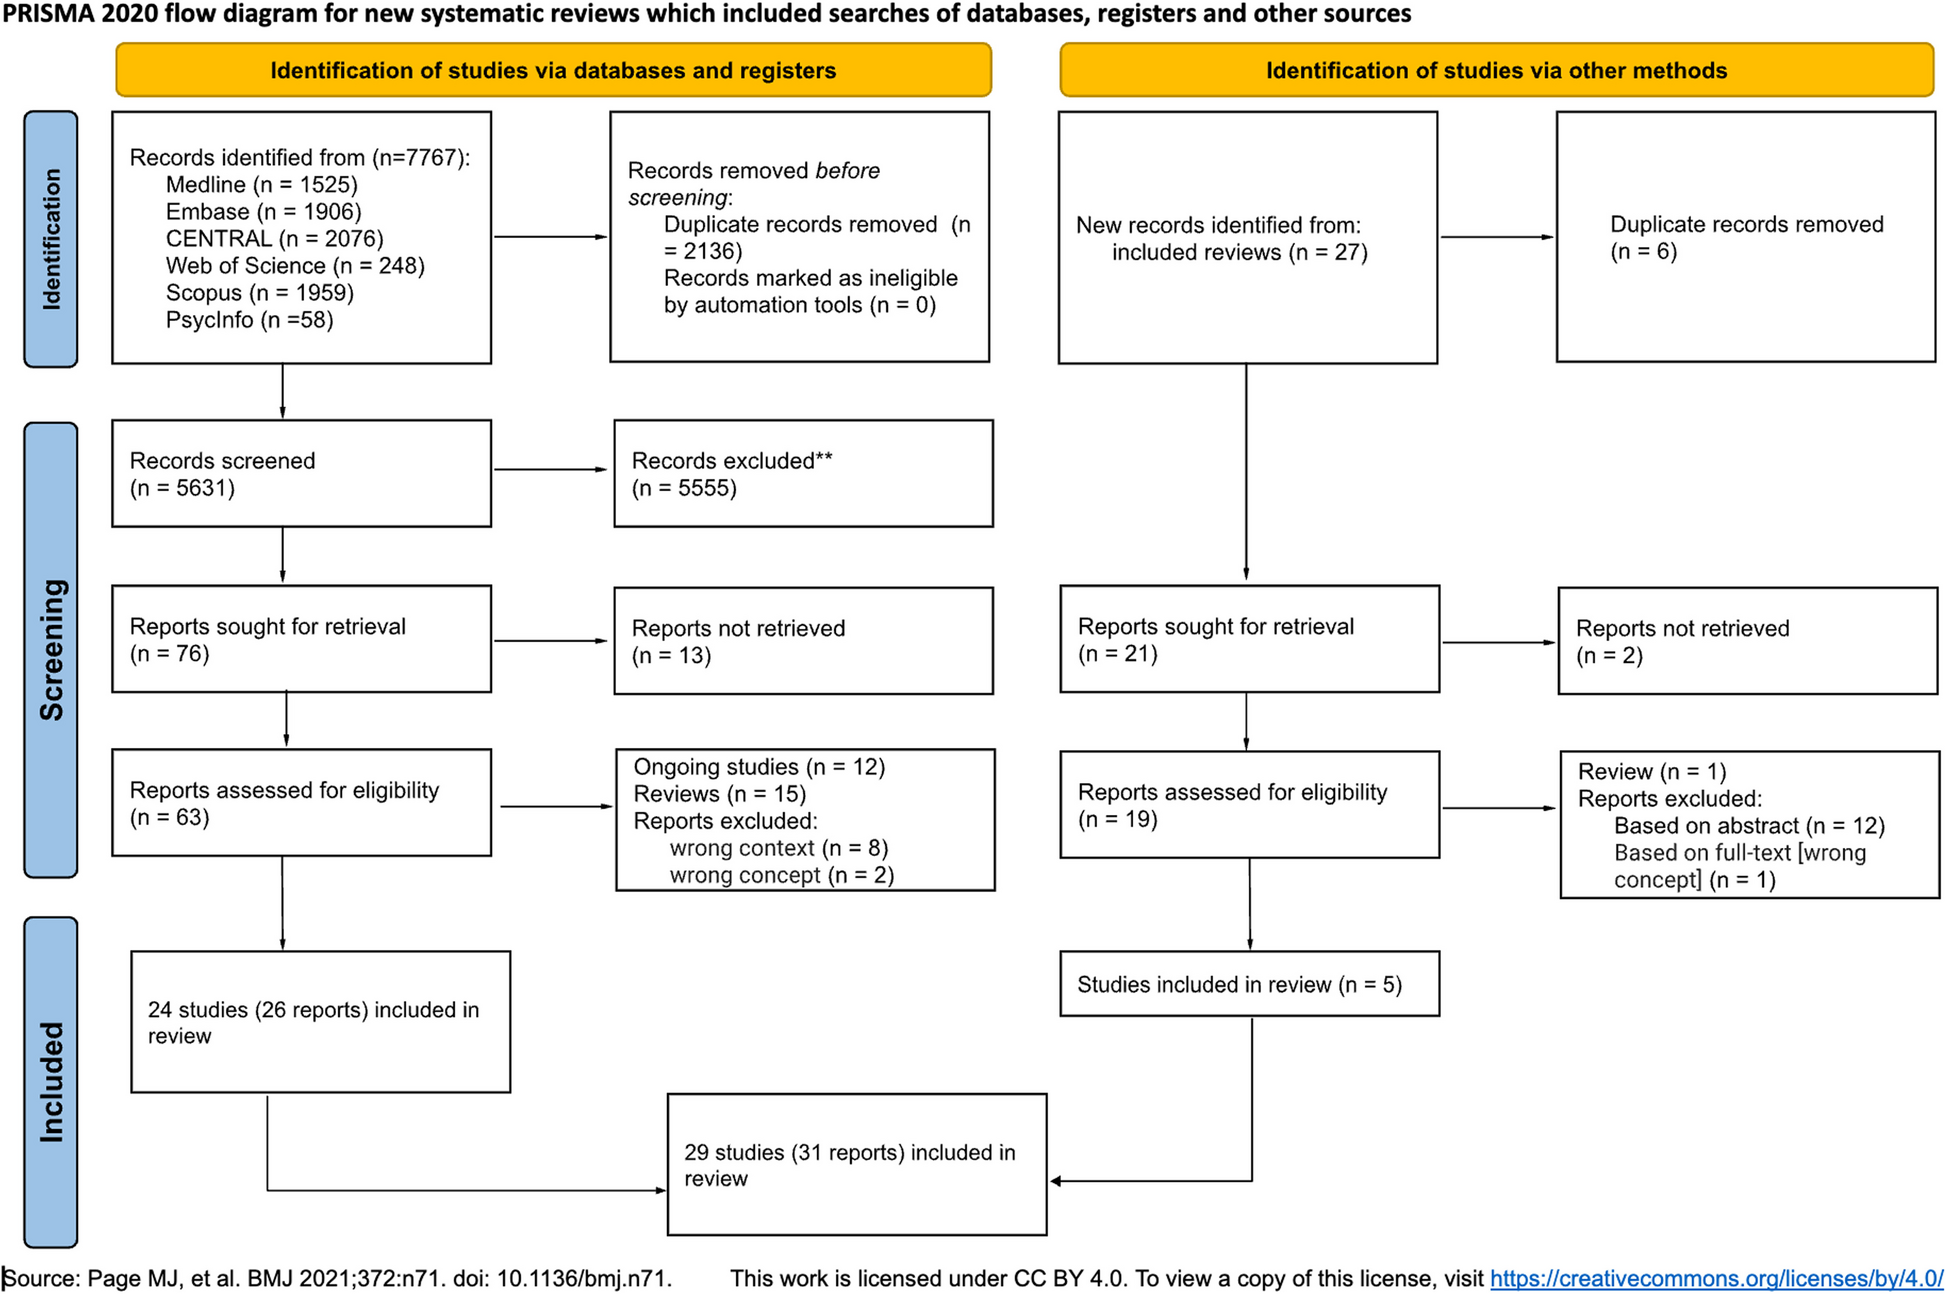
As per our pre-registered protocol (PROSPERO ID CRD42024578766), we searched different databases until September 2024. Using the search strategies defined previously, 112 studies were retrieved from different databases. Thirty four duplicates were removed. Of the 25 articles assessed for eligibility, 23 met the inclusion criteria and were included as pertinent to the objectives of this systematic review. Among them, 22 articles were involved in the final meta-analysis. Figure 1 illustrates the outcomes of the search, along with the reasons for exclusion during the study selection process. A risk of bias assessment was conducted among 23 eligible studies employing JBI criteria for qualitative and quantitative studies, as presented in (S3 JBI score), revealing that all of the studies had a low risk of bias in general.
Fig. 1
Preferred reporting items for systematic review and meta- analysis 2020 flow diagram of the study retrieval process
Characteristics of the studiesOverall, 23 studies evaluating the magnitude of non-adherence were included in this systematic review and meta-analysis. The number of participants involved in this study was 8,297 individuals with different mental disorders. Of those, 4,554 (57.18%) were schizophrenic, 1,524, and 847 were patients with MDD and BD, respectively. Among them, 3,388 participants were female in gender. Except for the study by Teferra et al. [48], which was a qualitative cohort study, all other studies were hospital-based cross-sectional quantitative in nature.
Subjective rating of medication adherence, such as self-reported measures of adherence, was the most commonly used type of measure. Thirteen studies utilize MMAS, 5 of them employed 4-item, whereas the rest 8 of them utilize 8-item MMAS. Among 13 studies using MMAS, non-adherence prevalence ranged from 32.60% [49] to 84.70% [18]. Five studies reported the prevalence of non-adherence assessed by the MARS method, with non-adherence ranging from 26% [17] to 51.2% [50]. Three studies used a self-reporting questionnaire technique developed after consulting relevant literature, with non-adherence ranging from 28.40% [51] in schizophrenics to 65.79% in shizophrenia and other psychotic disorders, MDD, BD, and AD [52]. Lastly, only one study employed objective pharmacy refill data, which is a compliant fill rate method, plus a subjective self-reporting method via a structured questionnaire patient interview [53] (Table 1).
Table 1 General characteristics of included studies in this systematic review and meta-analysisPsychotropic medication non-adherenceTwenty-two original studies participated in meta-analysis to compute the pooled proportion of psychotropic medication non-adherence among psychiatric patients. The pooled prevalence of medication non-adherence among psychiatric disorders was 46% (95% CI: 40%, 52%) (Fig. 2).
Fig. 2
Forest plot for pooled prevalence of psychotropic medication non-adherence in psychiatric patients in Ethiopia. Box size corresponds with study weight (sample size). CI, Confidence Interval
Heterogeneity assessmentThe statistical test for heterogeneity revealed substantial variability among the studies, as indicated by Cochrane's Q statistic (χ2 = 683, p < 0.001). Additionally, the I2 statistic was 96.95% (p < 0.001), signifying a very high degree of inconsistency across the studies, suggesting that nearly all of the observed variation is due to heterogeneity rather than chance. The asymmetry of a forest plot provides visual insights into variability between studies (Fig. 2). In the Galbraith plot, there is a wide dispersion of point estimates away from the regression line, and some of them are even outside the shaded area, indicating high heterogeneity between estimates (Fig. 3).
Fig. 3
Galbraith plot (n = 22). Box size corresponds with study weight (sample size). CI, Confidence Interval
To further investigate the source of heterogeneity subgroup analysis, univariate meta-regression analysis and leave-one-out sensitivity analysis were conducted.
Subgroup analysisThis analysis was conducted involving different moderators. The moderators employed to ascertain the source of significant heterogeneity in this review included the province where the studies were conducted, adherence measurement methods, types of psychiatric disorders, diagnosis modality of psychiatric disorders, sample size, JBI quality score, and the year of publication.
Non-adherence status among severe mental disordersSubgroup analysis was conducted based on diagnosis type; severe mental disorders were considered due to the absence of segregated data on the other psychiatric disorders. The poor level of treatment maintenance among severe mental disorders (48%, 41%− 56%, I2 = 97.35%) is comparable to the pooled non-adherence level of general psychiatric patients (46%, 40%− 52%, I2 = 96.95). Non-adherence among patients with schizophrenia, MDD, and BD was 45% (39%− 52%, I2 = 94.65%), 53% (30%− 75%, I2 = 98.87), and 50% (44%− 56%, I2 = 35.9), respectively. A high level of heterogeneity persists in the two major severe mental disorders, schizophrenia and MDD (Figs. 4 and 5), while it is low in the case of the BD subgroup (Fig. 6).
Fig. 4
Forest plot for pooled prevalence of non-adherence in schizophrenic patients in Ethiopia. Box size corresponds with study weight (sample size). CI, Confidence Interval
Fig. 5
Forest plot for pooled prevalence of non-adherence in patients with MDD in Ethiopia. Box size corresponds with study weight (sample size). CI, Confidence Interval; MDD, Major Depressive Disorder
Fig. 6
Graphic representation for pooled prevalence of non-adherence in patients with bipolar disorder in Ethiopia. Box size corresponds with study weight (sample size). CI, Confidence Interval
Subgroup analysis in the other study characteristicsSubgroup analysis was conducted to assess variability between studies, considering some additional pertinent moderators. The second moderator next to disease type was adherence measurement methods such as MMAS- 4, MMAS- 8, MARS, and others (CFR and questionnaire methods). This adherence measurement scale difference might introduce heterogeneity between study estimates. The third moderator was the diagnosis modality of psychiatric disorders, which were DSM-IV and DSM-V guidelines. The difference in defining and diagnosing psychiatric disorders may cause heterogeneity. The next key moderator in our analysis is the year of study publication, specifically categorized as studies conducted before and after 2020. This cutoff point was chosen due to a significant healthcare reform in Ethiopia—by 2020, the country successfully expanded community-based health insurance to over 80% of districts. This reform aimed to increase access to affordable healthcare, including mental health services, which is likely to have influenced psychotropic medication treatment adherence rates [67]. Finally, sample size and the JBI quality score of the study may also be sources of heterogeneity.
As a result, heterogeneity in the prevalence of psychotropic treatment non-adherence among psychiatric patients across adherence measurement scales, diagnostic criteria, study quality, and study year of publication was insignificant, while the sample size (p = 0.03) and region where the study was conducted (p < 0.001) were found strongly significant. Therefore, sample size and study region might be part of the source of heterogeneity. A high level of heterogeneity still exists in all subgroups. The highest value of non-adherence level was observed among studies with small sample size (61%, 46%–76%, I2 = 96.61), while the lowest level was among studies involving medium sample size (39%, 33%–46%, I2 = 93.59). When we consider the pervasiveness of non-adherence from its measurement scale perspective, the highest prevalence of non-adherence was observed in MMAS- 8 (53%), and the lowest was in MARS (40%) (Table 2).
Table 2 Subgroup analysis of non-adherence prevalence among psychiatric patients: Exploring predictors of heterogeneity, 2024 Meta-regression analysisUnivariate meta-regression analysis revealed that the sample size and region were statistically significant with psychotropic treatment non-adherence level among psychiatric patients. This suggests that the study sample size and province moderates heterogeneity to some extent, but are not themselves a sole source of heterogeneity. As the sample size increased by a unit, the likelihood of risk of non-adherence rate decreases by a factor of 0.22 (β = − 0.22, 95% CI: − 0.34 − − 0.09) and 0.15 times (β = − 0.15, 95% CI: − 0.28 − − 0.03) in medium and large size samples, respectively; with a total proportion of non-adherence explained by the covariate sample size by 37.03% (adjusted R2 = 37.03). The inverse linear relationship between sample size and non-adherence was visualized graphically (Fig. 7).
Fig. 7
Graphical representation of the relationship between sample size and psychotropic medication treatment non-adherence among psychiatric patients in Ethiopia, 2024 (n = 22)
Besides, the pooled prevalence of non-adherence was higher in the Amhara region as compared to Tigray regional state of Ethiopia (β = 0.26, 95% CI: 0.02 − 0.49) (Table 3).
Table 3 Univariate meta-regression analysis results for the prevalence of psychotropic medication non-adherence rate in Ethiopia, 2024Sensitivity analysisLeave-one-out analysis illustrating the subjective assessment of outliers. Each point estimate in this analysis represents the pooled effect size in the absence of that corresponding individual study and its 95% confidence interval. The analysis result revealed that there is no single study that affected the pooled estimate, as the overall estimate (0.46) is included within the confidence interval of all included studies (S1 Table).
Publication biasSmall study effect was assessed through subjective examination of the funnel plot of standard error of non-adherence prevalence by its logit of non-adherence status and Egger’s and Begg’s regression test. Funnel plot illustrates absence of publication bias due to its symmetrical nature (S1 Fig). The observed beta1 value of 3.47, with a standard error (SE) of beta1 = 6.04, yielded a z-statistic of 0.58, resulting in a probability (Prob >|z|) of 0.57. This statistically insignificant result in Egger’s test suggests the absence of publication bias. Furthermore, Begg’s test, examining small-study effects through Kendall’s score, revealed a score of 53.00 with a standard error of 34.89. The associated z-statistic of 1.49 and a probability (Prob >|z|) of 0.14 suggest no significant evidence of small-study effects according to Begg’s test. These statistical test results supplemented the potential symmetry in the distribution of effect sizes in the funnel plot.
Predictive factors of non-adherenceAll involved studies (n = 22) reported at least one influencing factor on psychotropic treatment adherence, except one study [54] (Table 4). Thirty influencing factors were extracted and then categorized into eight groups: sociodemographic factors, patient-related factors, lack of insight-related factors, self-stigma-related factors, negative attitude towards treatment factors, drug-related factors, substance use behaviour, and social support status. Despite the fact that grouping.
Table 4 Predictive factors of psychotropic treatment non-adherence among psychiatric patients in Ethiopiadifferent factors into one category may introduce heterogeneity, we made a deliberate and prudent decision to pool them in order to accurately assess the overall association of these potential risk factors with non-adherence (Table 4). The presence of publication bias was checked via funnel plots, Begg’s test and regression-based Egger’s test under a random-effects model employing DerSimonian–Laird method (Table 5). Finally, stability of point estimate was assessed via leave-one-out sensitivity analysis.
Table 5 Predictor variables for psychotropic treatment non-adherence among psychiatric patientsSociodemographic factorsFactors such as hospital distance taking ≥ 2 h, being unemployed, poor quality of life, illiteracy, older adults, being single, and rural living status were found to be predictors of non-adherence [17, 18, 23, 49, 55,56,57, 60, 64]. The results of the meta-analysis revealed that psychiatric patients who were characterized by those sociodemographic-related factors were 1.58 times at a higher risk of developing non-adherence to their psychotropic treatment after controlling patient-related factors, lack of insight related factors, negative attitude on psychotropic treatment related factors, social support status related factors, self-stigma, substance abuse, and drug-related factors. High levels of heterogeneity were noted, and the stability of the overall estimate was confirmed by leave-one-out sensitivity analysis (S2 Table). Additionally, no small study effect was found.
Patient-related factorsSix data sets that were concerned with the chronic nature of the disease, comorbidity, and regularity of follow-ups were collected from participant studies. Meta-analysis showed that patient-related factors. meaning that disease duration greater than 2 years, comorbid psychiatric illnesses, and irregular follow-up history were predictive factors for psychotropic medication non-adherence [55, 58, 65, 66, 68]. Low levels of heterogeneity were noted, and the stability of the overall estimate was confirmed by leave-one-out sensitivity analysis (S3 Table). Furthermore, no small study effect was found.
Lack of insightSix levels of insight about the illness and treatment data sets, such as perceived spiritual causation, employing religious treatment options, and poor/no insights were collected from five studies [16, 23, 49, 57, 62]. Psychiatric patients who have poor insight about their illness and treatment carry 1.24 times higher risk of being non-adherent to psychotropic therapy due to lack of awareness or understanding of one's illness and the need for treatment. Moderate levels of heterogeneity were noted, and the stability of the overall estimate was confirmed by leave-one-out sensitivity analysis (S4 Table). Furthermore, no small study effect was found.
Negative attitude towards treatmentEffect of negative attitude on psychotropic treatment non-adherence is analyzed involving five studies [16, 58, 60, 63, 66] revealing a 1.28 times high risk of non-adherence in psychopharmacology as compared to those having a positive attitude toward their treatment. Neither small-study effect nor significant level of heterogeneity was identified. The stability of the overall estimate was confirmed by leave-one-out sensitivity analysis. (S5 Table).
Social supportSeven association data sets on social support status of psychiatric patients with psychotropic treatment non-adherence level were extracted and pooled by random effects meta-analysis [49, 57, 58, 60, 63, 65, 66]. This study revealed that no/poor social or family support was a risk factor for medication non-adherence by 1.39 times as compared to those having good social support. High levels of heterogeneity were noted, and the stability of the overall estimate was confirmed by leave-one-out sensitivity analysis (S6 Table). Furthermore, no small study effect was found.
Self-stigmaMeta-analysis on this association evaluation was done involving five studies [16, 17, 58, 60, 63]. Six data sets, such as moderate to high self-stigma and related suicidal attempts were collected. This analysis revealed that the perception or the feeling of psychiatric patients being stigmatized by their families, neighbors, health professionals, and other community members was a risk factor for psychotropic medication non-adherence by 1.57 times. Low levels of heterogeneity were noted, and the stability of the overall estimate was confirmed by leave-one-out sensitivity analysis (S7 Table). Furthermore, no small study effect was found.
Substance useEleven studies found the association of substance abuse risk behaviour with drug non-adherence among psychiatric patients [16, 23, 49, 50, 52, 56, 58, 60, 63, 64, 66]. Individuals who abuse substances, such as alcohol use, khat chewing, cannabis use, and cigarette smoking, were 16% less likely to be non-adherent than those who did not use substance [aOR = 0.84 95% CI: (0.71–0.97)]. High levels of heterogeneity were noted, and the stability of the overall estimate was confirmed by leave-one-out sensitivity analysis (S8 Table). Furthermore, no small study effect was found.
Drug-related factorsTwenty-six drug-related data sets were extracted from twelve studies [17, 18, 23, 50, 52, 57,
Comments (0)