
Remember me
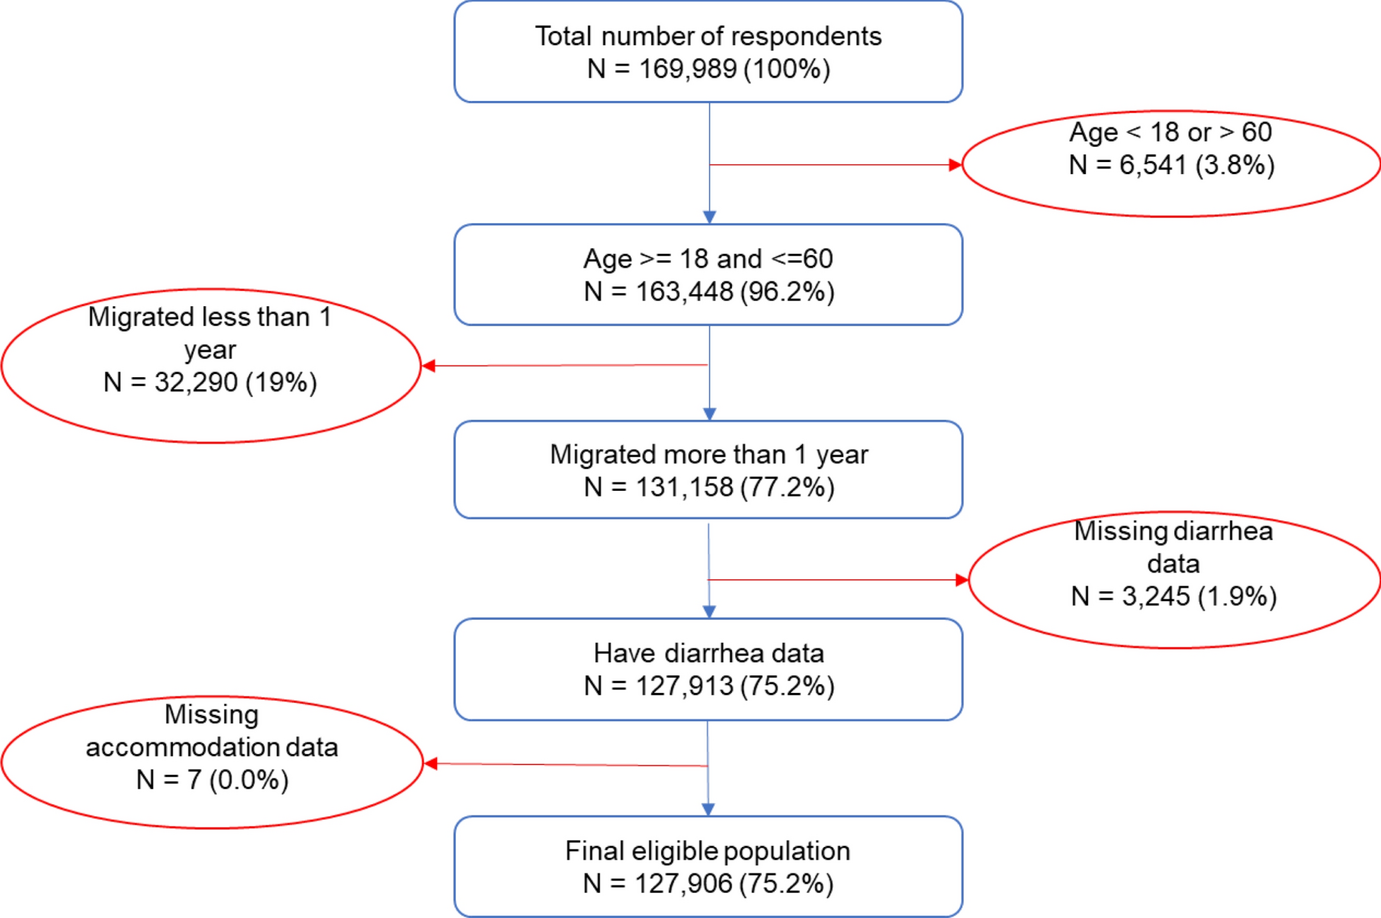
The peer-reviewed literature search identified 6,512 electronic database records; 341 were selected for full-text screening and 77 met the inclusion criteria. The grey literature search identified 1,881 records from electronic database searches (n = 1,517) and websites or targeted domains (n = 364). Of the 75 full-text records screened, 24 met the inclusion criteria. The most common reason for exclusion was loneliness not being a primary intervention aim or the study not having a validated measure of loneliness. Duplicates between the peer-reviewed literature search and grey literature search were removed at the full-text screening stage. In total, data were extracted from 95 records; some records reported multiple intervention arms which were extracted separately, leading to 101 interventions included in the final sample for analysis (Fig. 1).
Fig. 1 Study characteristics
A summary of included studies is provided in Table 1. Peer-reviewed publications were most common (n = 79), with all other evidence coming from evaluation reports (n = 23). Approximately, half of studies examined older adults (aged ≥ 50; n = 56), a third examined adults aged 19 to 49 (n = 31), and a small proportion focussed on younger participants (aged < 18; n = 7), with three studies including participants from across the full life span (ages 8–83 [35]). Most studies were conducted in Europe and North America (n = 48 (51%) and n = 34 (36%), respectively), with a rise in publication rate in recent years (25% in 2021 and 16% in 2022). More than half of studies had no control group (n = 49; 52%) or randomisation (n = 54; 57%); the majority of those which did randomised participants individually (n = 23; 24%), whilst 14 used a wait-list control group (15%), and 4 used cluster randomisation (4%). The UCLA Loneliness Scale [36], ranging from 3 to 20 items, was the most common standardised loneliness measure in the sample (n = 66; 63%), followed by the De Jong Gierveld Scale [37] (n = 23; 22%) or a single-item direct measures of loneliness such as “How often do you feel lonely?” (n = 8; 8%).
Table 1 Study characteristics of each intervention (n = 101)Key findings by themeInterventions were categorised thematically during analysis into (1) psychological (n = 23), (2) social interaction (n = 23), and (3) social support (n = 46). Figure 2 describes a summary of the primary meta-analyses across sub-themes for psychological (− 0.79, 95%CI: [− 1.19, − 0.38]; large effect size), social interaction (− 0.50, 95%CI: [− 0.78, − 0.17]; medium effect size), and social support (− 0.34, 95%CI: [− 0.45, − 0.22]; small-medium effect size) groupings, ordered by pooled effect size; see subsequent sections for a breakdown by theme and sub-theme. Negative effect sizes demonstrate a reduction in loneliness score from pre- to post-intervention. Nine studies were cross-cutting and comprised two or more themes which could not be grouped in the other categories. An overview of study characteristics is provided in Table 1 and intervention core themes are described in Table 2. Supplementary Tables S4–S7 provide study-level detail on country of intervention, sample size and description, and intervention delivery.
Fig. 2
Summary of pooled effect sizes by theme and sub-theme
Table 2 Breakdown of interventions by core themeTheme 1: psychologicalThere were 23 psychological studies categorised in two sub-themes: (1) 14 structured therapy-based interventions and (2) nine ‘other’ approaches. All but one intervention provided sufficient information to be included in the meta-analysis, which indicated a large overall effect size of − 0.79 (95% confidence interval: [− 1.19, − 0.38]), albeit with a wide confidence interval. When aggregated by sub-theme, there was a very large SMD effect size for therapy-based intervention (− 1.05 [− 1.80, − 0.29]; heterogeneity I2 = 83%) and a moderate effect size for interventions classed as ‘other’ (− 0.51 [− 0.79, − 0.23]; I2 = 61%) (see Fig. 3).
Fig. 3
Forest plot demonstrating the effect of psychological interventions by sub-theme on change in loneliness from pre- to post-intervention
Therapeutic approaches included cognitive behavioural therapy (CBT) [8, 9, 18, 38, 39], mindfulness for older adults [40], and group therapy approaches involving sand play [20], narrative therapy [41], laughter [17], and attachment-based therapy [42]. Studies included in the ‘other’ theme utilised psychological interventions to develop emotional and social skills amongst a range of target samples including older adults [43], adults with social anxiety disorder [44] and with adolescents (11–18 years) [45], and university students [46] (see Supplementary Table S4). Finally, sixteen studies also presented data from a control group (Fig. 4), which confirmed an overall large—albeit not statistically significant—effect of psychological interventions on loneliness (− 0.64 [− 1.37, 0.09]; I2 = 87%). When intervention characteristics were further investigated by dose or frequency, effectiveness was typically greater for interventions that lasted 1–2 months.
Fig. 4
Forest plot demonstrating the effect of psychological interventions on change in loneliness from pre- to post-intervention between intervention and control group
Theme 2: social interactionFrom the 23 interventions (n = 19 studies) included in the social interaction theme, there were three sub-themes: art, music, and culture interventions (n = 8); ‘other single-themed’ (n = 8) comprising spiritual, physical activity, animal/robot interaction, food delivery, and online social groups interventions, and (3) interventions involving multiple activities (n = 7), such as community-level recreational activities (see Supplementary Table S5 for study details). Eighteen studies were included in the main meta-analysis examining difference in scores from pre- to post-intervention (Fig. 5), giving an overall moderate effect size of − 0.50 [− 0.78, − 0.23], I2 = 82%.
Fig. 5
Forest plot demonstrating the effect of social interaction interventions by sub-theme on change in loneliness from pre- to post-intervention
Art, music, or culture-based interventions produced a large overall effect size (− 0.87 [− 1.64, − 0.09]), with larger effect sizes emerging for interventions that lasted at least 1–2 months. There was no evidence to suggest that ‘single-themed’ social interaction interventions alleviated loneliness (− 0.01 [− 0.16, 0.14]); however, interventions involving multiple activities showed a moderate overall effect size (− 0.54 [− 0.91, − 0.17]). The latter included a programme of social health promotion in older adult participants, a programme connecting senior migrants to leisure activities and library services [47] and a 12-week programme of recreational activities aimed at female prisoners[48]. Only six studies from the social interaction theme evaluated loneliness in both intervention and control groups (Fig. 6), with a moderate-large overall effect size of − 0.69 [− 1.24, − 0.13]; statistical heterogeneity remained high (I2 81%).
Fig. 6
Forest plot demonstrating the effect of social interaction interventions on change in loneliness from pre- to post-intervention between intervention and control group
Theme 3: social supportSocial support was the most common theme, with 46 social support interventions across 45 studies aggregated into five sub-themes: (1) befriending, mentoring, and peer support (n = 20); (2) educational or social skills development (n = 6); (3) social prescribing (n = 6); (4) information and communications technology (ICT) training (n = 5); and (5) interventions classified as ‘other’ (n = 9) (see Supplementary Table S7 for study details). The latter comprised various activities delivered at the community level and in healthcare settings. Forty-one studies provided mean loneliness scores pre- and post-intervention and could be included in the main meta-analysis; the overall effect for social support interventions was − 0.34 [− 0.45, − 0.22] (Fig. 7). Due partially to the high number of studies and partially to many studies identifying low to moderate effect sizes, the precision of the 95% CI was higher than previous themes; however, statistical heterogeneity remained high (I2 94%). Only 17 studies provided information on the change in loneliness for both the intervention group and control, with 12 studies included in the secondary meta-analysis; the overall effect size of the difference in change scores between groups was small (− 0.30 [− 0.48, − 0.11]; see Fig. 8).
Fig. 7
Forest plot demonstrating the effect of social support interventions by sub-theme on change in loneliness from pre- to post-intervention
Fig. 8
Forest plot demonstrating the effect of social support interventions on change in loneliness from pre- to post-intervention between intervention and control group
There was a moderate overall effect size for befriending, mentoring, or peer-support-based interventions (− 0.28 [− 0.42, − 0.14]). Two studies presented loneliness data from both mentor and mentee groups who participated in the intervention, with mixed evidence. For example, loneliness decreased in both mentors and mentees in an intervention delivered with older adults living in a care home [49], whereas a mentoring scheme with university student mentors and older adult mentees reported no significant change in either group [50].
There were mixed results for educational or social skills development interventions, with an overall moderate effect size of − 0.57 [− 1.09, − 0.05]. The greatest improvement in loneliness was demonstrated by a 4-week social skills support intervention for adults with symptoms of depression [51]. All social prescribing interventions were UK-based, lasting between 2 and 9 months and primarily involved link worker models targeting adults with clinical needs [52,53,54,55] or experiencing/at risk of experiencing loneliness [56, 57]; however, there was no significant change in loneliness (− 0.49 [− 1.07, 0.09]). Finally, ICT training interventions (− 0.37 [− 1.02, 0.27]) targeting older adults (≥ 50 years) and interventions classified as ‘other’ (− 0.16 [− 0.34, 0.02]) found non-significant changes in loneliness post-intervention. The latter included interventions such as using an Amazon Echo personal voice assistant with older adults [58], a 4-month multi-tier intervention consisting of group and one-to-one goal-orientated social internet-based activities [59] and helping intellectually disabled adults increase their social networks [60] (see Supplementary Table S6).
Multiple themesNine interventions involved activities that spanned two or more core themes. The majority were grey literature evaluation reports of national and city-wide programmes, largely aimed at older people (≥ 50), delivered following the UK’s national strategy [61] to tackle loneliness and social isolation in 2018. Four studies were included from The Ageing Better programme [62,63,64,65,66], which aimed to promote the active involvement of adults aged over 50 years in their communities. It involved multiple components including intensive one-to-one support, social prescribing/connector interventions, and social activities to promote social interaction (see Supplementary Table S7). Five studies reported mean loneliness scores pre- and post-intervention, with the four studies from The Ageing Better programme demonstrating improvements in loneliness over time (see Fig. 9) [62,63,64, 66]. Due to substantial differences in intervention (type, modality, delivery, context), no aggregate effect size was calculated; of note, all individual effect sizes were small (≤ 0.21; Fig. 9).
Fig. 9
Forest plot demonstrating individual effects of multiple theme interventions on change in loneliness from pre- to post-intervention
Publication bias and sensitivity analysesPublication bias is the failure to publish study results based on the direction or strength of the study findings [67]. There was no evidence of publication bias in the pre- and post-intervention meta-analysis of standardised mean differences, demonstrated by visual inspection of the funnel plot in Supplementary Figure S1 and the Egger’s test (p = 0.19). However, there was evidence of publication bias in the meta-analysis of differences in pre- and post-intervention loneliness scores between control and intervention groups (Supplementary Figure S1, Egger’s p < 0.001). Only 12 studies presented results stratified by subgroup characteristics; this included gender, age, socioeconomic status, ethnicity, caring status, and service use. Due to heterogeneity in reporting (different subgroups, prevalence of loneliness versus mean scores), it was not possible to synthesise and report this.
Using meta-analysis subgroup analyses, there was no difference in intervention effectiveness by region for psychological (p = 0.71), social support (p = 0.54) or social interaction (p = 0.35) interventions. Although there were no age group differences for social support (p = 0.75) or psychological (p = 0.70) interventions, subgroup analysis indicated that interventions in adults aged 19–49 (n = 3 studies; − 1.20 [− 2.72, 0.32]) may be slightly more effective than in adults aged 50 + (n = 12; − 0.38 [− 67, − 0.09]) (p = 0.02; Supplementary Figure S2).
Quality assessmentA total of 63% of studies scored as high quality (n = 60; 7–10 points), 37% as moderate (n = 35; 3–6 points), and none as low quality (0%; 0–2 points). The lack of studies categorised as low quality suggests that the checklist (Supplementary Table S2) is likely to have overestimated overall quality, further supported by the binary scoring of each eligibility criteria. The proportion of studies satisfying the fidelity and measures criteria was high (n = 92; 97% each), demonstrating that most studies in this review provided sufficient detail on intervention designs and used a standardised, validated measure of loneliness published independently. Consistency between the reported results and discussion was high (n = 84; 88%) and 86% of studies (n = 82) presented results from statistical analysis. An ‘intent-to-treat’ design was used by 82% of studies, which included individuals who were lost to follow-up.
Failure to report on the representativeness of study samples was the most common reason for studies not meeting the representative criteria (n = 68; 72% scored positively). The requirement of a minimum sample size of 20 participants completing the measures pre- and post-intervention was only achieved by 69% of studies (n = 66). There is likely to be substantial attrition bias across study samples as almost half the sample did not describe differences between baseline respondent samples and those lost to follow-up or meet the low attrition criterion of 35% of participants completing pre- and post-measures (n = 48; 51%). As many studies did not have control groups, scores on equivalence (n = 37; 39%) and counterfactual (n = 36; 38%) criteria were low; therefore, it is difficult to attribute any changes in participant loneliness to the interventions themselves. A breakdown of interventions by quality assessment score is shown in Supplementary Figure S3.
Comments (0)