Study design
In this study, sample size was determined based on previous publications. For in vitro assays, at least 3 independent experiments were conducted, each comprising a minimum of 3 biological replicates (i.e. independent cell cultures). For mouse experiments, each group included at least 5 animals. Randomization was performed for group allocation in the dorsal skinfold chamber model. Data analysis was conducted by investigators blinded to group assignments. No samples or animals were excluded. Detailed n values for each assay are provided in the figure legends.
Chemicals
Clioquinol, cycloheximide, and MG132 were purchased from Santa Cruz Biotechnology (Heidelberg, Germany). Chloroquine diphosphate salt was purchased from Sigma-Aldrich (Taufkirchen, Germany). Lenvatinib, tivozanib, and MK-2206 2HCl (MK-2206) were purchased from MedChemExpress (NJ, USA). Dimethyl sulfoxide (DMSO) was purchased from PanReac Applichem (Darmstadt, Germany).
Cell culture
Human umbilical vein endothelial cells (HUVECs), human dermal microvascular endothelial cells (HDMECs), and human pericytes from placenta (hPC-PLs) were purchased from PromoCell (Heidelberg, Germany). HUVECs were cultured in Endothelial Cell Growth Medium (EGM; PromoCell), HDMECs in EGM-MV (PromoCell), and hPC-PLs in Growth Medium 2 (PromoCell), all supplemented with the corresponding SupplementMix from PromoCell. Normal human dermal fibroblasts (NHDFs), generously provided by Dr. Wolfgang Metzger (Saarland University), were cultured in Dulbecco’s modified Eagle’s medium (PAA, Cölbe, Germany) supplemented with 10% fetal calf serum (FCS), 100 U/mL penicillin (PAA), and 0.1 mg/mL streptomycin (PAA). The murine luciferase-expressing TNBC cell line 4T1-Luc2 (RRID: CVCL_A4BM), the human TNBC cell line MDA-MB-231 (RRID: CVCL_0062), and the human non-TNBC cell line MCF-7 (RRID: CVCL_0031) were purchased from ATCC (Wesel, Germany) and cultured in RPMI 1640 medium with 10% FCS, 100 U/mL penicillin, and 0.1 mg/mL streptomycin. All cells were maintained in a humidified incubator at 37 °C with 5% CO2.
Water-soluble tetrazolium (WST)-1 assay
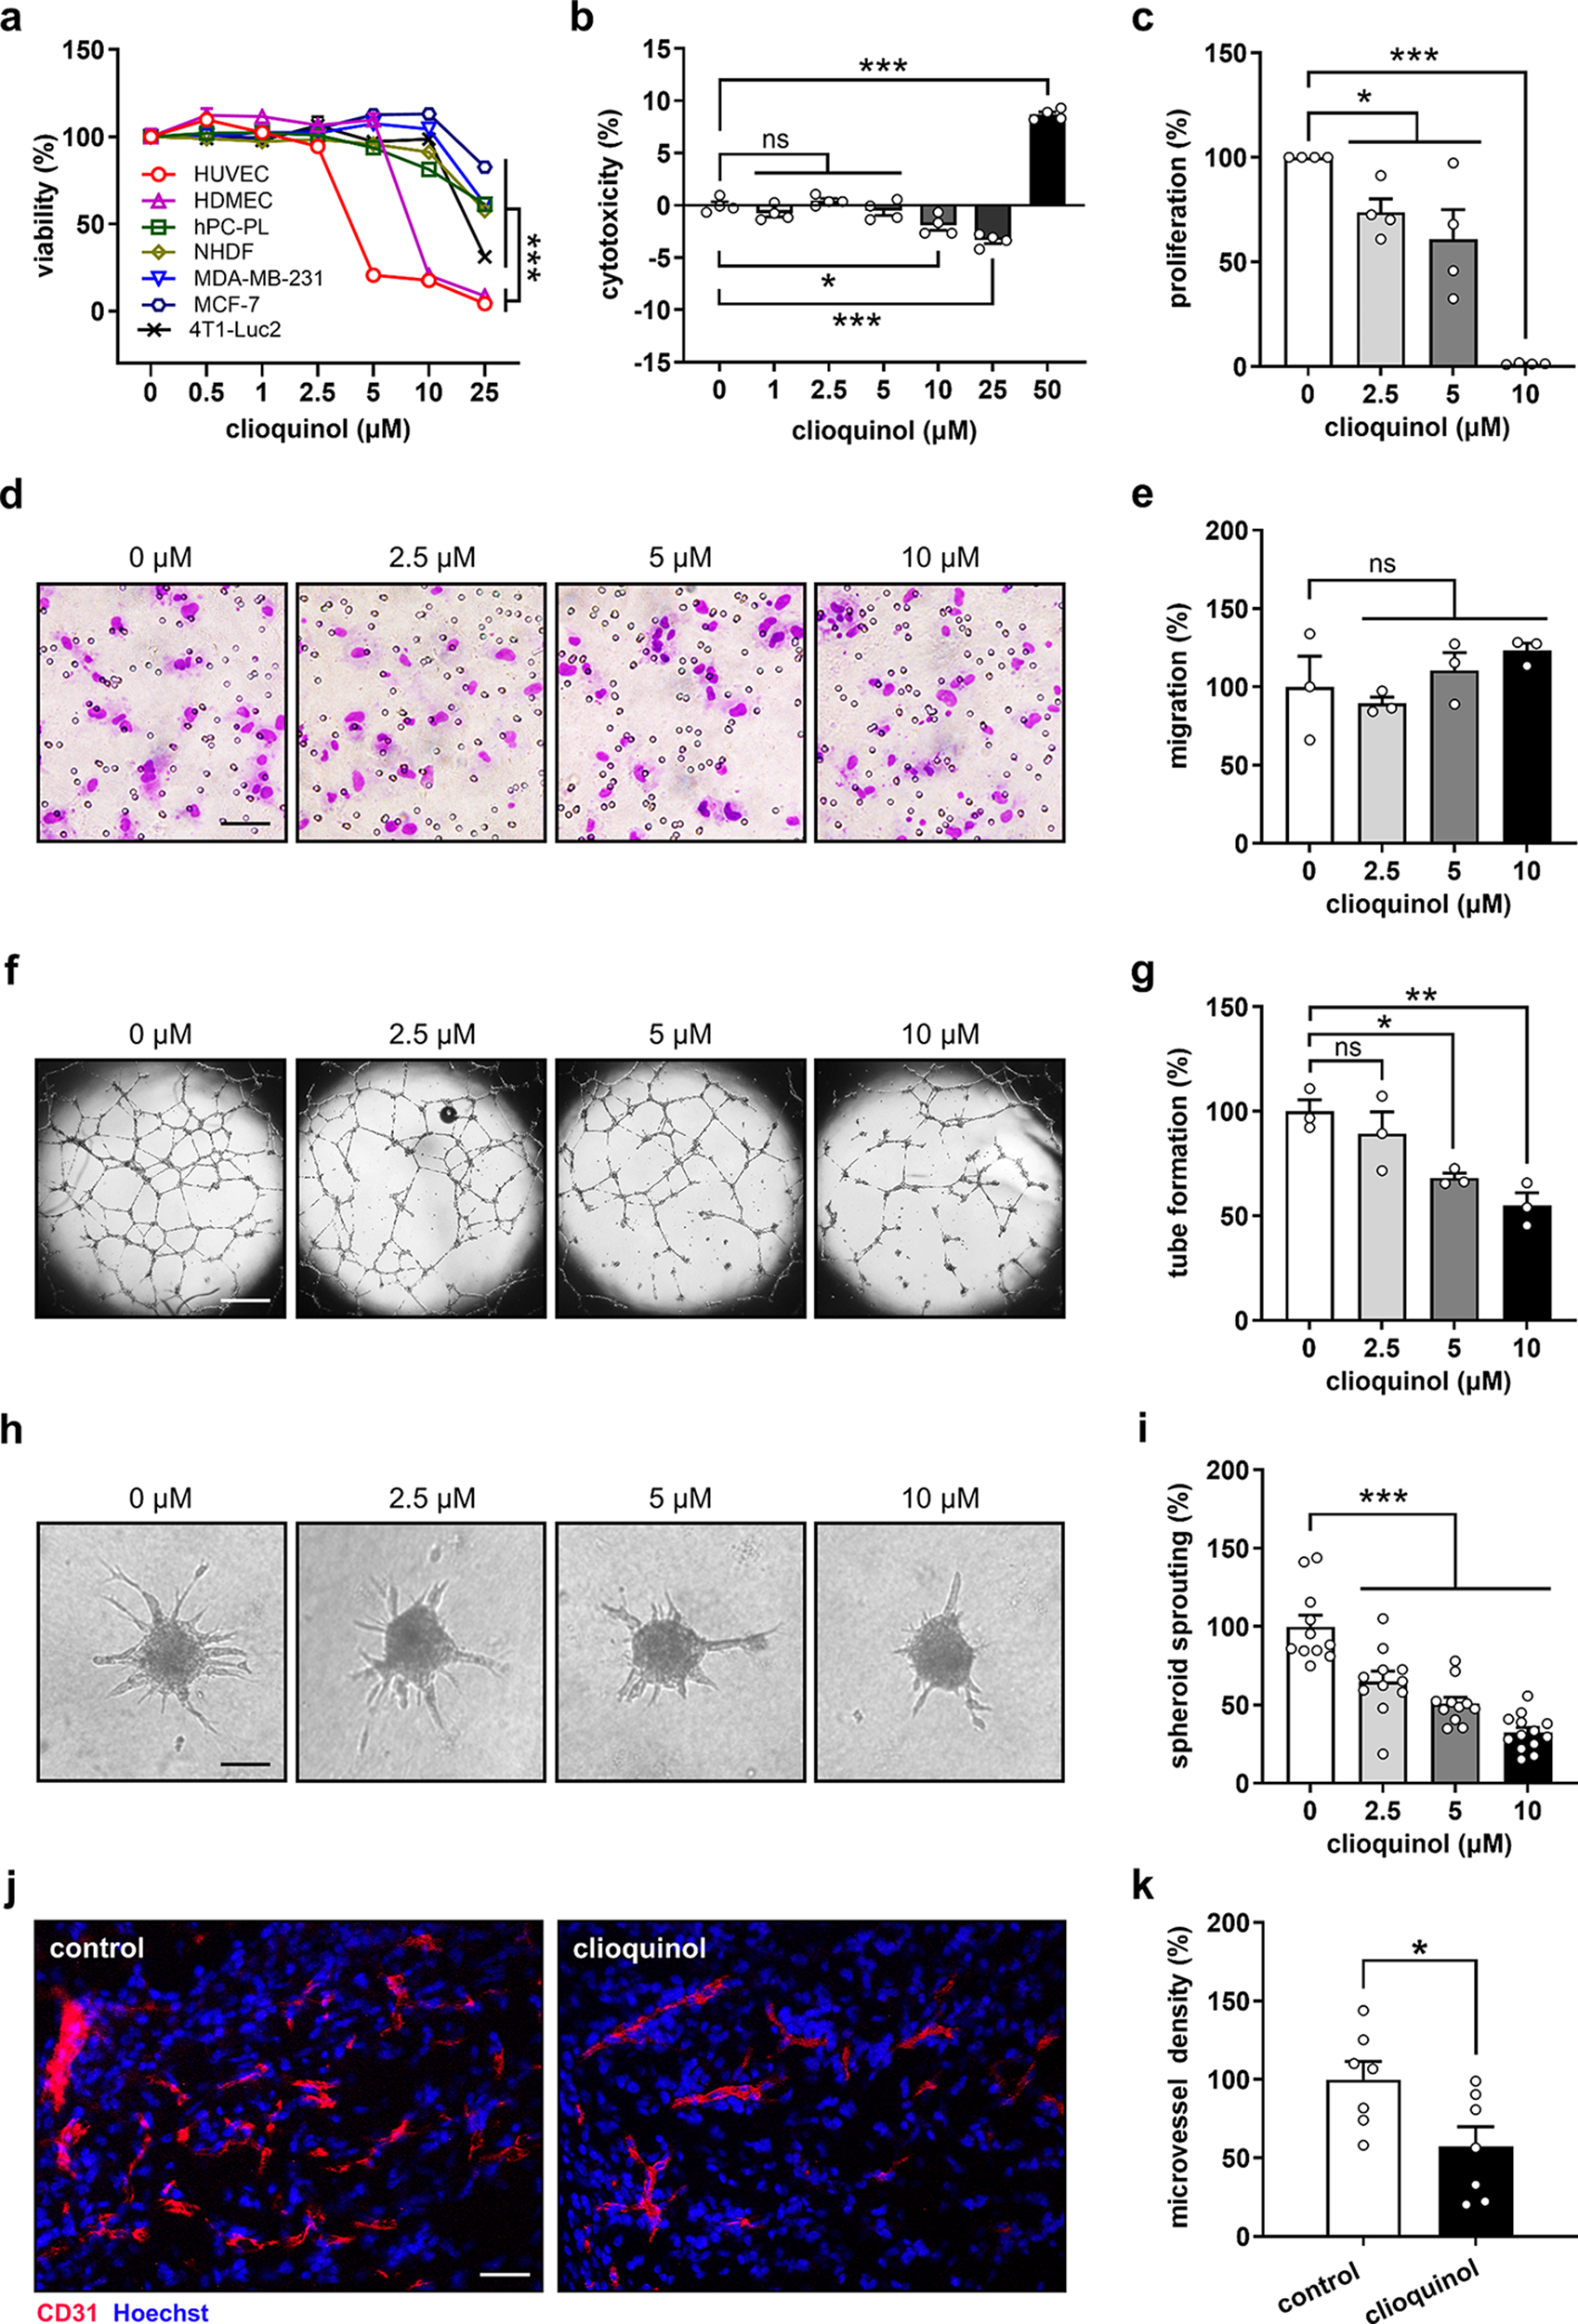
The viability of cells was evaluated by means of WST-1 assays. For this purpose, cells seeded in 96-well plates were exposed to various treatments. After 48 h, 10 µL WST-1 reagent (Roche Diagnostics, Mannheim, Germany) was added to each well and incubated at 37 °C for 30 min. Absorbance was measured at 450 nm with 620 nm as reference using a PHOmo microplate reader (anthos Mikrosysteme GmbH, Krefeld, Germany). Cell viability was expressed as percentage relative to the control group.
Lactate dehydrogenase (LDH) assay
The cytotoxicity of compounds was assessed using LDH assays. For this purpose, HUVECs seeded in 96-well plates were exposed to various concentrations of compounds. After 24 h of treatment, 100 µL LDH reaction mix (Roche Diagnostics) was added to each well and incubated at room temperature for 10 min, followed by addition of 50 µL stop solution (Roche Diagnostics). Absorbance was measured at 492 nm with 620 nm as reference using a microplate photometer (PHOmo). The cytotoxicity of each compound was expressed as percentage relative to the high control group, in which all cells were lysed.
Flow cytometry
The proliferating activity of ECs was evaluated by bromodeoxyuridine (BrdU) incorporation assays following established protocols [27]. HUVECs were exposed to various concentrations of clioquinol. After 6 h of treatment, BrdU was added into each well at a final concentration of 10 µM. After culture for another 18 h, the cells were fixed with 70% ethanol and then incubated with a fluorescein isothiocyanate-labeled anti-BrdU antibody (Cat# 11-5071-42; RRID: AB_11042627; Thermo Fisher Scientific, Karlsruhe, Germany) for 30 min. Cell samples were then analyzed using a FACSLyric flow cytometer (BD Biosciences, Heidelberg, Germany) to quantify BrdU-positive cells. 10,000 events were acquired for each sample and the analysis was performed using FACSuite™ Software (BD Biosciences). EC proliferation was expressed as percentage relative to the control group.
To investigate the effects of clioquinol on the expression of membrane VEGFR2, HUVECs were treated with 0.1% DMSO or 10 µM clioquinol for 0.5, 1, 2, 3, and 4 h. The cells were then harvested using Accutase (PAN-Biotech GmbH, Aidenbach, Germany) and incubated with an anti-VEGFR2 antibody conjugated to PE (Cat# 130-120-480; RRID: AB_2801769; Miltenyi Biotec, Bergisch Gladbach, Germany) for 30 min at room temperature, followed by analysis using a FACSLyric flow cytometer (BD Biosciences). Membrane VEGFR2 expression was expressed as percentage relative to the control group at 0.5 h.
Transwell migration assay
The migratory activity of ECs was assessed via transwell migration assays. For this purpose, HUVECs were exposed to various concentrations of clioquinol for 24 h. Following treatment, 1.5 × 10⁵ treated cells were suspended in 500 µL Endothelial Basal Medium (EBM; PromoCell) and seeded into each polycarbonate membrane insert in a 24-well transwell plate (8 μm pores; Corning; Merck KGaA, Darmstadt, Germany), with 750 µL EBM containing 1% FCS added to each well. After 5 h of incubation, unmigrated cells were removed and migrated cells were stained with Diff-Quick (LT-SYS Diagnostika, Berlin, Germany). EC migration was quantified by counting the number of migrated cells in 20 regions of interest using a BZ-8000 microscope (Keyence, Osaka, Japan) and expressed as percentage relative to the control group.
Tube formation assay
The tube-forming activity of ECs was analyzed by tube formation assays. In a first step, 1.5 × 10⁴ HUVECs were suspended in EGM containing different compounds and seeded into Matrigel-coated wells of a 96-well plate. After 24 h of incubation, newly formed tubes were imaged using a phase-contrast microscope (BZ-8000; Keyence). EC tube formation was quantified by analyzing the number of tube meshes per well using ImageJ software with the angiogenesis analyzer plug-in (U.S. National Institutes of Health, Bethesda, Maryland, USA) and expressed as percentage relative to the control group.
Spheroid sprouting assay
As outlined previously [28], HUVECs were seeded in non-adherent round bottom 96-well plates (500 cells per well) with EGM containing 0.24% (w/v) methylcellulose. After culture for 24 h, formed spheroids were harvested and suspended in EBM containing 10% FCS, 0.25% (w/v) methylcellulose, and 1 mg/mL rat collagen (Serva, Heidelberg, Germany). About 50 spheroids were then transferred to each well of pre-warmed 24-well plates. Following a 45-minute incubation, spheroids were exposed to different treatments for 24 h and imaged using a phase-contrast microscope (DFC450C; Leica Microsystems, Wetzlar, Germany). Spheroid sprouting was quantified by measuring the cumulative length of sprouts using LAS V4.8 software (Leica Microsystems) and expressed as percentage relative to the control group.
Aortic ring assay
The thoracic aorta from a BALB/c mouse (RRID: IMSR_RJ: BALB-CANNRJ; Janvier-Labs, Le Genest, France). was cut into 0.5-mm rings and embedded in Matrigel (Corning; Merck KGaA) in 96-well plates (one ring per well). After a 15-minute incubation, the rings were exposed to different concentrations of clioquinol. Following treatment for 6 days, the aortic rings were imaged using a phase-contrast microscope (BZ-8000; Keyence). Aortic sprouting was quantified by measuring the sprouting area and expressed as percentage relative to the control group.
Western blotting
As previously detailed [29], the treated cells were lysed on ice for 10 min in RIPA lysis buffer (Thermo Fisher Scientific) supplemented with Protease Inhibitor Cocktail (Sigma-Aldrich), and then collected using a cell scraper. Following centrifugation, the supernatant from the cell lysate was collected for protein quantification using the Pierce BCA Protein Assay Kit (Thermo Fisher Scientific). Protein samples (10 µg) were then separated via sodium dodecyl sulphate-polyacrylamide gel electrophoresis and then transferred onto polyvinylidene difluoride membranes (Bio-Rad Laboratories, Munich, Germany). Proteins of interest were detected using specific antibodies, including rabbit monoclonal anti-phosphorylated (p)-VEGFR2 antibody (1:250; Cat# 2478; RRID: AB_331377; Cell Signaling Technology, Frankfurt, Germany), rabbit monoclonal anti-VEGFR2 antibody (1:250; Cat# 9698; RRID: AB_11178792; Cell Signaling Technology), rabbit polyclonal anti-VEGFR1 antibody (1:250; Cat# ab32152; RRID: AB_778798; Abcam, Cambridge, UK), rabbit monoclonal anti-FGF receptor 1 (FGFR1) antibody (1:250; Cat# 9740; RRID: AB_11178519; Cell Signaling Technology), rabbit monoclonal anti-Tie2 antibody (1:250; Cat# 7403; RRID: AB_10949315; Cell Signaling Technology), rabbit monoclonal anti-p-FAK antibody (1:250; Cat# 8556; RRID: AB_10891442; Cell Signaling Technology), rabbit polyclonal anti-FAK antibody (1:250; Cat# 3285; RRID: AB_2269034; Cell Signaling Technology), rabbit monoclonal anti-p-AKT antibody (1:500; Cat# 4060; RRID: AB_2315049; Cell Signaling Technology), rabbit monoclonal anti-AKT antibody (1:500; Cat# 4685; RRID: AB_2225340; Cell Signaling Technology), mouse monoclonal anti-p-ERK antibody (1:500; Cat# ab50011; RRID: AB_1603684; Abcam), rabbit polyclonal anti-ERK antibody (1:500; Cat# ab115799; RRID: AB_10902111; Abcam), and mouse monoclonal anti-β-actin antibody (1:3000; Cat# A5441; RRID: AB_476744; Sigma-Aldrich). This was followed by incubation with an anti-rabbit (1:1000; Cat# HAF008; RRID: AB_357235; R&D Systems, Wiesbaden, Germany) or anti-mouse (1:1000; Cat# HAF007; RRID: AB_357234; R&D Systems) horseradish peroxidase-conjugated secondary antibody. Protein signals were visualized using an enhanced chemiluminescence kit (GE Healthcare, Freiburg, Germany) and imaged with a ChemoCam Imager (Intas, Göttingen, Germany). The protein expression level was quantified using ImageJ software, normalized to β-actin or its unphosphorylated form and expressed as percentage relative to the control group.
Quantitative real-time polymerase chain reaction (PCR)
Total RNA was extracted from treated HUVECs using the RNeasy Mini kit (Qiagen, Hilden, Germany) according to the manufacturer’s protocol. Subsequently, 1 µg RNA was reverse transcribed using the QuantiNova Reverse Transcription Kit (Qiagen). Quantitative real-time PCR was conducted on a MiniOpticon Real-Time PCR System (Bio-Rad Laboratories) using the QuantiNova SYBR green PCR kit (Qiagen). The messenger RNA (mRNA) level of VEGFR2 was determined using the 2−ΔΔCt method with GAPDH as endogenous control and expressed as percentage relative to the control group. The primer sequences were as follows: 5′-GGCCCAATAATCAGAGTGGCA-3′ (forward) and 5′-CCAGTGTCATTTCCGATCACTTT-3′ (reverse) for human VEGFR2; 5′-ATGGGTGTGAACCATGAGAAGTA-3′ (forward) and 5′-GGCAGTGATGGCATGGAC-3′ (reverse) for human GAPDH.
Molecular docking
To generate the three-dimensional (3D) binding modes of compounds within the VEGFR2 kinase domain, we employed the PyMOL Molecular Graphics System (Version 1.5.0.4, Schrödinger, LLC, New York, NY, USA), Coot, and Materials Studio 6.0 software (Accelrys Inc, USA). These tools facilitated the exploration of intermolecular interactions, including hydrogen bonding, van der Waals forces, electrostatic interactions, and hydrophobic interactions, in solving the Newtonian equations of motion for atoms in protein and compound molecules iteratively. Consequently, the molecular conformation underwent changes throughout the simulation. In line with thermodynamic principles, the system strived to attain its lowest free energy state, representing the utmost stability. Subsequently, the simulation was utilized to analyze the crystal structures of VEGFR2, obtained from the Protein Data Bank (RCSB PDB; http://www.rcsb.org) under accession codes 3WZD (VEGFR2-lenvatinib complex) and 4ASE (VEGFR2-tivozanib complex).
Measurement of intracellular ATP
Intracellular levels of ATP were measured using the Firefly Luciferase ATP Assay Kit (Cell Signaling Technology) following the manufacturer’s protocol with minor modifications. Briefly, HUVECs seeded in a 96-well plate were treated with or without 1 mM ATP. After 2 h, the cells were rinsed with PBS for 3 times and lysed in 100 µL Cell Lysis Buffer. Then, 100 µL Firefly Luciferase Reaction Mixture was added to each well. After shaking the plate for 2 min, chemiluminescence was measured in each well using a Tecan Infinite M200 PRO luminometer (Crailsheim, Germany). The intracellular ATP level was expressed as percentage relative to the control group.
Cell-free VEGFR2 kinase assay
The interaction between clioquinol and VEGFR2 was evaluated in vitro using the ADP-Glo™ Kinase Assay (Promega, Walldorf, Germany) and the VEGFR2 Kinase Enzyme System (Promega). All assays were performed in white 96-well flat-bottom plates. Each reaction mixture (25 µL) contained 10 ng recombinant VEGFR2 (amino acids 789 to end), 0.2 µg/µL Poly (4:1 Glu, Tyr) Peptide Substrate, serial dilutions of clioquinol, and ATP at a final concentration of 10 µM. For ATP competition experiments, the reaction mixture (25 µL) contained 0.2 µg/µL Peptide Substrate, different concentrations of lenvatinib or clioquinol, 10 or 500 µM ATP, 10 or 40 ng recombinant VEGFR2, respectively. Reactions were incubated at room temperature for 60 min. Then, 25 µL ADP-Glo™ Reagent was added to each well to terminate the kinase reaction and deplete remaining ATP, followed by a 40-minute incubation at room temperature. Subsequently, 50 µL Kinase Detection Reagent was added to each well to convert ADP to ATP. After another 40-minute incubation at room temperature, the generated ATP correlating with the kinase activity was measured using a luciferase/luciferin reaction with a Tecan Infinite M200 PRO luminometer. VEGFR2 kinase activity was expressed as percentage relative to the control group. The IC50 value of clioquinol at 10 µM ATP was calculated using GraphPad Prism 9 software.
Mouse experiments
The Matrigel plug assay was performed following the protocol outlined in a previous study [30]. A mixture of Matrigel with murine VEGF (1 µg/mL; R&D Systems), murine FGF2 (1 µg/mL; R&D Systems), heparin (60 IU/mL; B. Braun, Melsungen, Germany), and either 0.1% DMSO or 10 µM clioquinol was injected subcutaneously into the flanks of 8-week-old BALB/c mice (7 mice per group; Janvier-Labs). The mice were anesthetized with isoflurane (5% induction and 2% maintenance) during the injection. Following a 7-day period, the Matrigel plugs were collected for subsequent immunohistochemical analyses.
The dorsal skinfold chamber model was conducted as described previously in detail [30, 31]. Tumor spheroids were generated by culturing 4T1-Luc2 cells in agarose-coated 96-well plates for 3 days. One day after cell seeding, the dorsal skinfold chambers were surgically implanted into female 3-4-month-old BALB/c mice (Janvier-Labs). The mice were anesthetized with an intraperitoneal injection of 90 mg/kg body weight ketamine (Serumwerke Bernburg AG, Bernburg, Germany) and 12 mg/kg body weight xylazine (Bayer, Leverkusen, Germany) before the operation, and were given a subcutaneous injection of 10 mg/kg body weight carprofen (Cp-Pharma, Burgdorf, Germany) for analgesia after the operation. Two days later, one tumor spheroid was transplanted into each chamber. The mice were then randomly allocated into 4 groups (10 mice per group) and treated with intraperitoneal injections of 30 mg/kg body weight clioquinol (dissolved in a 1:4 ratio of DMSO to corn oil) once daily, 80 mg/kg body weight MK-2206 (dissolved in 30% SBE-β-CD in NaCl; MedChemExpress) every two days, a combination of clioquinol and MK-2206 with doses mentioned above, or vehicle (control). The vehicle group received daily intraperitoneal injections of a 1:4 ratio of DMSO to corn oil (40 µL) and an intraperitoneal injection of 30% SBE-β-CD (40 µL) every two days. Tumor growth and vascularization were monitored on days 0, 3, 6, 10, and 14 after spheroid transplantation by means of stereomicroscopy and intravital fluorescence microscopy with recordings analyzed offline using CapImage (Zeintl, Heidelberg, Germany). The analyses included the quantification of tumor size, functional microvessel density, microvessel diameter, centerline red blood cell (RBC) velocity, and volumetric blood flow [32, 33]. Additionally, tumor growth in mice randomly selected from the control and combination group (5 mice per group) was analyzed by bioluminescence imaging (IVIS Spectrum imager; PerkinElmer, MA, USA) on days 10 and 14 after spheroid transplantation. This was achieved by administering an intraperitoneal injection of 150 mg/kg body weight D-luciferin (PerkinElmer) with imaging conducted 17 min post-injection. At the end of the experiment, the tumor tissues were excised for further histological and immunohistochemical analyses.
All mice were housed under a 12-hour light/dark cycle with a controlled room temperature (22–24 °C) and humidity (40–60%), and had free access to food and water. They were acclimated for at least 7 days before the experiments. The humane endpoint was established when body weight loss exceeded 20%.
Histology and immunohistochemistry
Formalin-fixed paraffin-embedded Matrigel plugs and tumor tissues were serially sliced into 3-µm sections. For the analysis of tumor size, sections with the largest area for each tumor were selected, stained with hematoxylin and eosin (H&E), imaged using a BZ-8000 microscope (Keyence), and subjected to planimetric tumor area measurements by means of an image analysis software (Keyence).
Microvessels in Matrigel plugs and tumors were detected by sequential staining with a rabbit anti-mouse CD31 antibody (1:150; Cat# ab182981; RRID: AB_2920881; Abcam), a goat anti-rabbit Alexa Fluor 555-labeled secondary antibody (1:150; Cat# A27039; RRID: AB_2536100; Thermo Fisher Scientific), and Hoechst 33342 (2 µg/mL; Sigma-Aldrich), followed by the observation under a fluorescence microscope (Olympus BX60). The microvessel density was determined by counting the number of all CD31-positive microvessels divided by the corresponding tissue area.
Tumor cell proliferation and apoptosis were assessed by sequential staining with a monoclonal rabbit anti-mouse Ki67 antibody (1:500; Cat# 12202; RRID: AB_2620142; Cell Signaling Technology) or a polyclonal rabbit anti-mouse cleaved caspase-3 antibody (1:150; Cat# 9661; RRID: AB_2341188; Cell Signaling Technology), biotinylated goat anti-rabbit secondary antibody (1:150; Cat# ab64256; RRID: AB_2661852; Abcam), streptavidin‐peroxidase conjugate (Abcam), and 3‐amino‐9‐ethylcarbazole substrate (Abcam), followed by counterstaining with Mayer’s hemalum solution (Merck KGaA). Percentages of Ki67-positive and cleaved caspase‐3-positive tumor cells were determined using a BX60 microscope (Olympus).
Microvascular VEGFR2 expression was analyzed by sequential staining with a monoclonal rat anti-mouse CD31 antibody (1:100; ab56299; Abcam), a monoclonal rabbit anti-mouse VEGFR2 antibody (1:100; Cat# 2479; RRID: AB_2212507; Cell Signaling Technology), a goat anti-rat Alexa Fluor488-labeled secondary antibody (1:150; Cat# A11006; RRID: AB_2534074; Thermo Fisher Scientific), a goat anti-rabbit Cy3-conjugated secondary antibody (1:100; Cat# A10520; RRID: AB_10563288; Thermo Fisher Scientific), and Hoechst 33342 (2 µg/mL; Sigma-Aldrich). The analyses involved the quantification of the area of VEGFR2 signal normalized to CD31 area as well as the determination of the mean fluorescence intensity of VEGFR2 using ImageJ software.
Calculation of the coefficient of drug interaction (CDI)
The combined effects of clioquinol and MK-2206 in the dorsal skinfold chamber model were assessed by calculating the value of CDI using the formula: CDI = AB/(A × B), where AB represents the ratio of the combination group to the control group, and A and B denote the ratios of each individual compound group to the control group. A CDI value of less than 1 indicates synergism, a value of 1 indicates additivity, and a value greater than 1 indicates antagonism.
Statistics
The statistical analysis was performed utilizing GraphPad Prism 9 software. Differences between two groups were assessed using the unpaired two-tailed t-test, while differences among multiple groups were evaluated using One-Way ANOVA followed by Tukey’s multiple comparisons test. All data are expressed as means ± SEM. Statistical significance was defined as P < 0.05 (*P < 0.05; **P < 0.01; ***P < 0.001).


Comments (0)