Animals
All mouse experiments were approved by the Institutional Animal Care and Use Committee of Boston Children’s Hospital. Specific pathogen-free C57BL6/J mice (#000664, 8- 10 weeks old) were purchased from Jackson Laboratory. Transgenic mouse models used in this study are the following: Apolipoprotein M transgenic (ApomTG) and Apom-null (Apom−/−) [24], SphK RBCKO (SphK EpoR-Cre) [33], S1pr1f/f (a kind gift from Dr. Richard Proia, NIDDK, NIH) and S1pr1f/stop/f [10], Cdh5-CreERT2 [48] (a kind gift from Dr. Ralf Adams, Max Plank Institute) mice. Mouse strains harboring tamoxifen-inducible, endothelial cell-specific S1pr1 gene regulation were generated by crossing the S1pr1f/f and S1pr1f/stop/f to Cdh5-CreERT2 that yields S1pr1f/f; Cdh5-CreERT2 (S1pr1 loss-of-function, S1pr1 ECKO) and S1pr1f/stop/f; Cdh5-CreERT2 (S1pr1 gain-of-function, S1pr1 ECTG), respectively [10, 11]. 1.5 mg (mg) of tamoxifen (Sigma-Aldrich, #5648) dissolved in corn oil (Sigma-Aldrich, #C8267) was injected i.p. for 5 consecutive days to induce or delete S1pr1 gene in mice in both Cre+ and Cre− littermates at 8—10 weeks old. Both males and females were used.
Antibody and recombinant ApoM-Fc biologic treatment
Murine anti-VEGF antibody (B20.4.1.1.) [49] was kindly provided by Genentech. ApoM-Fc or ApoM-TM were expressed in CHO cells and purified by affinity and gel filtration chromatography as described previously [29]. Antibodies including isotype control (rat IgG2a, α-trinitrophenol, BioXCell, #BE0089) and ApoM-Fc biologics were diluted in sterile saline and injected i.p. or subcutaneously as described in the experimental schemes. For combination treatment of ApoM-Fc and anti-VEGF, ApoM-Fc was administered at concentration of 4 mg/Kg body weight at D4, 7, and 9 and anti-VEGF at 0.5 mg/Kg on the day of laser photocoagulation (day 0) and D5. Male mice were used for acute vascular permeability assay and laser-induced CNV concerning anti-VEGF, ApoM-Fc or ApoM-TM treatment.
Laser induced choroidal neovascularization
CNV was induced in mice via laser photocoagulation as described previously [50]. Briefly, mice were anesthetized with a mixture of ketamine (120 mg/kg) and xylazine (10 mg/kg). Pupils were dilated with a topical application of Tropicamide (Somerset Therapeutics, #NDC 70069–121-01). A green argon laser (incident power of 300 mW and pulse duration of 70 ms), coupled with the Micron IV imaging-guided system (Phoenix Research Laboratories), was used to apply laser burns to four distinct areas of the fundus in each eye. Sterile eye lubricant (Optixcare, Aventix) was applied to both eyes and mice were placed on a prewarmed plate until recovery. CNV lesion was quantified 10 to 14 days post-photocoagulation.
Immunostaining of RPE/ choroid flat mount
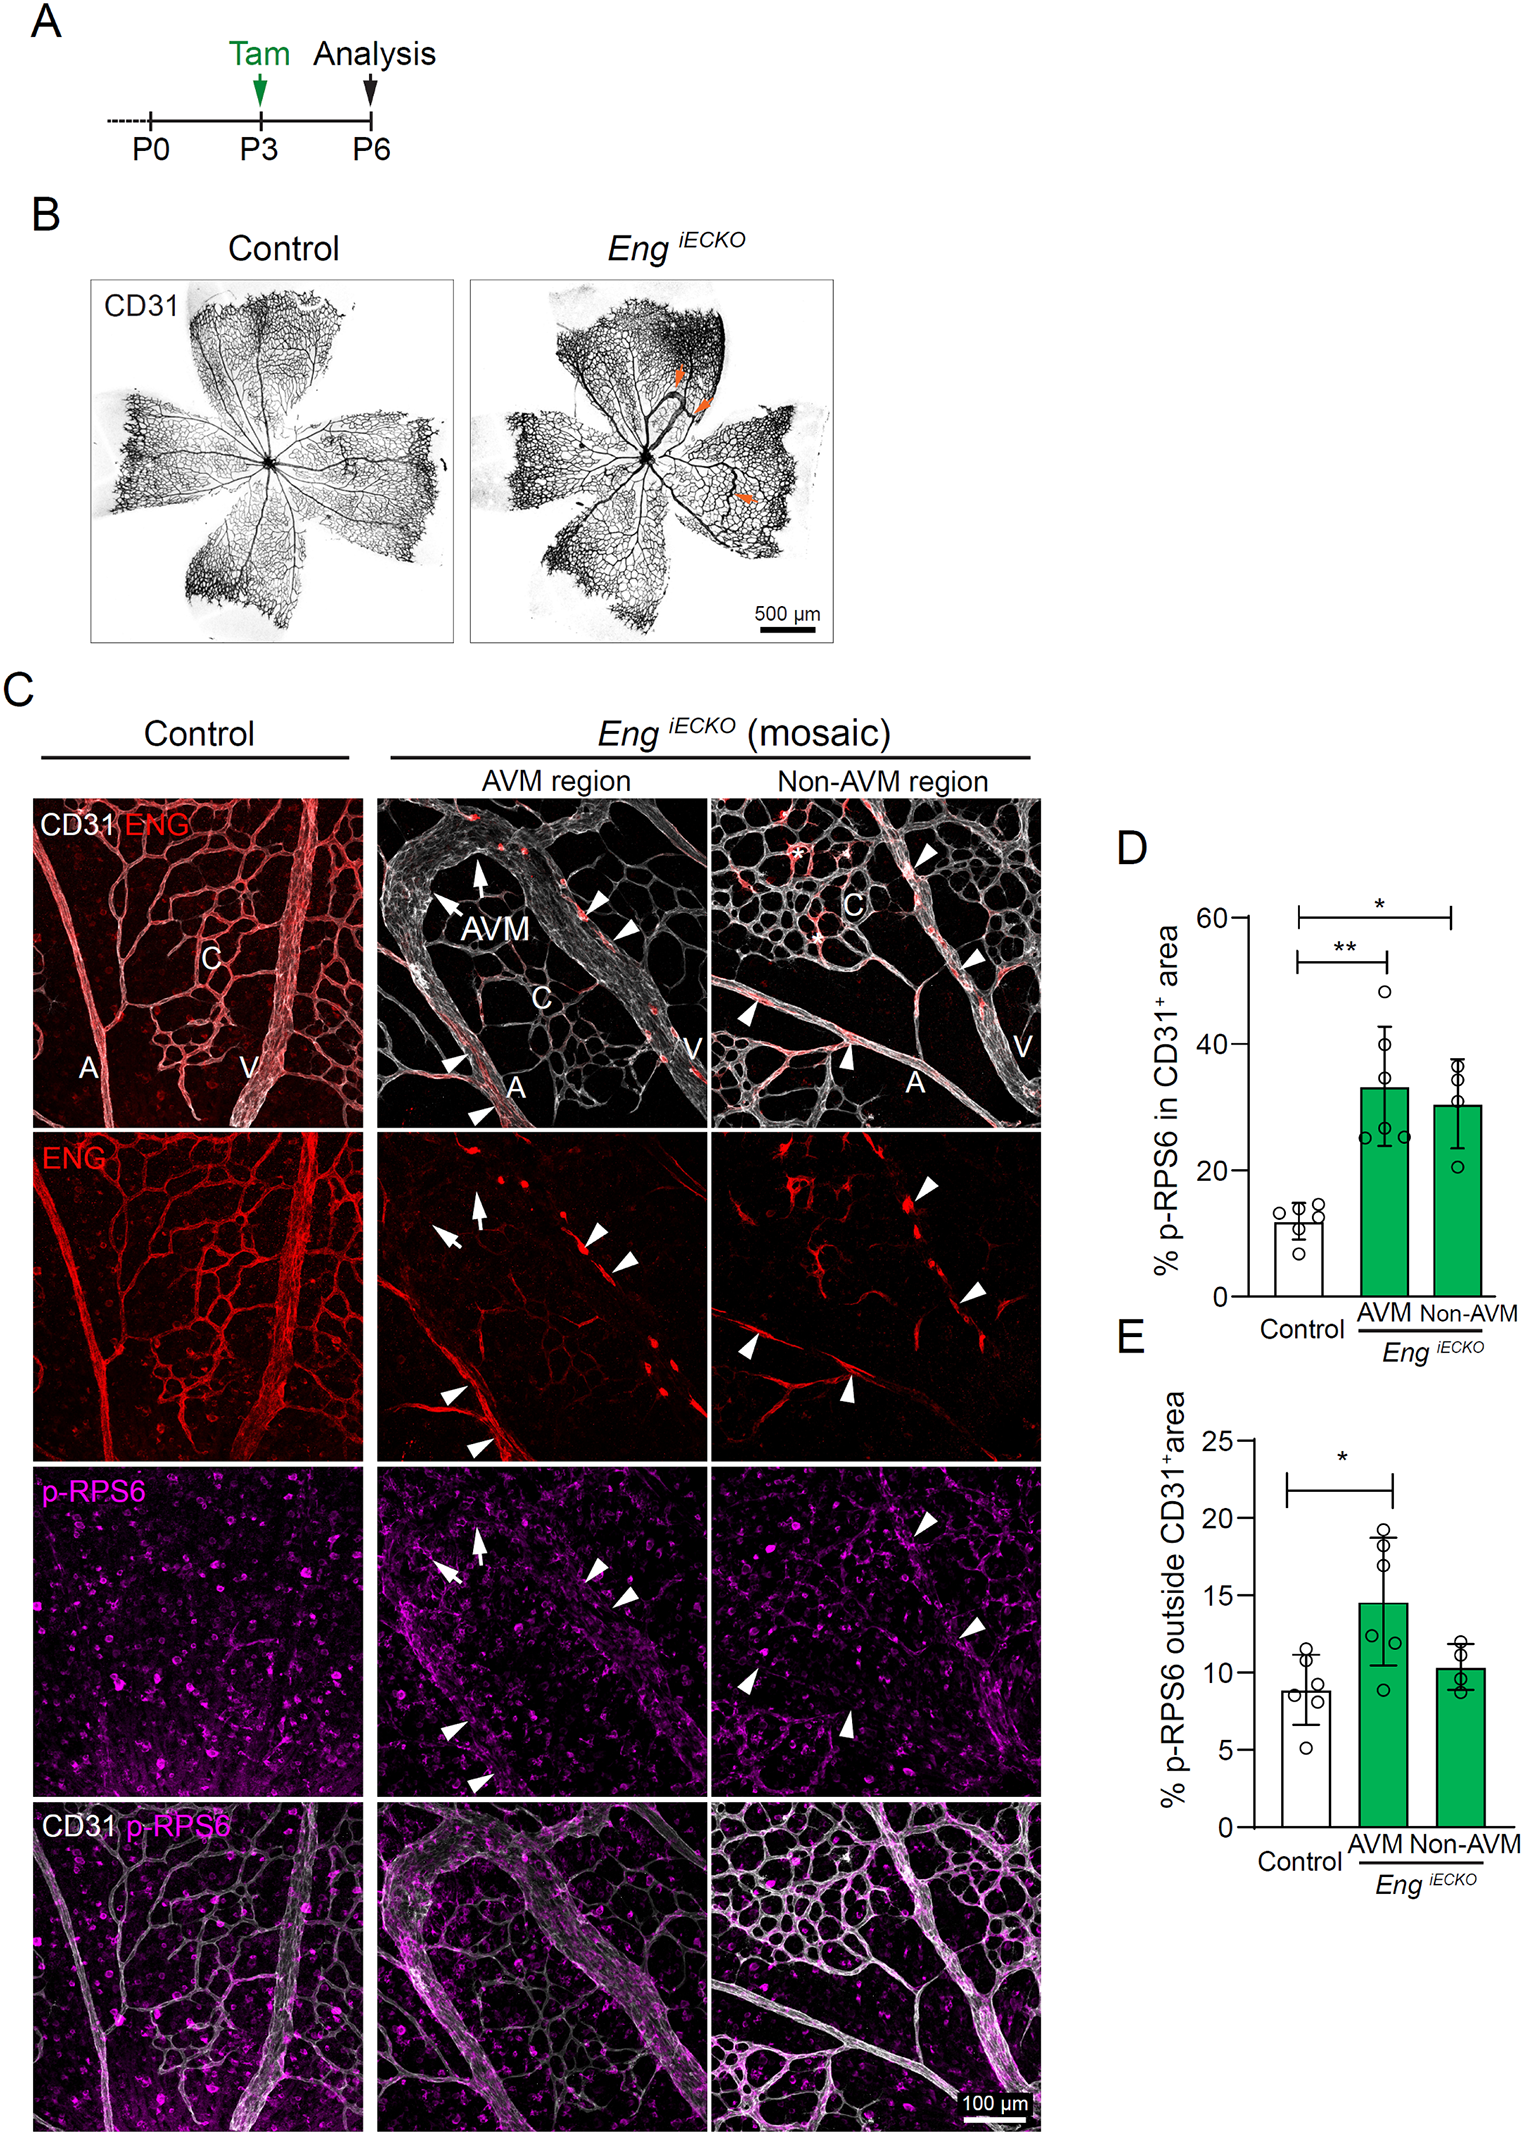
Mice were euthanized at the time indicated. Eyes were enucleated and post-fixed in 4% paraformaldehyde (PFA) in PBS for 2 h at room temperature (RT). The posterior eye cups containing the RPE, choroid, sclera were dissected under stereomicroscope and permeabilized with 0.8% Triton X-100 in PBS for 1 h at RT. The CNV lesions were stained with Alexa-fluorophore conjugated GS lectin IB4 (Invitrogen, 2.5 μg/ml), Alexa Flour488-conjugated, anti-ERG (Abcam, #ab196374), Cy3-conjugated, anti-smooth muscle actin α (αSMA, Millipore Sigma, #C6198), Hoechst (Invitrogen, #H21486) in PBlec buffer (0.1 mM CaCl2, 0.1 mM MgCl2, 0.1 mM MnCl2, 1% Triton X-100 in PBS (pH 6.8)) [10] overnight at 4 °C. After thorough washing in PBlec buffer, flatmounts were prepared with scleral side down in permount mounting medium (FisherSci, #SP15-100) and coverslipped before imaging.
Fundus fluorescein angiography (FFA)
Vascular leak was evaluated by quantifying hyperfluorescent lesions 10 days after laser-burn. After anesthetizing the mice, both eyes were dilated, and mice received an intraperitoneal injection of 1% AK-FLUOR® (NDC 17478-101-12, Akorn, Lake Forest, IL, USA) diluted in 0.9% sodium chloride. Vascular leak was captured using the Micron IV retinal imaging system (Phoenix Research Laboratories), and fluorescent fundus photographs were captured 5 min after fluorescein injection and used for vascular permeability quantification.
Acute vascular permeability
VEGF-A-induced retinal vascular permeability was performed as described [51]. Briefly, 7–9 weeks old male C57Bl6/J were treated with ApoM-Fc, ApoM-TM (S1P non-binding mutant) [29] or an equal volume of saline at 4 mg/kg via i.p. injection. 24 h later, mice were anesthetized with isoflurane (1–4% isoflurane/ 100% oxygen) through a mouse gas anesthesia head holder. Pupils were dilated with a solution of 1% tropicamide phenylephrine hydrochloride and applied with 0.5% proparacaine hydrochloride ophthalmic solution on each eye. Intraocular injections were performed by inserting a NANOFIL Syringe (10uL, World Precision Instruments) into the vitreous humor. The needle was aimed to penetrate the eyeball near its equator under a dissection microscope to introduce a total of 100 ng recombinant VEGF (R&D systems, #293-VE) in a volume of 0.5 μl (or saline) to avoid increases in intraocular pressure. After the injection, eyes were treated with 0.5% antibiotic ophthalmic ointment. After 1 h, mice were treated with FITC-Albumin (Sigma Aldrich, #A9771, 10 mg/kg) intravenously via a retro-orbital route to assess vascular leak. After 4 h, mice were euthanized, eyes were enucleated and fixed using 4% PFA in PBS. Retinas were dissected out and stained for Alexa647-conjugated GS-isolectin (IB4, Invitrogen, #I32450), flat-mounted and imaged following the published protocol [10].
Plasma collection, S1P extraction and S1P measurement
Blood samples were collected from either submandibular vein (for non-terminal) via cheek punch or vena cava (for terminal) in 1–5 μl of 0.5 M EDTA- containing tubes. Samples were centrifuged at 2000 g for 15 min at 4 °C. Plasma (supernatants) was collected and stored at -80 °C until S1P measurement. Plasma S1P was extracted and measured by UHPLC-MS/MS as previously described [52]. Briefly, 100 μL of plasma were diluted in TBS Buffer (50 mM Tris–HCl pH 7.5, 0.15 M NaCl) followed by 100 μL of precipitation solution (20 nM D7-S1P in methanol) to extract S1P. After centrifugation at 18,000 rpm for 5 min, supernatants were transferred to vials for UHPLC-MS/MS analysis (see below). C18-S1P (Avanti Lipids) was dissolved in methanol to obtain a 1 mM stock solution. Standard samples were prepared in 4% fatty acid free BSA (Sigma Aldrich, #A6003) in TBS at final concentration of 1 mM. Before analysis, the 1 mM S1P solution was diluted with 4% BSA in TBS to obtain 0.5 mM, 0.25 mM, 0.125 mM, 0.0625 mM, 0.03125 mM, 0.0156 mM, and 0.0078 mM. S1P in diluted samples (100 mL) were extracted with 100 mL of methanol containing 20 nM of D7-S1P. Precipitated samples were centrifuged and the supernatants were transferred to vials for mass spectrometric analysis. The internal deuterium-labeled D7-S1P standard (Avanti Lipids, 200 nM stock) was prepared in methanol.
The samples were analyzed with the Orbitrap Exploris 480 mass spectrometer fronted with a FLEX ion source coupled to Vanquish Horizon UHPLC system (Thermo Fisher Scientific) using a reverse phase column (XSelect CSH C18 XP column 2.5 µm, 2.1 mm X 50 mm, Waters) maintained at 55 °C in positive ion mode. The gradient solvents were as follows: Solvent A (water/methanol/formic acid 97/2/1 (v/v/v)) and Solvent B (methanol/acetone/water/formic acid 68/29/2/1 (v/v/v/v)). The analytical gradient was run at 0.4 mL/min from 50 to 100% Solvent B for 5.4 min, 100% for 2.6 min, followed by one minute of 50% Solvent B. A targeted MS2 strategy (also known as parallel reaction monitoring, PRM) was performed to isolate S1P (380.26 m/z) and D7-S1P (387.30 m/z) using a 1.6 m/z window, and the HCD-activated (stepped CE 20, 30, 40%) MS2 ions were scanned in the Orbitrap at 60 K. The area under the curve (AUC) of MS2 ions (S1P, 264.2686 m/z; D7-S1P, 271.3125 m/z) was calculated using Skyline46. Quantitative linearity was determined by plotting the AUC of the standard samples (C18-S1P) normalized by the AUC of internal standard (D7-S1P); (y) versus the spiked concentration of S1P (x). Correlation coefficient (R2) was calculated as the value of the joint variation between x and y. A linear regression equation was used to determine analyte concentrations.
Immunoblot analysis
The content of exogenous and endogenous ApoM proteins in mouse plasma was detected using anti-ApoM-specific immunoblot analysis [29]. Briefly, 1 μl of mouse plasma was heated to 95 °C for 5 min in 2 × Laemmli’s sample buffer containing 10% β-mercaptoethanol. Samples were loaded on a 10% SDS-PAGE gel (Bio-Rad, #1610156) and transferred to PVDF membrane (Bio-Rad, #1620177). Equal loading was confirmed by Ponceau S staining. Blots were incubated in blocking buffer (Intercept blocking buffer, LI-COR, #927-60001) for 1 h at RT, followed by incubation with rabbit monoclonal anti-ApoM antibody (Abcam, EPR2904, #ab91656) overnight at 4 °C. Signals were detected by probing with goat anti-Rabbit IgG-conjugated horseradish peroxidase (HRP) (R&D Systems, #HAF017) for 30 min at RT and Immobilon Western Chemiluminescent HRP Substrate (Millipore Sigma, #WBKLS0500), and visualized with Azure 600 Imaging System (Azure Biosystems).
Confocal microscopy and image processing
All images were taken under the same setting on LSM800 confocal microscope (Zeiss) equipped with Zen2.1 (Zeiss) software. EC plan-Neofluar 10x/0.3 or a Plan-Apochromat 20x/0.8 objectives were used to obtain z-stacked, tile scan images. CZI files were imported into RGB Tiff files and were quantified using Image J software.
Quantification of CNV, fluorescence intensity
CNV lesion size was quantified by IB4 staining positive area. RGB Tiff files were imported into ImageJ to generate binary images. The maximal border of each CNV legion was manually selected using the freehand selection tool under digital magnification and determine the area recorded in pixels. Exclusion criteria were applied as described previously [36]. Pixeled areas were converted to μm2 using the scale bar.
For fluorescence intensity quantification, binary images were generated using image thresholding function in ImageJ software. The fluorescent area of each CNV lesion as well as the optic nerve head was measured in pixels. Corrected fluorescent intensity was calculated by pixel intensities of individual CNV lesions normalized by the intensity of the optic nerve head area [53].
Acute retinal vascular permeability was accessed by acquiring 4–5 fields of view (FOV) per retinal flat mount and all FOV was averaged for each flat mount. Vascular leak was defined as percentage of pixel intensity per total area, assuming that fluorescence within the blood vessels would be cleared out during 4 h of circulation [51]. Vascular leak was shown as fold change compared to saline-treated controls.
Human study participants and cohort analysis
The UK Biobank is a cohort study of approximately 500,000 individuals who were 40–69 years old at baseline. Enrollment occurred from 2006 to 2010. The diagnostic data for disorders of the choroid and retina were linked to UK electronic health records and classified according to the International Classification of Diseases (ICD)-10 codes. Prevalent and incident disease were defined as events that occurred before and after the subject’s baseline visit, the same time that blood samples were collected [32]. The UK Biobank Pharma Proteomic Project conducted a blood-based proteomic profiling of a randomly selected subset of UK Biobank participants. The average age of the 53,026 participants was 56.8 years and median follow up was 14.8 years. The Olink Explore™ Proximity Extension Assay in combination with next-generation sequencing was used to quantify 2,923 unique proteins in plasma. ApoM was one of the plasma proteins that was quantified. A detailed analysis of plasma proteins linked to prevalent and incident diseases was carried out [32]. An open-access comprehensive proteome-phenome resource (https://proteome-phenome-atlas.com/) was provided that enabled the interrogation of associations between plasma levels of ApoM and prevalent and incident disorders of the choroid and retina. Associations between levels of plasma proteins and disease endpoints were determined using logistic regression and Cox proportional hazards regression for prevalent and incident disease, respectively. Regressions were performed with the adjustment of participants’ information at baseline including sex, age, townsend deprivation index, ethnicity, body mass index, fasting time, smoking status, season of blood collection and blood age.
Statistics
Data are shown as mean ± SD. Statistical analysis was performed using Prism 9 (GraphPad, San Diego, CA). Significant differences were determined by Student’s t test when comparing 2 groups of samples or one-way ANOVA with multiple comparison procedures using Bonferroni test for more than 2 groups comparison.


Comments (0)