
Remember me


This ecological study involved an analysis of a total of 80 countries. The inclusion criteria for countries were based on the availability of complete datasets for all variables employed in this study. The focus of this study was to evaluate the COVID Resilience Scores (CRS), a dependent variable, in relation to countries’ SPAR scores related to infectious disease control, serving as the independent variable. Additionally, referring to the Systemic Rapid Assessment (SYSRA) Toolkit [18], we accounted for two confounding variables in this study: Civil Liberties (CL) and Government Effectiveness (GE).
The analysis focused on the second year of the COVID-19 pandemic (2021), a critical phase in which countries had moved beyond the initial emergency response and were transitioning into long-term pandemic management. By this time, vaccination campaigns were underway, public health measures had evolved, and governments were balancing disease control with economic and social considerations.
By examining resilience factors in 2021, this study provides valuable insights into how countries adapted to ongoing challenges, refined their pandemic responses, and integrated public health measures with societal well-being which remain relevant for strengthening preparedness strategies against future health crises.
In this study, certain numerical data variables were transformed into binary categories. This conversion aimed to simplify the description of countries’ characteristics, facilitate scoring, and improve interpretability. The statistical significance threshold was established at p < 0.05. All analytical procedures were conducted using R version 4.3.1.
Countries’ COVID resilience scores (CRS)Countries’ resilience capacity was assessed using the COVID Resilience Score (CRS), adapted from Bloomberg’s COVID Resilience Rankings [17]. In accordance with Bloomberg’s approach, the CRS has three measurement indicators (Reopening Status, COVID Status, and Quality of Life), each consisting of four measurement components. However, while the CRS retained the three Bloomberg indicators, some components were substituted in order to achieved the study aims (a comparison of indicators is provided in Supplementary Table 1s). In addition, unlike the Bloomberg approach, which analyzes only the fifty-three largest economies [17], CRS analyzes all countries with available data. By using these modified metrics, the CRS represents an attempt to provide a comprehensive assessment of countries’ resilience to the COVID-19 pandemic in 2021.
Under the CRS framework, equal weight proportions are assigned to all three indicators for calculating the CRS scores of these countries. A binary scale (0 or 1) was used to assess the twelve measurement components, and the average score was used as the cutoff point (the scoring system for CRS is provided in Supplementary Table 2s). Consequently, as the CRS encompasses twelve components, the CRS score for each country ranges from 0 (indicating the lowest score) to 12 (indicating the highest score).
Reopening statusThe first indicator in the CRS is the Reopening Status, which aims to evaluate the degree to which countries are advancing toward a return to pre-COVID conditions from perspectives including social activities, economics, business, and tourism [17]. The Reopening Status metric consists of four distinct components: “People Covered by Vaccines” [19], “Lockdown Severity” [20], “Community Immobility” [21], and “Travel Reopening” [22].
“People Covered by Vaccines” [18] was defined as the total number of individuals who received at least one vaccine dose divided by the total population of the respective country. Moreover, “Lockdown Severity” [19] is defined as the stringency index, a composite measure based on nine response indicators encompassing factors such as school closures, workplace closures, and travel bans. This index is rescaled to a value ranging from 0 (indicating openness) to 100 (indicating full closure). The data for these components were sourced from the Our World in Data website.
The “Community Immobility” [20] component is defined as the alteration in the duration of time spent at places of residence relative to a baseline day. The data were collected from both Our World in Data and Google LLC. Moreover, “Travel Reopening” [21] is defined as travel restrictions implemented by governments and includes factors such as country travel restrictions, flight restrictions, the requirement of COVID-19 certificates, quarantine measures, and vaccination coverage. The data of this component were acquired from The Humanitarian Data Exchange (HDX), Office for the Coordination of Humanitarian Affairs (OCHA).
These components were selected to ensure a comprehensive evaluation of reopening progress, encompassing both international and domestic levels. Each individual component within the Reopening Status indicator was assigned a binary score of either 0 or 1 (Table 1s in Supplementary Table 2s). For the “People Covered by Vaccines” and “Travel Reopening” components, a score of 1 is assigned if the value exceeds the cutoff point, while a score of 0 is assigned for values below it. Conversely, for the “Lockdown Severity” and “Community Immobility” components, a score of 1 is given if the value falls below the cutoff point, and a score of 0 is assigned if the value is above it. Consequently, the cumulative score for the indicator of Reopening Status ranges from 0 (indicating a restricted status) to 4 (indicating a lenient status).
COVID statusThe COVID Status indicator aims to determine the severity status of the COVID-19 pandemic in these countries. Four distinct components were utilized to measure this indicator: Reproduction Rate (RR), Case Fatality Rate (CFR), Test per case (TPC), and Positive test Rate (PTR). All of the data for these components were generated from Our World in Data Website [23]. These components were used in the CRS to better illustrate the COVID-19 status of the countries over a one-year timeframe.
The RR was defined as the average number of new infections caused by a single infected individual. The CFR represents the ratio of confirmed deaths to confirmed cases. TPC is the number of tests divided by the number of confirmed cases, while PTR is the number of confirmed cases divided by the number of tests, expressed as a percentage.
Among these 4 components, only the TPC is assigned a score of 1 if its value exceeds the cutoff point and a score of 0 if it is below the cutoff point. Moreover, for the other 3 components, RR, CFR, and PR, a score of 1 is given if their values fall below the cutoff point, and a score of 0 is assigned if their values are above the cutoff point. The total score of the COVID Status indicator for each country ranges from 0 (indicating a severe situation) to 4 (indicating a mild situation).
Quality of lifeThe last indicator of CRS is the Quality of Life. In order to assess the Quality of Life, several dimensions and individual perceptions were considered, reflecting the multidimensional nature of the concept, as defined by the WHO. The WHO defines quality of life as an individual’s perception of his or her position in life, considering his or her goals, expectations, standards, and concerns, within the cultural and values systems of his or her environment [24]. Thus, this study incorporates the following components within the Quality of Life indicator in the CRS framework: the Happiness Index [25], the Peace Index [26], annual GDP growth in 2021 [27], and Human Development Index (HDI) [28].
The Happiness Index provides insights into various aspects of well-being. It is a renowned survey that assesses the global happiness levels of countries based on citizens’ self-perceived well-being. This index not only ranks countries worldwide by subjective well-being but also delves into how social, urban, and natural environments collectively influence happiness, providing valuable insights into various dimensions of well-being. The data were sourced from the World Happiness Report 2021 [25].
Annual GDP growth offers an indication of economic performance and development. It is defined as the annual percentage growth rate of GDP at market prices based on constant local currency. These data serve as indicators of a country’s economic performance and development. For this study, we utilized GDP growth data from 2020 to 2021, which were obtained from The World Bank [27].
The Peace Index component’s data were generated from the Global Peace Index 2021 and obtained from the Vision of Humanity website [26]. Providing insights into societal peace and stability, the Peace Index is defined as a composite measure that assesses the peacefulness of countries; it comprises 23 quantitative and qualitative indicators, each weighted on a scale of 1 to 5, where a lower score indicates a higher level of peace.
The final component of the Quality of Life Indicator is the HDI. The HDI reflects the level of human development in each country by measuring three crucial dimensions of human development: a long and healthy life, access to education, and a decent standard of living [29]. Within this indicator, components with values exceeding the predefined cutoff point receive a score of 1, while those falling below the cutoff point receive a score of 0. Consequently, the Quality of Life indicator is assessed on a scale ranging from 0 (indicating poor quality of life) to 4 (indicating fair quality of life) for each country. The data for the HDI component [28] were sourced from the UNDP website.
Countries’ SPAR scores related to infectious disease controlThis study used 2021 SPAR scores for the countries retrieved from the WHO website in January 2022 [30]. In 2021, 15 SPAR capacities were reported by the countries. However, since the focus of this study revolves around infectious disease control capacities, only 13 SPAR capacities directly related to infectious disease control were considered. Capacities related to “Chemical contamination” and “Radiation events” were excluded from the analysis.
The scores assigned to each SPAR capacity ranged from 20 (indicating the lowest score) to 100 (indicating the highest score). A score of 20 signifies that the particular capacity has not yet been established within a country, while a score of 100 indicates the sustainable implementation of the capacity. These scores were utilized to assess the level of infectious disease control capacity in each country, providing insights into people’s readiness and preparedness in combating infectious diseases.
Confounding variablesReferring to the Systemic Rapid Assessment (SYSRA) [18], this study considered Civil Liberties (CL) [31,32,33]. and Government Effectiveness (GE) [34] as confounding variables. CL data for this study were collected from the Freedom House website in 2021. It represents the transparency of countries in evaluating their national infectious disease capacity [35], with open communication and information contributing to public supervision and preventing manipulation of assessment outcomes. CL score is rated on a scale from 1 to 7, with 1 representing the highest degree of freedom and 7 the lowest. The score is derived from 15 civil liberties indicators, assessed through a set of specific questions. These indicators are categorized into four subcategories: Freedom of Expression and Belief (4 questions); Associational and Organizational Rights (3 questions); Rule of Law (4 questions); and Personal Autonomy and Individual Rights (4 questions).
Next, GE is a component derived from The Worldwide Governance Indicators (WGI), an extensive framework for assessing governance. Within the WGI, the GE specifically measures the quality of public services, policy formulation, and the implementation of government actions. GE scores range from − 2.50 (indicating the lowest GE) to 2.50 (indicating the highest GE) [34]. This study utilized 2021 GE data obtained from The World Bank website. The inclusion of GE in this study aligns with the findings of previous research that has underscored the pivotal role of good governance and the government’s capacity to prevent and control infectious diseases [36, 37].
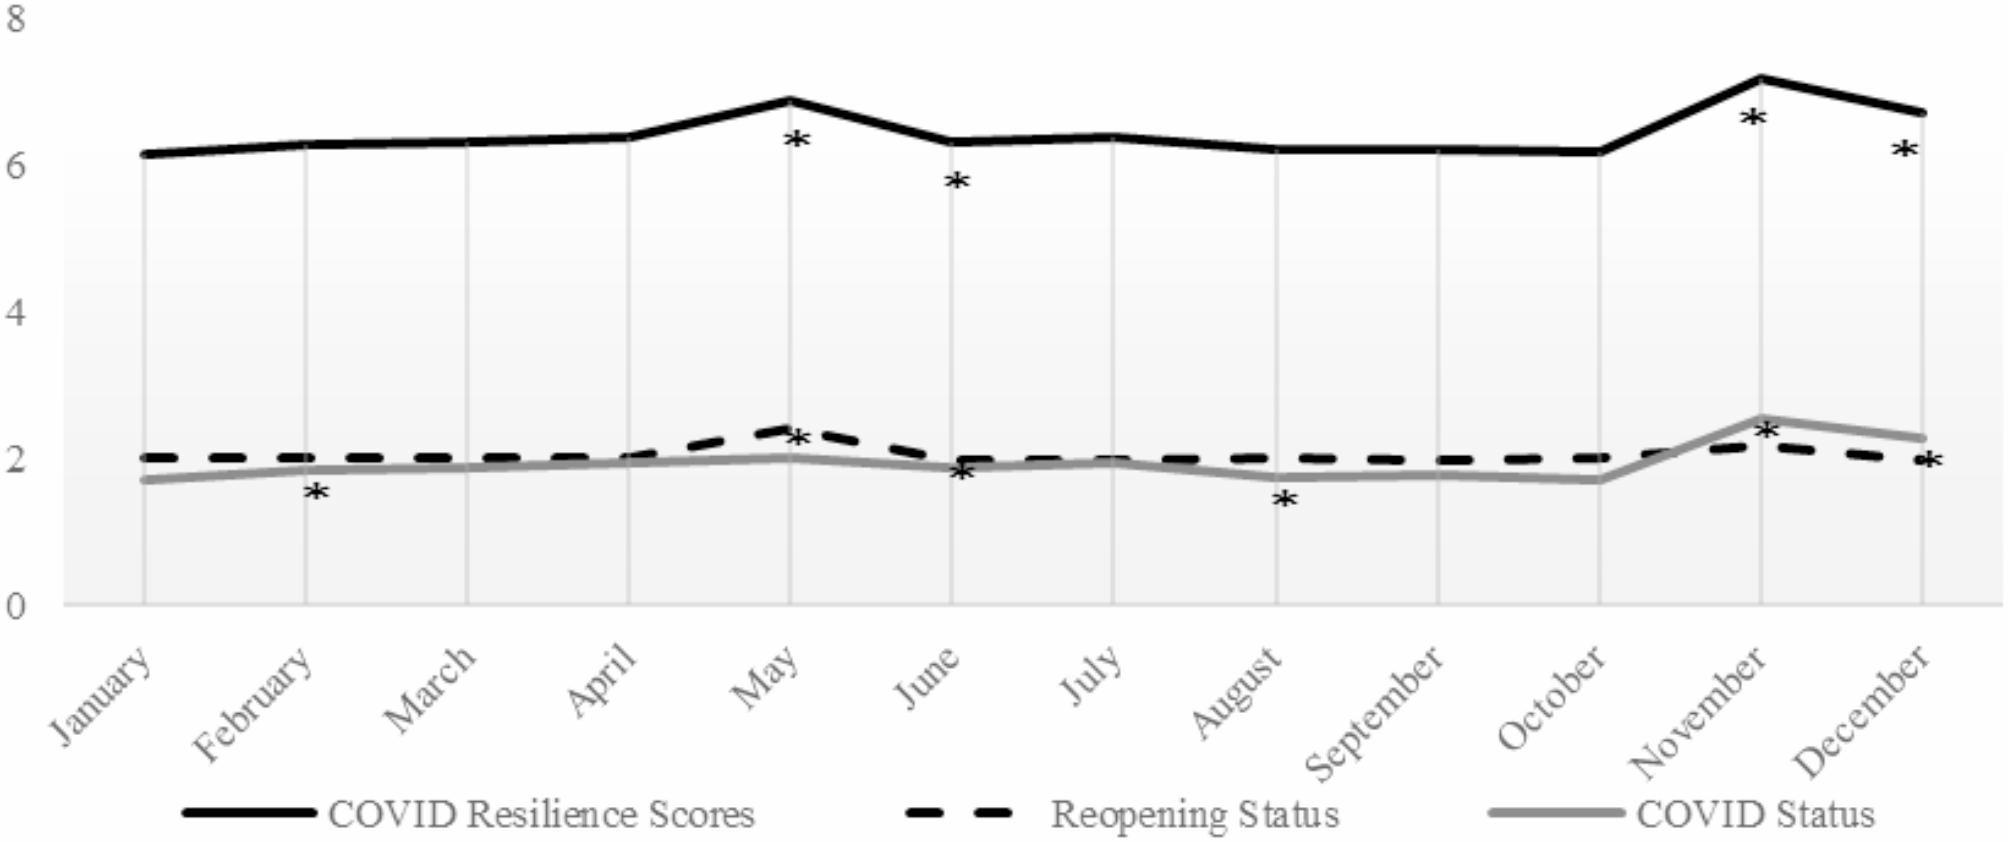
Data analysisTo evaluate the monthly trend of countries’ CRS and its Reopening and COVID Status indicators, the monthly score of each indicator was calculated and is presented in Fig. 1. For the indicator with daily data, we first calculate the average value of each component from 80 countries every month. These values were subsequently used as cutoff points to classify countries into high- and low-performance groups, with scores of 0 or 1 every month. We then summed the scores of the components of each indicator to obtain the monthly score. This applies to both the Reopening Status and COVID Status. For the indicator with only yearly data, such as Quality of Life, we assumed that the values of each component within this indicator were the same every month throughout the year. We further determined the significance of the monthly changes for Reopening and COVID Status indicators by conducting paired t-tests.
Fig. 1
Changes in COVID resilience scores and its indicators in 2021
With the cutoff point as the average score, countries were divided into high-SPAR and low-SPAR groups for analysis. The chi-square test was used to compare countries’ characteristics including their income level and geographical region, between the different SPAR and CRS score groups. Then, we conducted univariate and multivariate linear regression analyses to develop Models 1 and 2 to evaluate the associations between countries’ SPAR scores and their CRS. While Model 1 sought to identify associations between countries’ infectious disease control capacities (measured by SPAR scores) and their CRS scores in 2021, Model 2 was developed to ensure internal validity and identify factors that contribute to countries’ CRS in the same year by incorporating confounding variables.
Comments (0)