
Remember me
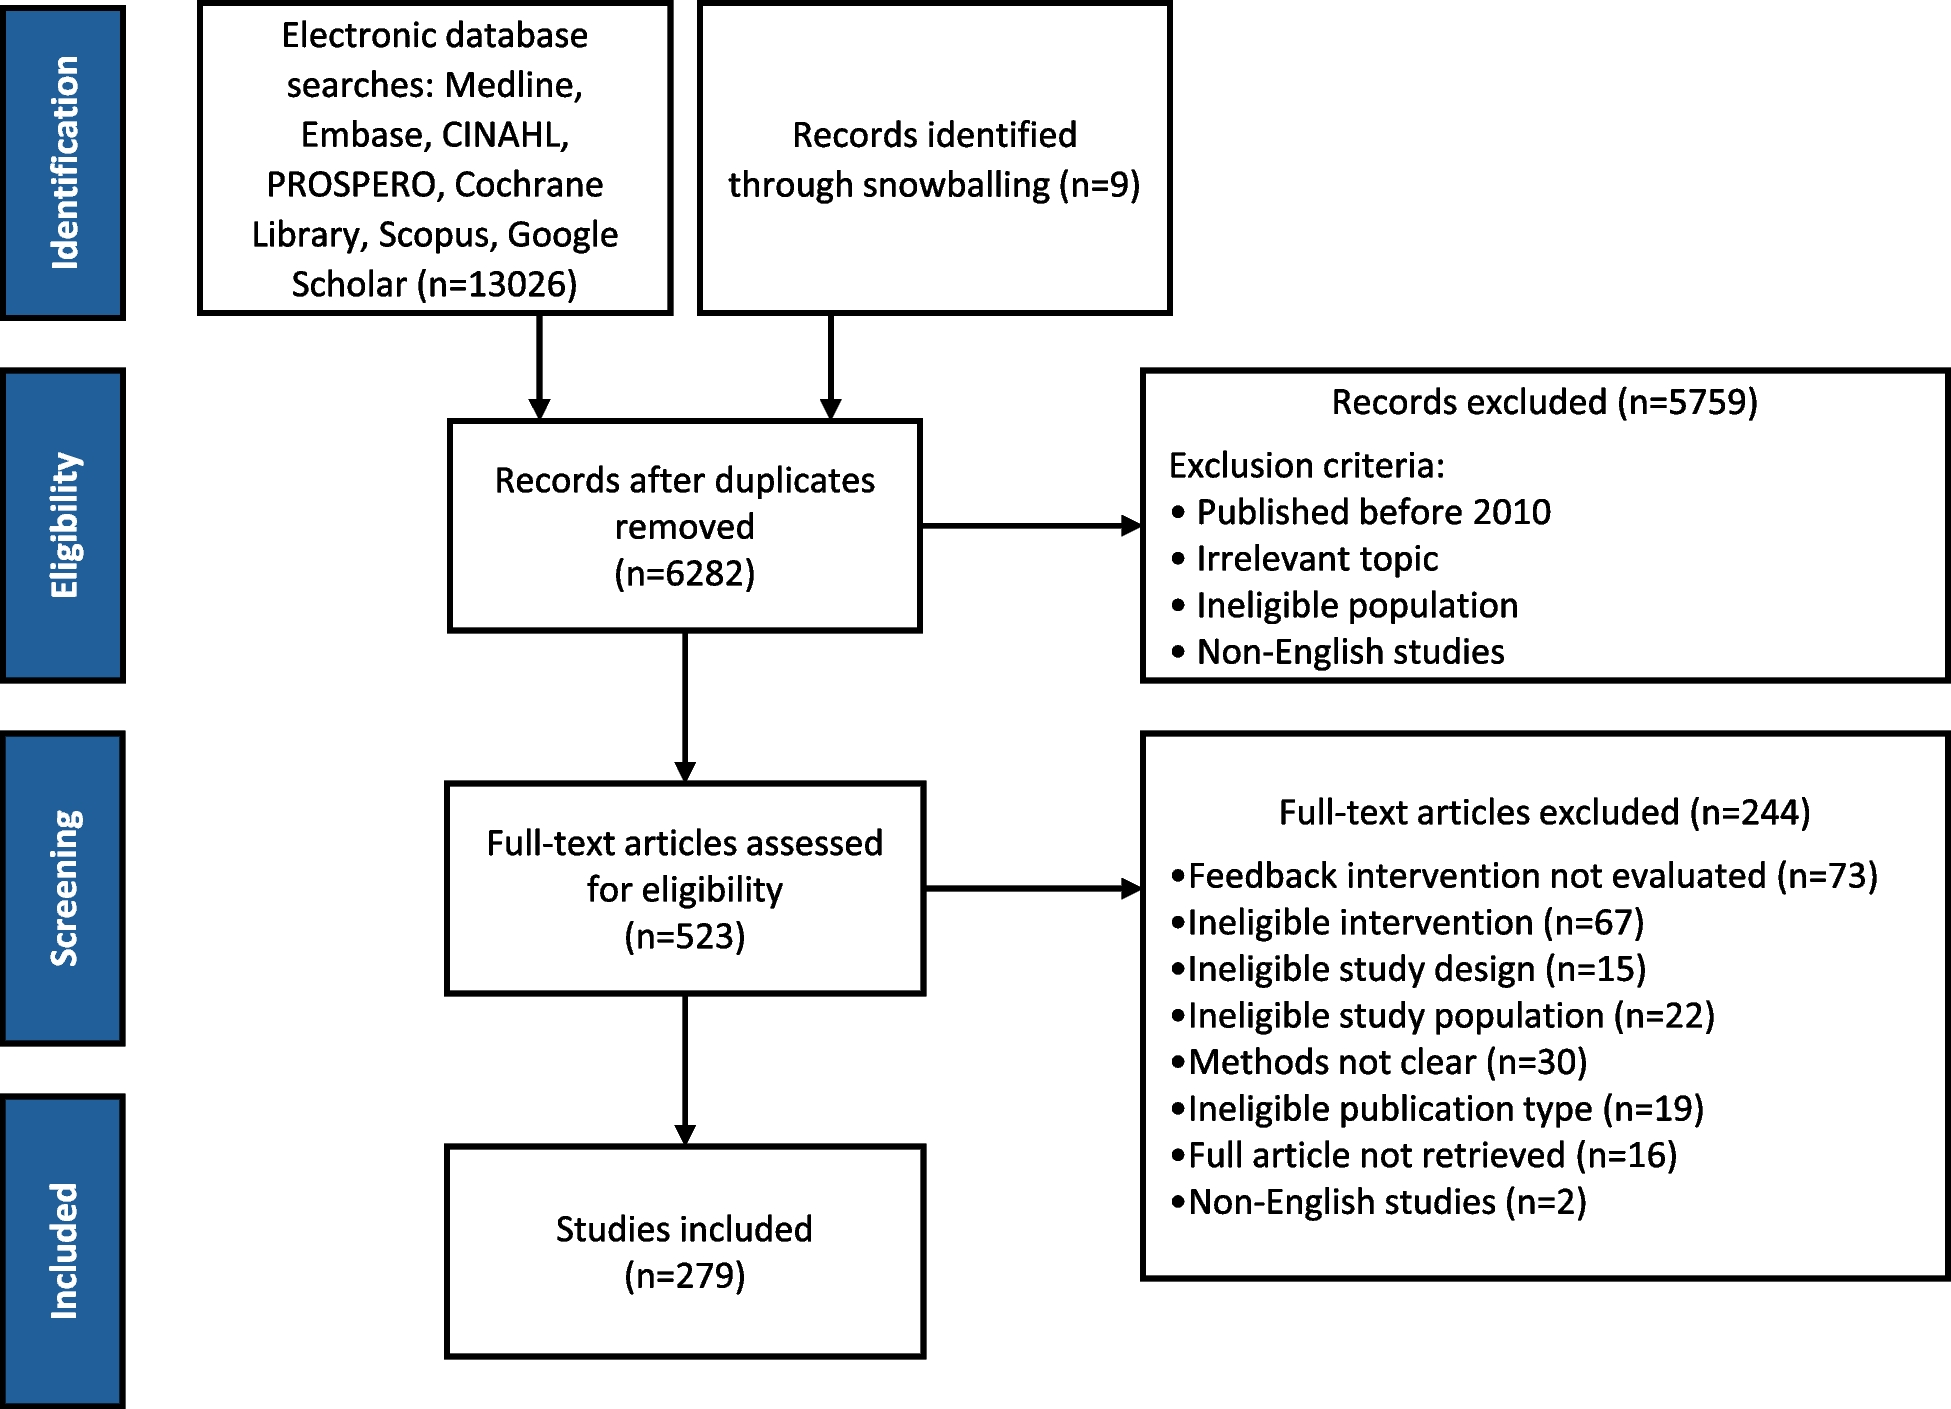


The database searches initially identified 13,026 articles, with an additional 9 articles retrieved through snowballing references. Following the removal of 6,753 duplicates, 6,282 unique articles underwent screening. Of those, 523 articles underwent full-text review, resulting in a total of 279 articles for detailed analysis. Figure 1 summarizes the review process of the publications using a PRISMA flowchart [33]. Additional file 3 includes an overview of studies and extracted data.
Fig. 1
Flowchart of the literature search
Additional file 4 provides a list of studies excluded at the full-text level, along with the reasons for their exclusion.
Study characteristicsIncluded studies were published between 2010 and June 2024, with the majority published after 2017 (69%) (Fig. 2). Most of the studies originated from the United States of America (39%) and Canada (17%). Figure 3 depicts that in 27% of the included studies feedback was used in primary care (adult and paediatric), 46% in in-patient care (pre/post-surgical care, tertiary hospitals), 10% in nursing and long-term care, 10% in specialized care settings (e.g., cancer care, urology, respiratory care, dermal care), 4% in out-patient care, 3% in other care settings (e.g., palliative care, mental care). A majority of the studies compared feedback interventions with usual care or no intervention (80%). Only a minority compared the feedback intervention with another intervention (20%). Among the included studies, 50% were pre-post studies without a control group (JBI level 2), 22% randomized controlled trials (RCTs) (JBI level 1), 16% qualitaative studies (JBI level 5), 10% quasi-experimental (JBI level 2) and 2% stepped wedge trials (JBI level 1) (Table 1).
Fig. 2
Number of publications per year. Legend: Note. Studies were searched up to June 2024
Fig. 3
Number of publications per clinical area
Table 1 Summary of study designsMethods applied in clinical practice for reporting feedbackTable 2 summarizes the types of feedback reporting practices used. Most studies delivered feedback in a written format, primarily utilizing written reports or emails (37%), 15% studies reported feedback verbally, 20% studies reported feedback using a combined method and 18% studies applied digital formats such as online dashboard or web-based systems. In terms of the quality indicators used in the interventions, 60% of studies used only process measures, 8% used only outcome measures, and 25% used a combination of both. In 7% of studies, the types of measures weren’t clearly reported. Process measures included clinical assessments (e.g., catheter removal, compliance related to pain assessment tools), adherence to guidelines, prescribing behaviours (e.g., VTE prophylaxis, radiation use, antibiotics, statins), resource utilization (e.g., colonoscopy process indicators for cancer, ICU stay, hospital readmission, ER visits), and documentation of procedures (e.g., discharge summary documentation). Outcome measures comprised clinician-reported outcomes (e.g., bloodstream infection rates, prevalence of anaemia e.g., clinical remission, blood pressure control, glycated haemoglobin (HbA1c)), adverse outcomes (e.g., rate of severe hyperglycaemia days, acquired pressure ulcers prevalence, mortality rates and cardiovascular events), and patient-reported outcome measures (PROMs) (e.g., self-reported pain). Additionally, two studies fell under the 'other' category, examining healthcare professionals’ ratings of their professionalism.
Table 2 Methods to deliver feedbackBest practices of reporting feedback recommended by CP-FITOn average, the included studies implemented 3 out of the 12 recommended best practices for feedback reporting (Table 3; Additional file 3) [14]. The most frequently employed practices were providing feedback with peer comparisons (66%), delivering timely feedback (56%), offering feedback specific to HCPs’ practice (37%), actively delivering feedback (65%), and presenting feedback in group settings (27%). In contrast, some best practices were infrequently used, such as designing user-friendly feedback (12%), using a knowledgeable source for reporting feedback (11%), and showing trends between past and current performance (8%).
Table 3 Summary of ‘best practices’ that studies reported to use when reporting feedbackCo-interventions applied in practice to facilitate behaviour changeIn total 190 studies (68%) employed a multifaceted intervention approach, combining feedback with various co-interventions, while 89 (32%) reported feedback without co-intervention (Fig. 4).
Fig. 4
Summary of types of (co) interventions
Co-interventions using facilitative approachesOf the 190 studies, 60% applied education as a co-intervention, either alone (31%) or combined with other strategies (29%). Education primarily addressed care performance gaps informed by feedback, while reminders and post-feedback consultations directly targeted feedback. Reminders (22%) served as prompts to encourage adherence to feedback recommendations, either alone or combined with other strategies like education or action toolboxes. Post-feedback consultations (19%) allowed HCPs to clarify feedback, reflect on practice, and plan actions with expert support.
Co-interventions with coercive approachesStructural modifications to practice settings were reported as co-interventions in 34% of studies, applied either alone (13%) or in combination with other co-interventions (22%). These included action toolboxes, pocket-sized guidelines, and clinical pathways, primarily aimed at improving targeted practices and thereby supporting feedback interventions. Financial or non-monetary incentives, such as gift cards, vouchers, or Continuing Medical Education (CME) credits, were implemented in 8% of studies, either independently or alongside other co-interventions. Social influence strategies, reported in 5% of studies, often involved increasing awareness of clinical norms or publicly sharing HCP performance results.
Reported impact of various approaches for facilitating behaviour change and clinical improvementInterventions showing improvements in quality of care by study designOverall, 235 studies quantitatively assessed the effectiveness of feedback (co-)interventions, with 191 (81%) reporting improvements in at least one primary quality indicator. Among pre-post studies without a control group, 91% studies showed improvements. In quasi experimental controlled group and stepped wedge trials, 79% studies reported improvements, while in RCTs, 61% showed improvements.
Interventions with improvements in quality of care by types of quality indicatorsOf these studies, 230 used either process measures (62%), outcome measures (8%) or a combination of both (30%). Improvement in quality of care was reported in 85% of studies utilizing process measures, 68% of those using outcome measures, and 79% of studies incorporating both. These differences were further pronounced when stratified by study design: in controlled study designs, improvements were observed in 69% of studies using process measures, 50% using outcome measures, and 72% incorporating both (Fig. 5).
Fig. 5
Summary of studies with improvements/ non-significant or no improvements by choice of outcomes
The most frequently reported improvements in process measures included clinical assessments (89%), such as evaluations for cancer pain, venous thromboembolism (VTE) risk, or procedures involving core biopsies and radiological imaging (e.g., CT, MRI). These assessments were often part of diagnostic protocols or pre/post-surgical procedures, such as catheter placement or adherence to aseptic techniques. Improvements were also commonly reported in prescribing practices, including the use of antibiotics, medications for chronic conditions (e.g., cardiovascular drugs), immunizations, and high-risk medications such as opioids for cancer pain, with 82% of studies highlighting positive changes. Conversely, process measures related to resource utilization—such as hospital admission or re-admission rates, length of stay (LOS), or reducing unnecessary diagnostic procedures like CT scans—showed less frequent improvement, reported in 45% of studies.
For outcome measures, 67% of studies reported improvements in clinician-reported outcomes, such as pain scores in acute care, clinical remission or adequate nutrition and growth in paediatric chronic disease management, or laboratory measures like blood pressure, temperature control, or infection rates. Improvements in PROMs were less frequently observed, with 64% of studies documenting positive changes. Adverse outcomes, including mortality rates, infection rates, and cardiovascular events, showed the least improvement, with only 27% of studies reporting favourable results.
Studies showing improvements in quality of care by types of co-interventionsStudies that included co-interventions reported improvements in 141 out of 169 studies (83%). In comparison, those without co-interventions showed improvements in 51 out of 66 studies (77%).
Co-interventions with facilitative approachesOf the studies, that applied education as a co-intervention, 76% reported improvements in at least one primary quality indicator. Improvements were more frequently reported (84%) when HCPs were educated on strategies to enhance care delivery. In-person educational meetings were the most commonly reported method, with 89% of studies indicating positive outcomes; studies with hybrid educational approaches reported improvements in 96% of studies; outreach visits in which where experts provide personalized education in HCPs' work settings resulted in improvements in 29% of studies. Post-feedback consultations showed improvements in 83% of studies. Similar results were observed for interventions including reminders (83%) (Table 4).
Table 4 Number of studies with improvements by types of co-interventions and study designsCo-interventions using coercive approachesStudies that applied co-interventions using a coercive approach reported mixed results. Among co-interventions with structural changes, decision support tools/action toolboxes pre-filled with suggested actions, and supporting materials were associated with improvements in approximately 79% of studies. Incentives such as financial rewards or continuing medical education (CME) credits were reported as effective in about 69% of studies. Similar trends were observed for studies applying social influence as a main co-intervention, with around 63% reporting positive outcomes.
Effectiveness of (co-) interventions based on content analysis of qualitative studiesWe included 44 studies that utilized a qualitative research design. Thematic analysis of the results and discussion sections of these studies revealed two main themes regarding the effectiveness of feedback interventions: 'feedback-related factors' and 'other sources influencing behaviour'. Additional file 5 provides examples of how feedback related factors and external factors were perceived to be important for the effectiveness of feedback interventions in different studies.
Feedback related factorsThe perceived usefulness of interventions was influenced by several feedback related factors; whether the data on which the feedback was provided was credible, valid and meaningful. Feedback that is timely, is non-punitive, applies user-friendly designs and compares data to other HCPs, was easier to interpret by HCPs and facilitated behaviour change.
Other factors influencing HCP behaviourOrganizational factors play an important role, with adequate resources, such as sufficient time and manpower to carry out tasks related to the quality improvement intervention, emerging as a common theme to be necessary for effective feedback implementation. This is followed by strong leadership, a culture that supports learning, and the presence of co-interventions, all of which create an environment conducive to utilizing feedback. HCP factors, including self-efficacy, knowledge/skills to use data, and expectation management, also determine how feedback is perceived and utilized. For example, when HCPs felt accountability towards their patients, they were more engaged with feedback [45]. Furthermore, external factors such as interactions with other HCPs within own organization or network may further enhance motivation to change behaviour and apply feedback in practice.
Additionally, patient behaviours such as patients demanding more antibiotics than those recommended, can undermine HCPs’ control over desired practices, thereby impacting their engagement with feedback [46]. Conversely, the involvement of health insurers adds to the complexity of how feedback is perceived and acted on. Table 5 provides a joint meta-synthesis display of findings from qualitative and quantitative studies.
Table 5 Meta-Synthesis Matrix: Integrating Feedback Reporting Approaches and Co-Interventions to Enhance Effectiveness
Comments (0)