Cohort description
This study used samples from the longitudinal intervention study VITAL reported in detail elsewhere [5, 13]. In short, individuals 25 to 98 years old were recruited. Individuals were excluded when they use or used immune-modulatory drugs or have a disease that make them immunocompromised, including recipient of an organ- or bone marrow transplant, used high-dose of daily corticosteroids or received chemotherapy in the last 3 years. Detailed inclusion and exclusion criteria have been reported previously [13].
From the VITAL cohort, we selected 31 individuals who are sex and CMV seropositivity matched for three age groups: young adults (25–49 years old), middle-aged adults (50–64 years old), and older adults (65–77 years old) who were characterized as low or high responders to multiple vaccines (section Serum antibodies and vaccine response profiles). Participants were further categorized as low or high responders to multiple vaccines (section Serum Antibodies and Vaccine Response Profiles). The selection of low and hig responders was designed to minimize the influence of age, sex, and CMV seropositivity (p > 0.05), thereby reducing potential confounding effects on vaccine response and immunosenescence. This approach was based on previous findings from the VITAL cohort, where older male participants were enriched among low multiple vaccine responders [13].
Sample collection and Preparation
PBMCs were isolated from whole blood samples at the start of the VITAL study, before influenza vaccination, using density gradient centrifugation with Lymphoprep (Progen). The cells were resuspended in a cryoprotective solution containing 20% Fetal calf serum (FCS, Hyclone, GE Healthcare, Chicago, Illinois, USA) and 10% dimethyl sulfoxide (DMSO, Sigma-Aldrich). The PBMCs were aliquoted into cryovials, gradually frozen and stored at -135 °C until further analysis. Cryopreserved PBMC samples were rapidly thawed in a 37 °C water bath. The cells were immediately diluted in RPMI 1640 medium (Gibco) supplemented with 10% FCS, and centrifuged at 300×g for 10 min, and resuspended in fresh medium. Cell viability and counts are determined using Beckman Coulter z2 (Beckman Coulter).
Immune phenotyping
PBMCs were stained using a panel of fluorochrome-conjugated anti-human antibodies. For surface antigens CCR4 BV605 (clone: L281H4, supplier: BD Biosciences), CCR6 BV711 (G034E3, Biolegend), CCR7 BV421 (G043H7, Biolegend), CD127 APC-R700 (HIL-7R-M21, BD Biosciences), CD14 Superbright 436 (61D3, ThermoFisher), CD159a APC (REA110, Miltenyi Biotech),, CD19 Superbright 436 (HIB19, ThermoFisher), CD25 cFluorBYG710 (BC96, Cytek), CD27 APC-H7 (M-T271, BD Biosciences), CD28 BV650 (CD28.2, Biolegend), CD3 BUV805 (SK7, BD Biosciences), CD31 BUV563 (L133.1, BD Biosciences), CD38 APC/Fire 810 (HIT2, Biolegend), CD4 cFluorYG584 (SK3, Cytek), CD45RA BUV395 (5H9, BD Biosciences), CD56 Superbright 436 (TULY56, ThermoFisher), CD57 BB515 (NK-1, BD Biosciences), CD8 cFluor V547 (SK1, Cytek), CD95 PE-Cy5 (DX2, Biolegend), CX3CR1 BUV737 (2A9-1, BD Biosciences), CXCR3 PE-Cy7 (G025H7, Biolegend), CXCR5 BV750 (RF8B2, BD Biosciences), HLA-DR BV570 (L243, Biolegend), ICOS BUV661 (DX29, BD Biosciences), KIR2D PE (NKVFS1, Miltenyi Biotech), KIR3DL1/DL2 PE (5.133, Miltenyi Biotech), KRLG1 VioBlue (REA261, Miltenyi Biotech), PD-1 BV785 (EH12.2H7, Biolegend), TCR γδ PerCP-Vio 700 (REA591, Miltenyi Biotech), TIGIT BV480 (741182, BD Biosciences), for intracellular/intranuclear antigens, CTLA-4 PE-CF594 (BNI3, BD Biosciences), Foxp3 BB700 (236 A/E7, BD Biosciences), Helios Alexa Fluor 647 (22F6, Biolegend) were used. Cell viability dye Live Dead Blue (ThermoFisher) was used to stain dead cells. In the surface antigen staining mix True-Stain Monocyte Blocker (Biolegend) was added and all antibody mixes were prepared in Brilliant Stain Buffer Plus (BD Biosciences). All staining steps were performed in the dark at room temperature. For the intracellular/intranuclear antigen stainings, cells were fixed Foxp3/Transcription Factor Staining Buffer Set (Invitrogen) following the manufacturer’s instructions. During analysis, we observed a suboptimal stain index for CXCR5, which may have affected its resolution. However, some CXCR5hi populations were still detected in FlowSOM heatmaps and UMAP projections. Therefore, interpretations of CXCR5 + subsets should be made with caution.
All samples were acquired Cytek Aurora 5 L (Cytek Biosciences) and unmixed using SpectroFlo (v3.1.0). The cytometer was calibrated using manufacturer-supplied calibration beads to ensure accurate fluorescence intensity measurements. Technical control PBMC samples from the same individual were taken along for each experiment to track cytometry performance and potential batch effect issues.
Spectral cytometry data analysis
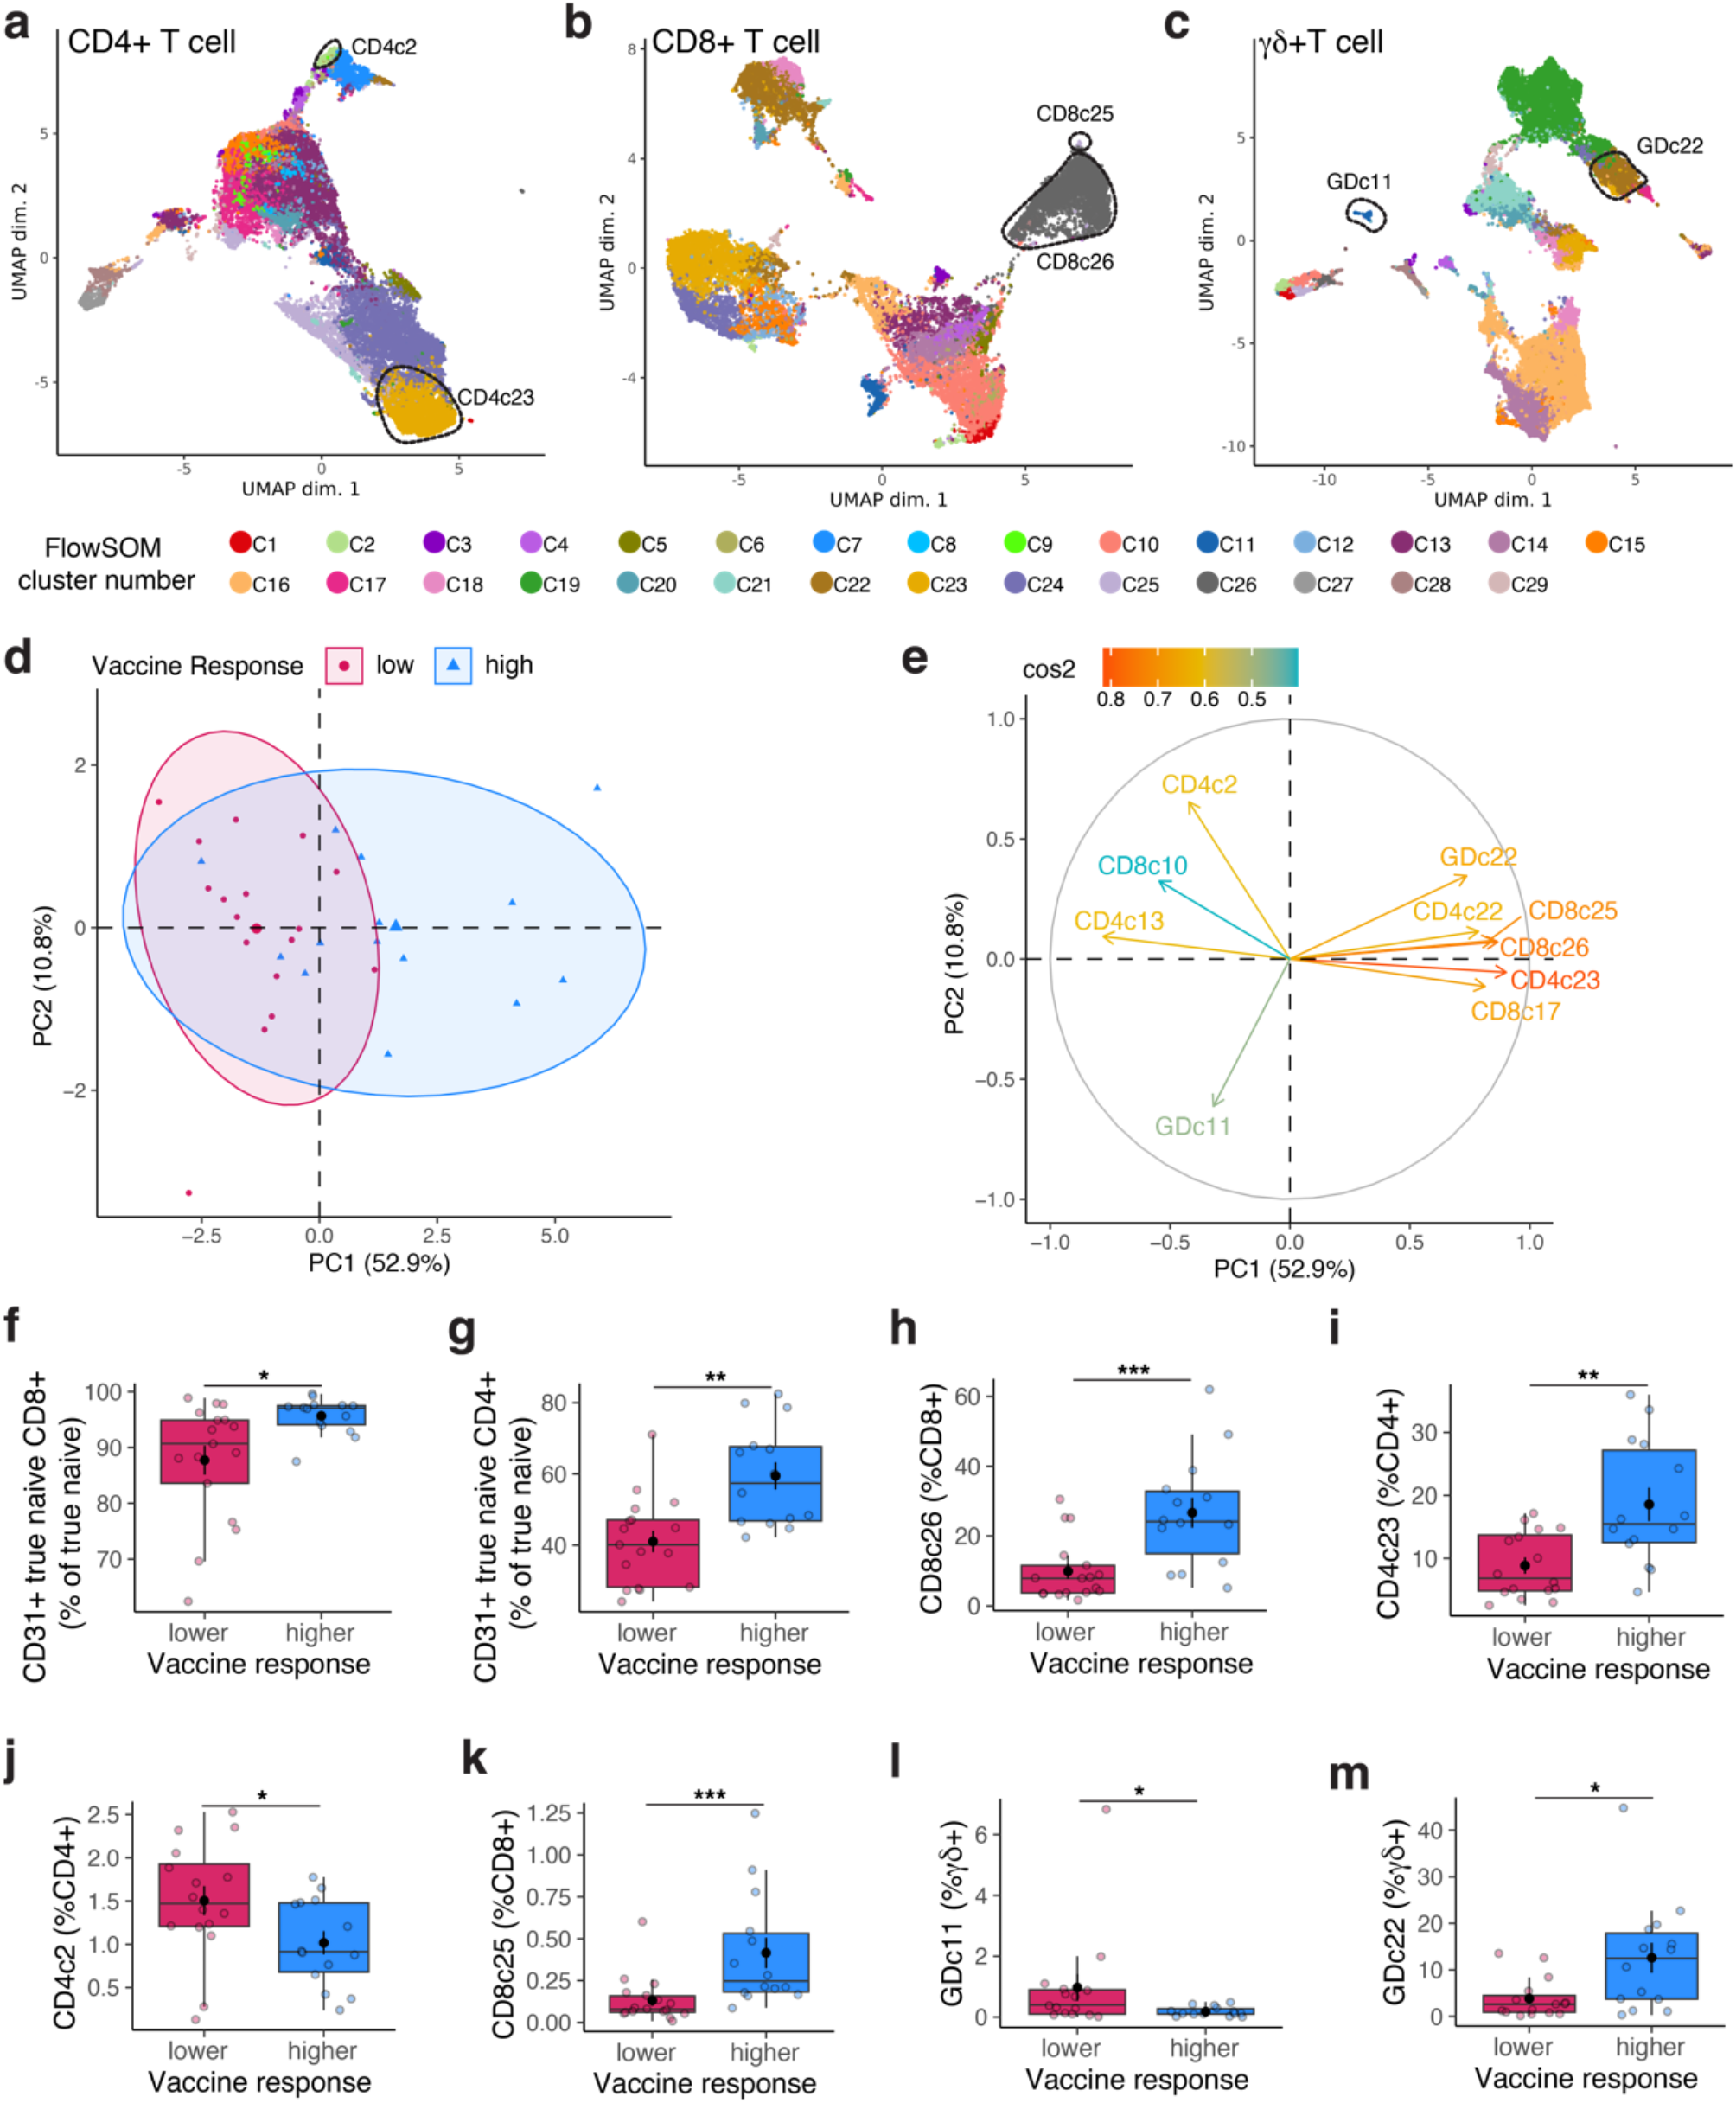
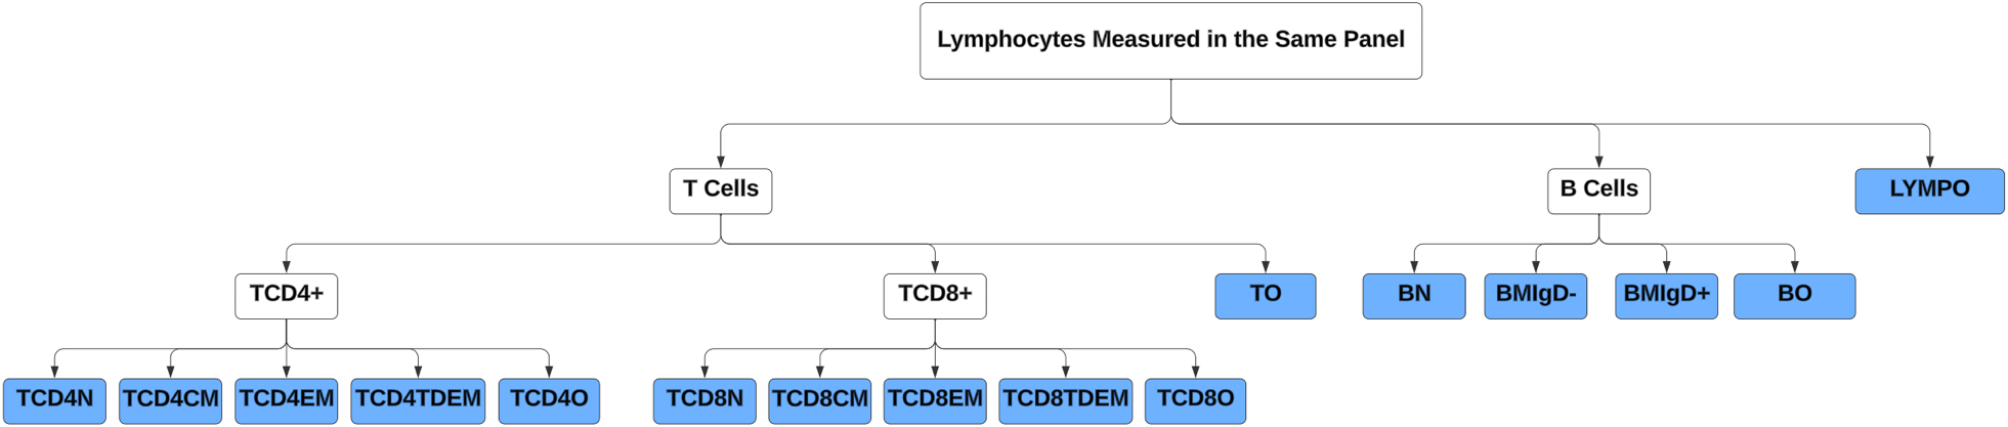
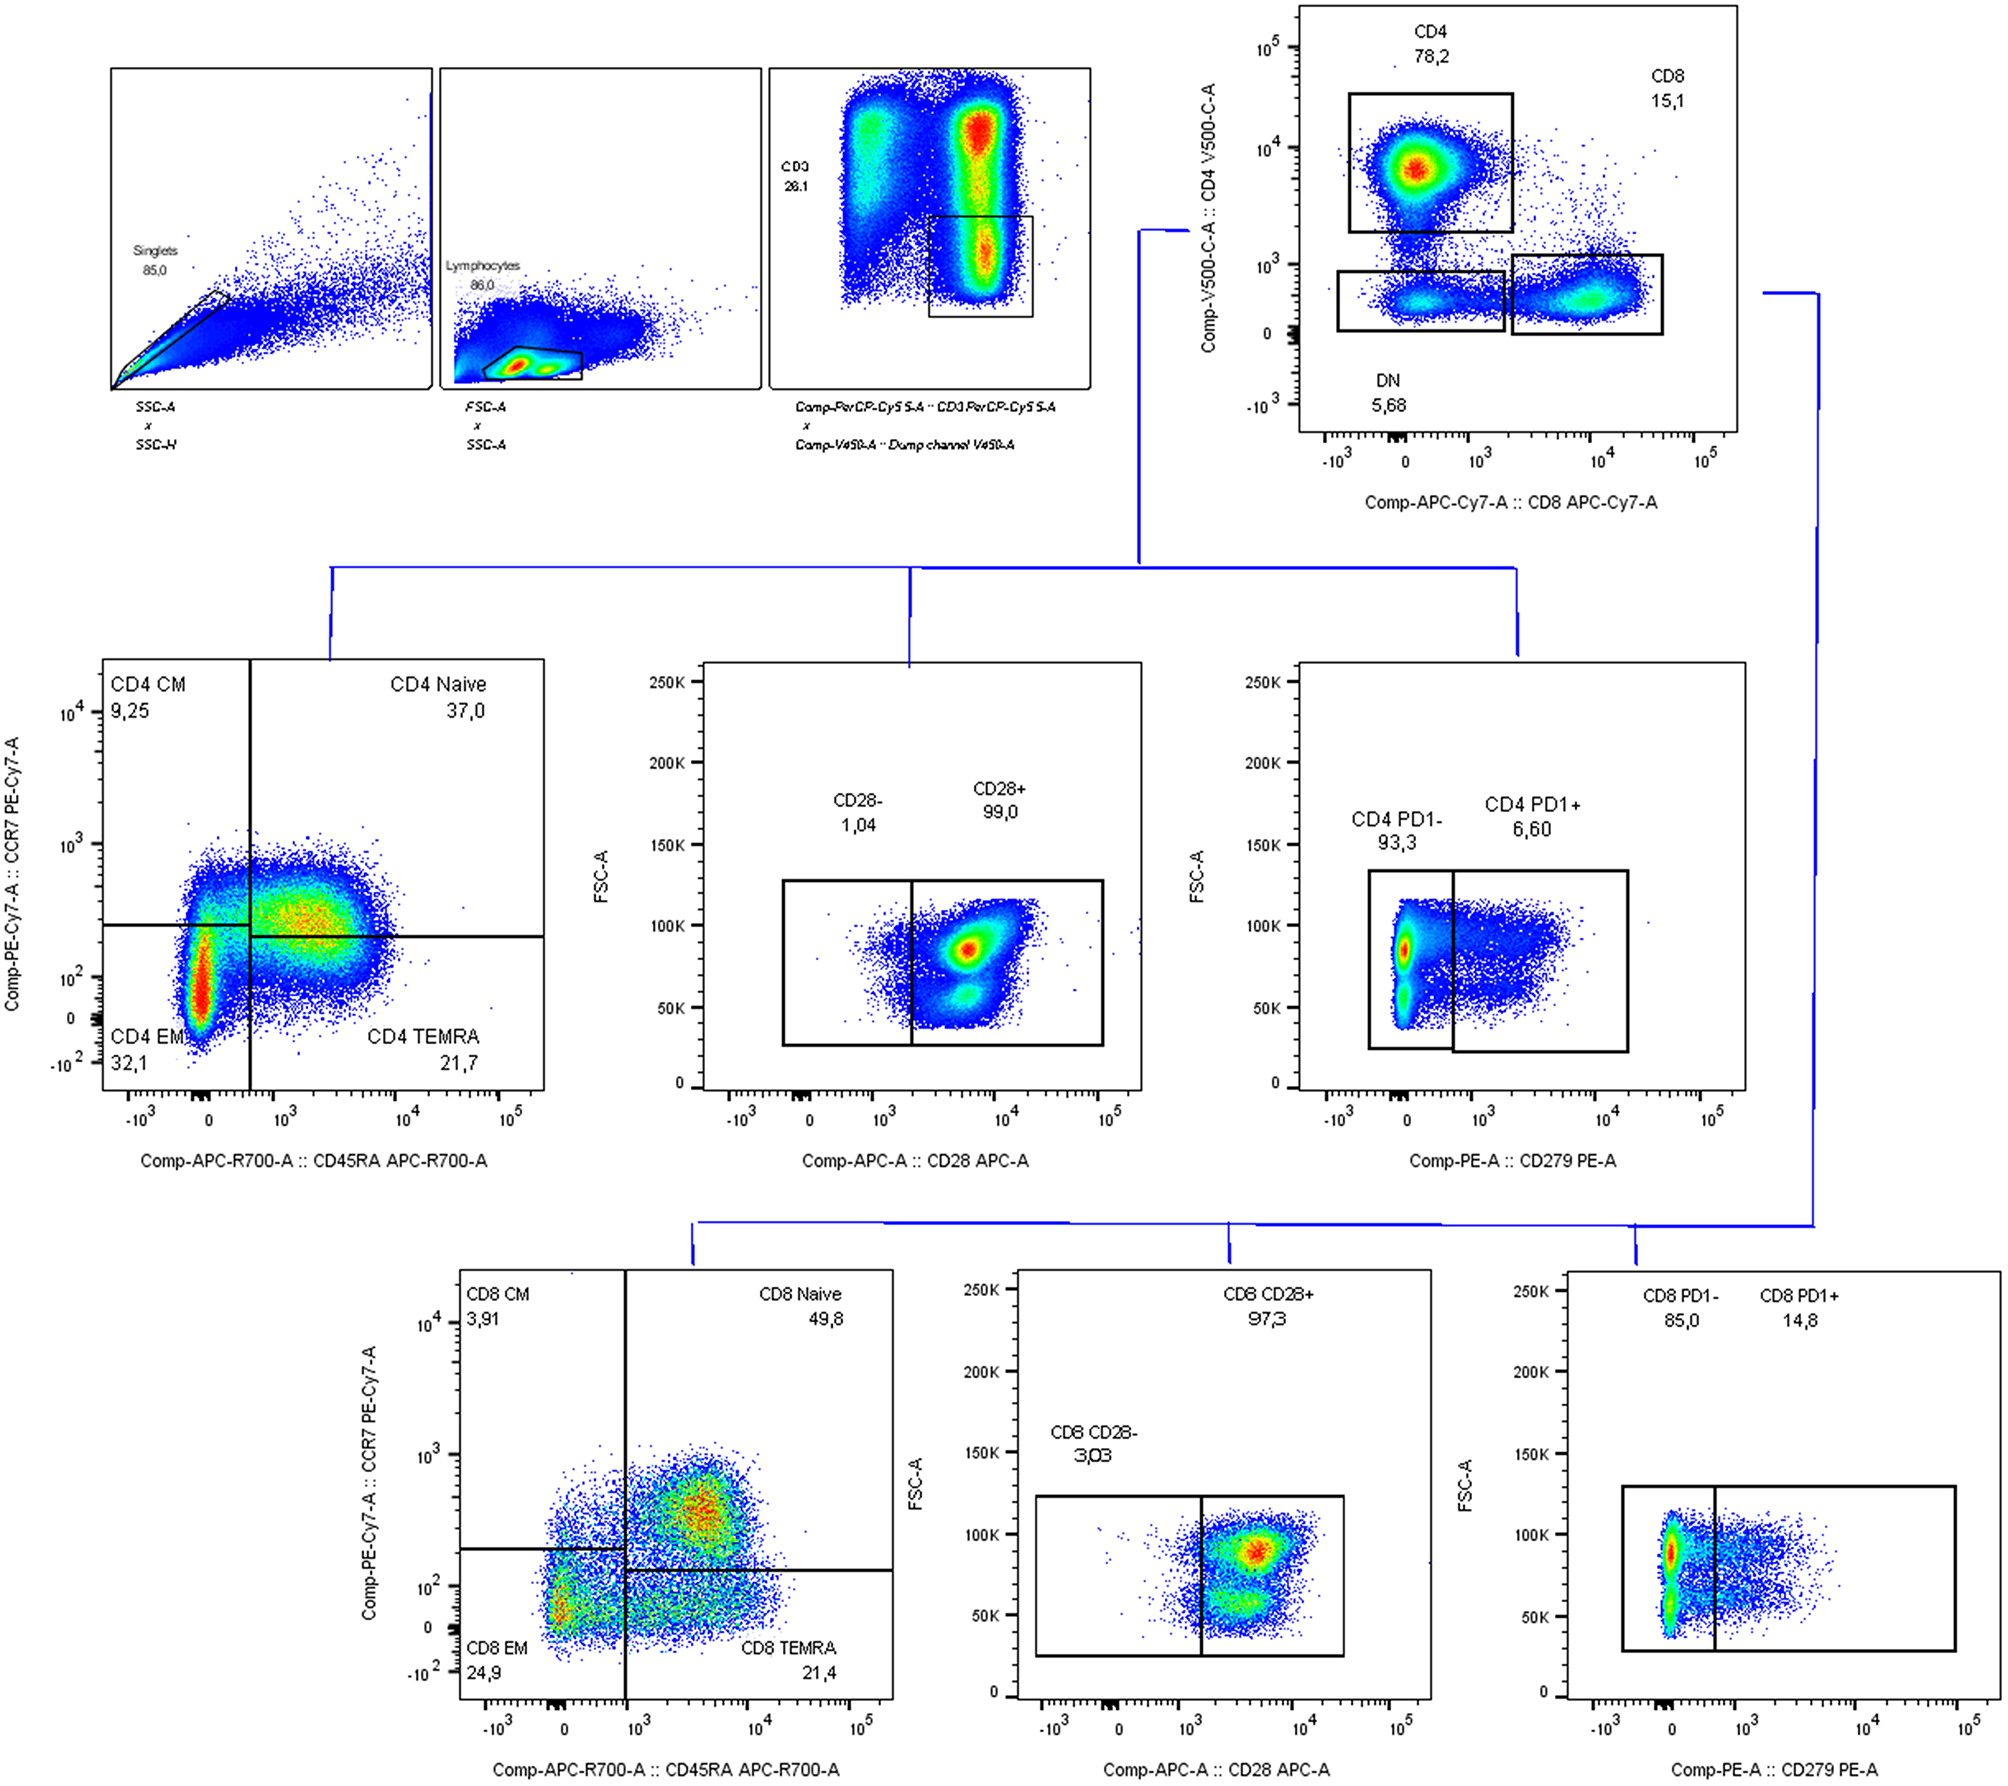
Unmixed samples were manually gated in FlowJo (V10.7.1, Tree Star) (Supplementary Fig. 1). CD14, CD19 and CD56 are used as dump channels to gate out monocytes, B cells and Natural killer cells. KIR2D and KIR3DL1/DL2 antibodies are used together to define panKIR population. Furthermore, pre-gated (single cells, lymphocytes, dump-, live, CD3+) samples were exported as three major T cell subsets: CD4 + CD8-γδ- (CD4 + T cells), CD8 + CD4-γδ- (CD8 + T cells) and γδ + T cells, which were imported into R for unsupervised analysis utilizing the RADIANT pipeline. In short, samples were cleaned using PeacoQC [45] and archsinh transformed using optimized cofactors for each channel per major T cell subset. Batch effects were not detected, which was assessed by comparing marker expression profiles of technical controls in histograms and clustering of samples and technical controls on Multidimensional scaling plots (Supplementary Fig. 8a-c). Furthermore, samples were clustered using FlowSOM [46], and frequencies of meta clusters and MFI of antigens were exported to R for downstream analysis.
Immune entropy
Immune entropy was calculated using whole blood immune subsets collected at the pre-vaccination timepoint before the administration of the first vaccine as described previously [12]. In short, immune entropy quantifies the degree of deviation in an individual’s immune profile from a reference group of younger individuals, serving as a measure of immune system perturbation and dysregulation. This is determined by computing the correlation distance (1 - Spearman’s rho) between an individual’s immune cell composition and the median immune cell composition of the reference group. The calculation incorporates a total of 59 immune cell subset variables, ensuring that it captures the overall immune network structure rather than focusing on individual cell types. Immune entropy is a candidate functional biomarker of immune aging, reflecting cumulative changes in the immune system that are not fully explained by chronological age. A higher immune entropy score indicates a greater degree of immune dysregulation, which has been linked to weaker vaccine responsiveness. Since immune entropy associates with vaccine responsiveness after correcting for age and sex effect, in this study immune entropy has been used to assess the relevance of in-depth T cell subsets in terms of immunosenescence.
Cytomegalovirus seropositivity
Immunoglobulin G antibodies against CMV were quantified in serum collected before vaccination by a multiplex immunoassay developed in-house [47]. Seropositivity thresholds were adapted from a previous study [48]. For CMV, a concentration of < 7.5 relative units (RU) ml − 1 was categorized as seronegative and ≥ 7.5 RU ml − 1 as seropositive.
Serum antibodies and vaccine response profiles
Serum antibody measurements for the VITAL and VITAL-Corona studies have been described in detail elsewhere [13]. Briefly, antibody levels were measured pre-vaccination and 28 days post-vaccination for each vaccine: H3N2 hemagglutination inhibition titer for QIV, IgG concentrations against the 13 pneumococcal serotypes for PCV13, and IgG binding antibody units (BAU) against the SARS-CoV-2 Spike S1 protein for mRNA-1273. Pre-vaccination antibody level adjusted triple vaccine response quartiles were calculated as previously described [12]. Due to the variation across vaccine responses within the same individual and to get a better proxy for immunosenescence, triple vaccine responsiveness has been used instead of per vaccine response. For this study, response quartiles lower than the median triple vaccine response quartiles (TQ1 and TQ2) were combined to define the “low” response category, while response quartiles higher than the median triple vaccine response quartile (TQ3 and TQ4) were combined to define the “high” response category.
Statistical analyses
Data handling, statistical analyses, and visualization were performed in R (version 4.2.2) and R Studio (version 2022.12.0.353).


Comments (0)