
Remember me
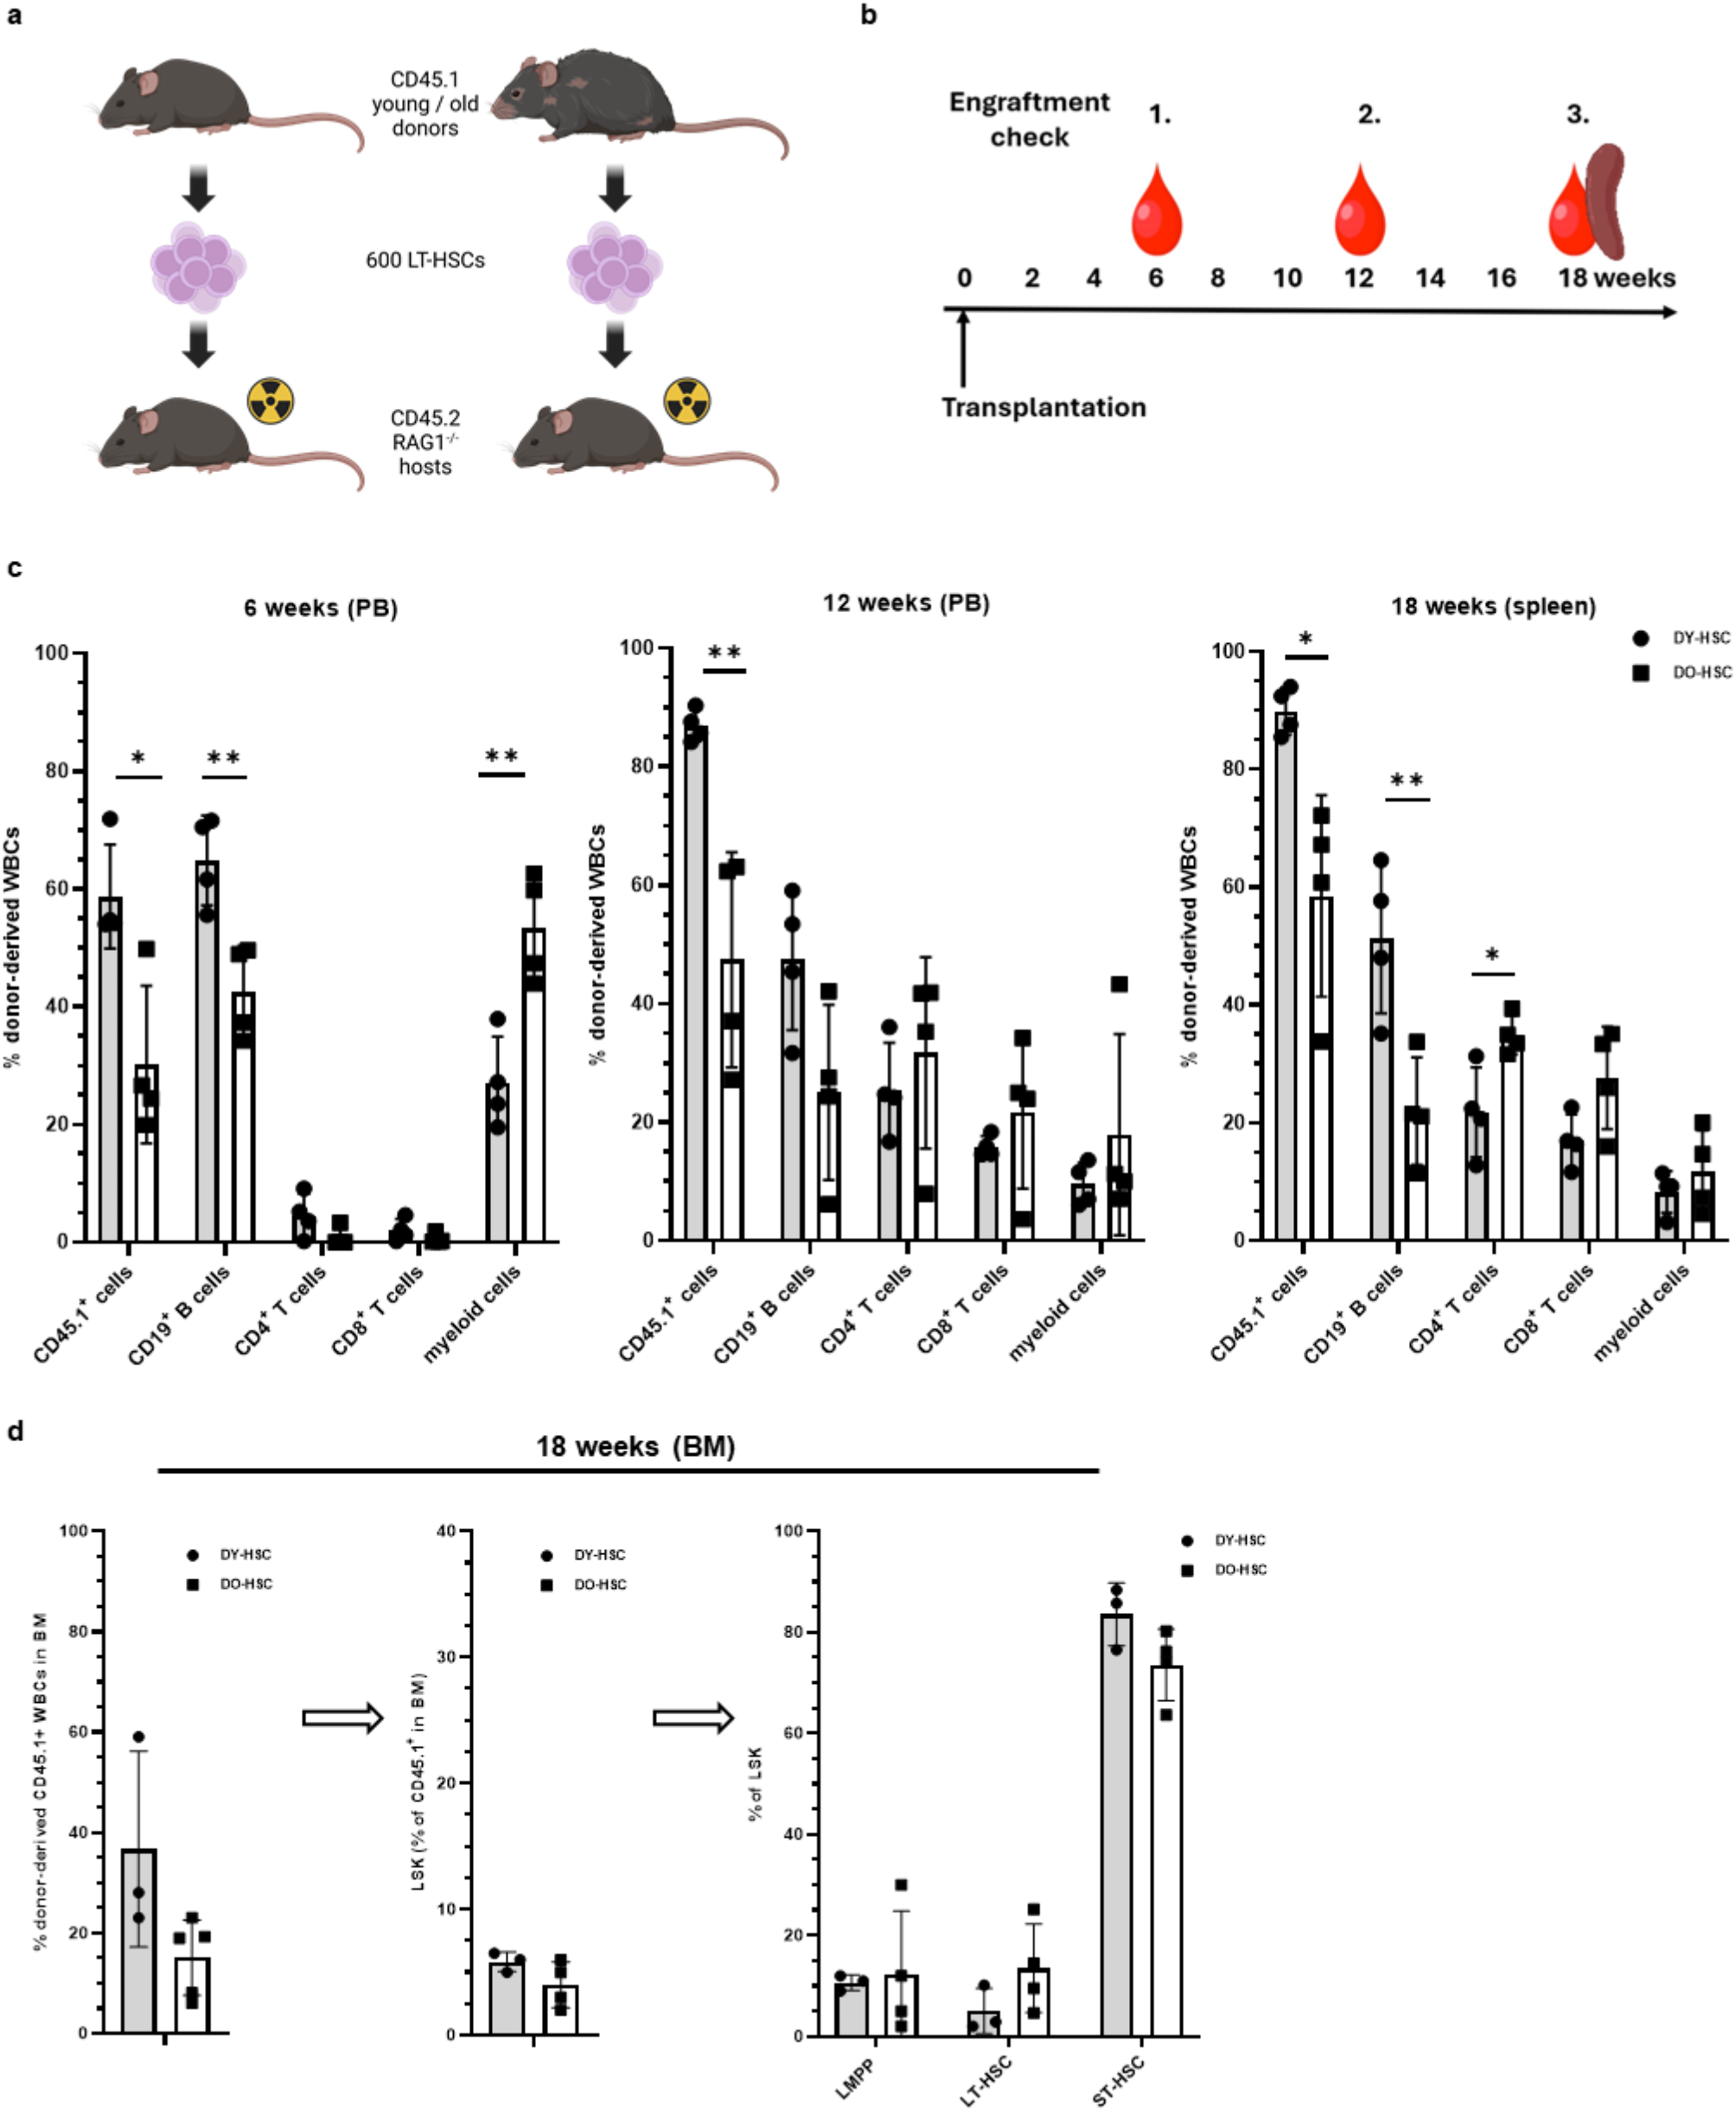


The Health and Retirement Study (HRS) is an ongoing nationally representative longitudinal survey of older adults in the U.S. It began in 1992 and included over 22,000 adults over the age of 50 years at baseline and interviewed every two years [17]. Data collection consisted of face-to-face baseline interviews and primarily telephone interviews for follow-up waves, until 2006, when half the sample (alternated at each subsequent wave) was randomly assigned face-to-face interviews to enhance physical and biological measures. In this study, we utilized data from the 2016 h survey that included venous blood samples collected from 9,932 participants during 2016-17.
All participants who completed an interview during the 2016 wave were asked to consent to a venous blood draw except for proxy respondents and nursing home residents. The request was made by their HRS interviewers at the end of the interview. Blood collection occurred in the participants’ homes, managed by Hooper Holmes Health & Wellness. The vast majority of the blood samples were collected within four weeks of the interview completion. Overall, 65% of eligible participants provided a blood sample. Blood collected in cell preparation tubes (CPTs) was shipped at room temperature to the Advanced Research and Diagnostics Laboratory at the University of Minnesota and processed within 48 h of collection. The samples were transported in Styrofoam-lined shipping containers with foam holders specifically designed for the CPTs. Additionally, 2–3 gel packs, maintained at room temperature, were placed outside the Styrofoam layer but within the cardboard container to minimize temperature fluctuations during transit. The CPTs were centrifuged to isolate peripheral blood mononuclear cells (PBMCs), which were then cryopreserved using established protocols and stored in liquid nitrogen freezers for future use [16, 36].
Immunophenotyping and percentage measuresThe immune subset cells were identified using minor modifications to the standardized protocol published by the Human Immunology Project [37]. Per these guidelines, large batch analysis of frozen and thawed PBMC was found to be superior in reproducibility, while reducing small-batch variability associated with fresh sample analysis. One vial of cryopreserved mononuclear cells containing ~ 4 million cells was thawed, and cells were incubated at 37 °C in Roswell Park Memorial Institute media for 1 h. The cells were centrifuged at 1 200 rpm for 10 min at room temperature. The cells were resuspended in 1× phosphate buffered saline and stained as outlined previously [38]. The cells were kept on ice until analysis. All flow cytometry measurements were performed on an LSRII flow cytometer or a Fortessa X20 instrument (BD Biosciences, San Diego, CA). The validity of the T cell distributions obtained from cryopreserved PBMCs using the procedures used in HRS has been demonstrated previously [38]. In addition, control samples from healthy volunteers collected and cryopreserved at the start of the study were analyzed at least twice per week using the study protocol to monitor laboratory shifts and drifts in the immunophenotyping assessments.
In this study, we focused on lymphocyte data and key components of the adaptive immune system: T and B cells. These cells were measured in the same panel based on previously published protocols [36, 38], and the immunophenotyping data were analyzed using OpenCyto and FlowAnnotator [39]. Table 1 presents 15 examined T and B subset cells, including the cell type, marker used to determine the cell, abbreviated name, and percentage measure. In HRS flow cytometry, T and B subset cells were initially measured as percentages, calculated as the proportion of events relative to their parent populations within the live lymphocyte gate after removing doublets. Each subset cell was represented as a percentage of its parent cell. For example, the percentage of T cells was calculated as ‘Total T cells/total lymphocyte*100’; the percentage of TCD4 + was calculated as ‘CD4 + T cells/total T cells*100’; the percentage of TCD4N was calculated as ‘CD4 + Naïve T cells/CD4 + T cells*100’.
Table 1 Available percentage measures of 15 major subsets of T and B cellsWhile both percentage data and count data were provided in the HRS, we prioritized the use of percentage data for two reasons. First, percentages were the primary measurements obtained in the HRS, while counts were derived by multiplying these percentages by total lymphocyte counts from the complete blood count. Our analyses confirmed that results based on percentages were identical to those obtained using counts, as both reflect the same underlying immunophenotypes. Second, percentage data offer greater consistency for population-level analyses by standardizing measurements relative to parent populations. This reduces biases caused by inter-individual variability in total lymphocyte counts and facilitates meaningful comparisons across a large cohort.
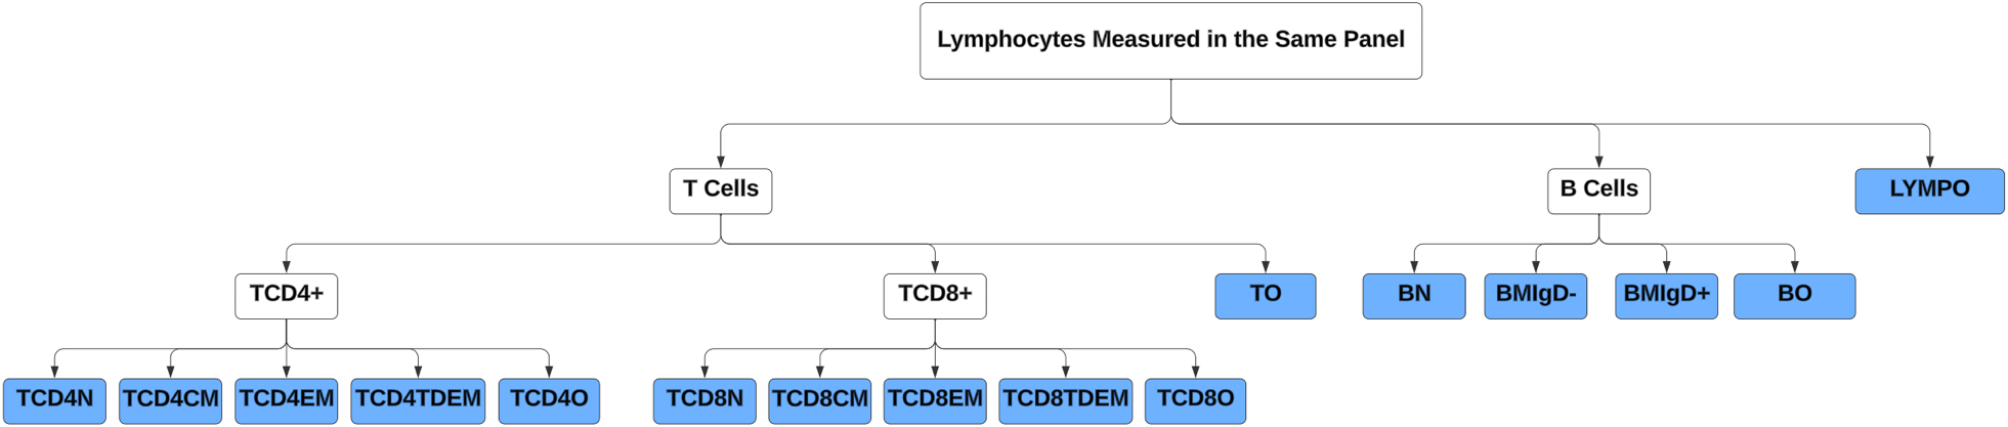
Tree structure and compositional measuresBased on the T and B subset cells in Table 1, we constructed a hierarchical tree structure to delineate the relationships among these cells across four levels of granularity (Fig. 1). In addition to the 15 subset cells provided by HRS, we introduced five additional subset cells because the sum of various subset cells at the lower level did not add up to 100% for their corresponding parent cells. For example, we introduced “other lymphocytes” because the combined percentage of T cells and B cells was less than 100%. The five newly defined five subsets included other lymphocytes (LYMPO), other B cells (BO), other T cells (TO), other CD4 + T cells (TCD4O), and other CD8 + T cells (TCD8O).
Fig. 1
Hierarchical tree structure of T and B cell subsets. Footnote: The full names of the subset cells are summarized in Table 1. The subset cells highlighted with a blue background at the lowest level were included in our analysis
The percentage measures of subset cells in Table 1 used different denominators, making it difficult to examine and analyze them as a system. Based on the tree structure, we converted the percentage measures to compositional measures through several steps, allowing us to represent the proportion of each subset cell relative to the total lymphocyte count. First, we excluded 3,032 individuals with missing data on T and B cells and their subsets. We compared those with and without missing data and found they were comparable in main sociodemographic characteristics (Supplementary Table 1). Second, we excluded 39 participants because adding percentages of subset cells at the lower level exceeded 100%. Last, we generated the compositional measure for each subset cell by multiplying proportion measures at different levels so that the newly generated measure reflected the proportion of each subset cell in relation to the total lymphocyte count. The 16 subset cells at the most granular level (colored blue) in Fig. 1 were used for statistical analysis to provide the most detailed information and avoid redundancy.
Health outcomesWe included three main health outcomes: a chronic disease index, self-reported health, and frailty level. The chronic disease index is the number of self-reported chronic conditions for each participant at the time of data collection in 2016 and ranges in value from 0 to 8. It is created by summing the number of affirmative responses to the following questions: Has a doctor ever told you that you have the following condition: (1) hypertension or high blood pressure; (2) diabetes or high blood sugar; (3) cancer or a malignant tumor of any kind except skin cancer; (4) chronic lung disease except asthma such as chronic bronchitis or emphysema; (5) heart attack, coronary heart disease, angina, congestive heart failure, or other heart problems; (6) stroke or transient ischemic attack; (7) emotional, nervous, or psychiatric problems; and (8) arthritis or rheumatism. The measure of self-reported health is represented by participants’ rate of their health status on a five-point scale ranging from 1 (excellent) to 5 (poor).
Frailty was measured using a deficit accumulation approach that included 44 variables reflecting multiple physiological systems in HRS [40,41,42]. These variables included self-reported chronic diseases, self-reported health, limitations in ADLs and IADLs, mobility restrictions, cognitive functioning, sensory impairments, somatic and depressive symptoms, BMI categories, and low physical activity. Each variable was scored from 0 (no deficit) to 1 (complete deficit), with intermediate values for ordinal or metric items. A continuous frailty index ranging from 0 to 1 was calculated as the total score divided by the maximum possible score. For interpretability, we categorized the frailty index into four ordered groups: robust (< 0.15), prefrail (0.15–0.24), mildly frail (0.25–0.34), and moderate-to-severely frail (≥ 0.35). These categories, assigned values from 1 to 4, allowed frailty to be examined as an ordered categorical outcome, consistent with the other two health measures. Across all three health outcomes, lower values indicate better health status. Correlations among these outcomes ranged from 0.37 to 0.60 (Supplementary Table 2), with the strongest correlation (r = 0.60) between the chronic disease index and frailty.
Other covariatesSelf-reported sociodemographic characteristics were collected in the 2016 core interview, including age, sex, race/ethnicity, and educational attainment. Sex was self-reported as either men or women. Race/ethnicity was categorized as non-Hispanic White, non-Hispanic Black, Hispanic, or Other Race. Educational attainment was categorized as below secondary education, lower secondary education, upper secondary education, and above upper secondary education. Cytomegalovirus (CMV) seropositivity was assessed using the Roche e411 immunoassay analyzer (Roche Diagnostics Corporation, Indianapolis, IN). The interassay coefficient of variation was 3.4% at a mean concentration of 1.2 COI (cutoff interval) and 2.9% at a mean concentration of 141.4 COI. Results were reported as nonreactive (< 1.0 COI) or reactive (≥ 1.0 COI). Since CMV is known to affect immune cell composition, especially effector T cells and memory T cells, we included CMV status (nonreactive or reactive) as a covariate to account for its possible influence on immune-health associations. A total number of 611 participants without information on these covariates were excluded. The final analytical sample included 6,250 participants, and the flow chart is shown in Supplementary Fig. 1.
Statistical analysisAll analyses were conducted using R version 4.2. We examined correlations among the 16 subset cells at the most granular level in Fig. 1. We conducted both unsupervised and supervised learning analyses on lymphocyte compositional measures. The unsupervised learning focuses on network analysis of lymphocyte cell types with sparse inverse covariance estimation for ecological association inference (SPIEC-EASI) and dimension reduction with stepwise redundancy analysis (SRDA) [43, 44]. The supervised learning explores the association between health outcomes and lymphocyte cell types using a linear penalized log-contrast model. To facilitate the analysis, we substituted the smallest percentage of cell type in the dataset for 2883 participants with a subset cell value of 0%.
We used the SpiecEasi package to conduct a network analysis and examine the conditional dependence structure among the 16 subset cells. The method estimates an undirected, weighted network from compositional data using the covariance selection method (GLASSO) or neighborhood selection method (MB) [45]. In addition, we used the easyCODA package to identify a subset of pairwise logratios that can effectively capture the complete lymphocytes dataset [46]. Logratios are widely used when analyzing compositional data due to their subcompositional coherence property [45]. However, the extensive nature of the complete set of pairwise logratios presents a significant analytical challenge, necessitating a reduction in redundancy for practical application [44]. We analyzed 120 pairwise logratios constructed based on the 16 subset cells. In the first instance, we introduce all logratios and chose one of the logratios which would explain the highest percentage of the total variance. The second logratio that, independent from the chosen one, explained the largest percentage of variance was chosen from the remainder of the logratios, and the process iterated until 100% of the total variance was accounted for.
We conducted two sets of supervised learning analyses. First, we applied a linear penalized log-contrast model to examine the relationships between selected health outcomes and the 16 subset cells [47]. This model allows for both variable selection and estimation while accounting for the structure of compositional data. Variable selection was achieved by including a penalization term in the objective function. The tuning parameters were selected based on Bayesian information criterion (BIC) [48], and 95% confidence intervals were constructed using the bootstrap with 200 repetitions. Second, we used linear regression to assess the associations between selected health outcomes and selected logratio measures, which together capture 90% of the total variance in immune cell composition. For each health outcome, we fitted three models: (1) using either the 16 immune subset cells or the top logratio measures as predictors; (2) adjusting for age and gender; (3) further adjusting for race, education attainment, and CMV.
Comments (0)