2.1 Diagnosis criteria for Sarcopenia
This study adheres to the diagnostic criteria outlined by the Asian Working Group for Sarcopenia (AWGS) [2]. According to AWGS guidelines, sarcopenia is diagnosed based on low muscle mass accompanied by either low muscle strength or low physical performance. To quantify each diagnostic component, SMI, handgrip strength, and usual gait speed were measured (eFig. 1 in Online Resource 1). SMI was measured through multifrequency BIA using the InBody 770 (InBody, Seoul, South Korea) [47]. An SMI less than 7.0 kg/m² for males and less than 5.7 kg/m² for females was considered ‘low’. Handgrip strength was assessed using a digital handgrip dynamometer (T.K.K.5401; Takei Scientific Instruments Co., Ltd., Tokyo, Japan) [48]. The participants were asked to stand upright with their shoulders in a neutral position, arms at the sides with fully extended elbows. The handgrip strength at maximal power for both sides were averaged. A handgrip strength less than 28.0 kgf for males and less than 18.0 kgf for females was considered ‘low’. Gait speed was measured on the GAITRite Electronic Walkway (CIR Systems Inc., Peekskill, NY), a six-meter-long and 0.6-meter-wide walkway with pressure-activated sensors [49]. Participants were asked to walk on the GAITRite Electronic Walkway ten times barefoot at their usual walking speed. A gait speed lower than 100 cm/s was considered ‘low’ for both males and females. In the rest of the text, we denote the binary assessment of whether each diagnostic component is ‘low’ as\(\:\:\text\text}_\text\text},\:\text}_\text\text},\:\text\text\text}_\text\text}\), respectively. In other words, sarcopenia is expressed as
$$\:\text\text}_\text\text}\:\wedge\:\:\left(\text}_\text\text}\:\vee\:\:\text\text\text}_\text\text}\right),$$
(1)
where \(\:\vee\:\) denotes “logical or” and \(\:\wedge\:\) denotes “logical and”.
2.2 Details of population demographics
This study recruited participants at the outpatient clinic of the Department of Neurology at Wonju Severance Christian Hospital between July 2022 and October 2023. Patients who were 40 years and older, with no difficulty in walking, and were willing to participate in the study were recruited. Exclusion criteria included a previous diagnosis of idiopathic Parkinson’s disease, atypical parkinsonism, normal pressure hydrocephalus, severe cardiopulmonary diseases, cancer, osteoarthritis, or orthopedic diseases. A total of 199 patients, comprising 94 males and 105 females, were enrolled. Participants were categorized into two groups: the sarcopenia group (n = 40) and the healthy control group (n = 159), following the AWGS guidelines. Before the collection of data, all participants provided written informed consent. This study was conducted in accordance with the Declaration of Helsinki, and approved by the Institutional Review Board of the Yonsei University Wonju Severance Hospital (Ref# 2022-0234-001).
2.3 SMCS data collection protocol
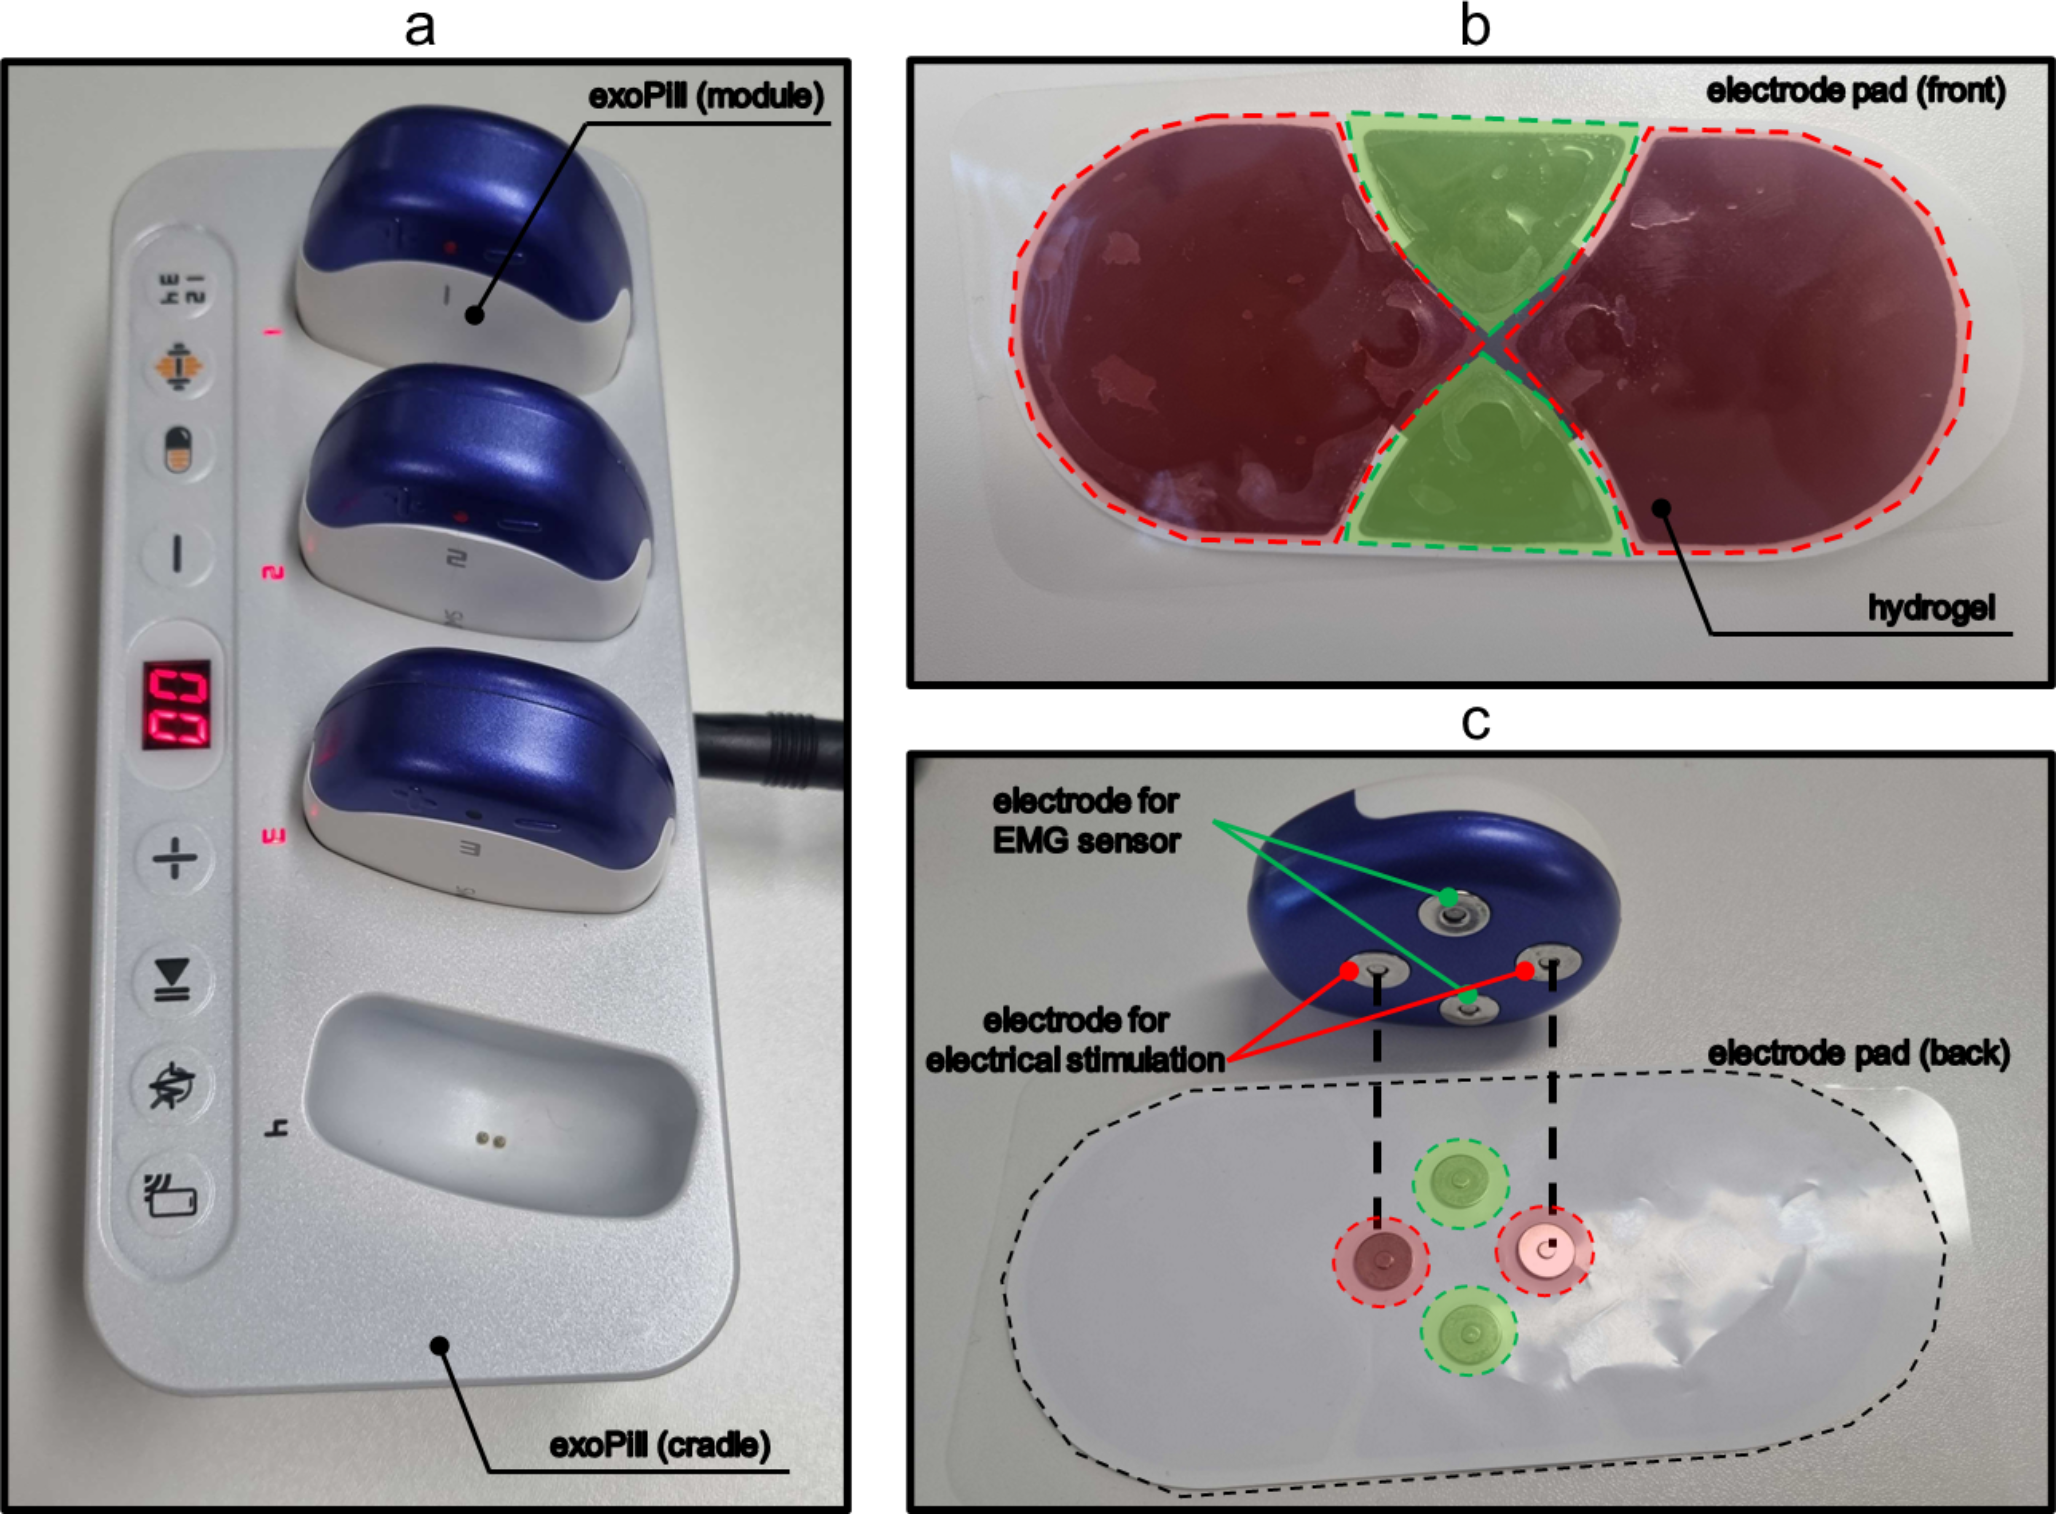
Figure 1 illustrates the exoPill, a wearable device developed by EXOSYSTEMS (Seongnam, Gyeonggi-do, Republic of Korea), capable of delivering electrical stimulation and simultaneously measuring sEMG. To facilitate the collection of SMCS, hydrogel electrodes were positioned over each of the left and right quadriceps femoris muscles, at mid-point of the rectus femoris muscle. Participants were instructed to sit upright in a chair with both feet flat on the floor with knees set at a 90-degree angle. They were also instructed to relax their muscles during the measurement as shown in eFig. 2 in Online Resource 1. In accordance with the protocol established in previous research [46], we adapted and modified the electrical stimulation parameters to enhance the analytical feature space. To be specific, the frequency range of electrical stimulation was extended from 10 Hz to 30 Hz, as previously used, to 5 Hz to 30 Hz in this study, aiming to capture a broader spectrum of muscle response data. We also explored a range of electrical stimulation intensities from 0.5 mA to 44.7 mA and determined that an intensity of 18.0 mA produced visible muscle twitches without causing discomfort to participants; thus, this setting was selected. Each electrical stimulation phase was applied for 8 s, followed by a 2-second rest period, resulting in total measurement time lasting 60 s.
2.4 Data collection hardware specification
The wearable device, exoPill, comprises one cradle and four modules. The cradle recharges the batteries in the modules and provides information on the availability of the modules. Each module is equipped with an EMG sensor and an integrated electrical stimulator. The modules are responsible for emitting electrical stimulation signals, which are generated based on stimulation parameters received from the user application. Each module contains custom-built circuits, four electrodes, a bi-colored light-emitting diode (LED), a battery, and charging pins. The entire circuitry is enclosed within a polycarbonate case with dimensions of 50 × 59 × 23 mm. Four magnetic electrodes, which couple to a hydrogel electrodes, are positioned beneath the module, slightly protruding from the case. One module weighs approximately 40 g with its charging pins exposed on the back and has one microcontroller in it.
The microcontroller (STM32L451CE, STMicroelectronics) in the modules communicates with a Bluetooth low-energy module (NRF52840, Nordic Semiconductor) through UART communication at a rate of 115,200 bps. This communication allows the module to receive commands from the user application, which is connected via Bluetooth 5.0 communication and operates the circuitry of each module. The circuitry can generate a pulse wave with a frequency ranging from 5 Hz to 100 Hz and a maximum peak-to-peak amplitude of 100 V (measured at a non-inductive resistor of 500 ohms). The EMG recording system with band-pass filtering from 17 Hz to 450 Hz and amplification with a gain of 1,100 were used to detect the sEMG. The microcontroller then measures the filtered signal at a rate of 1,000 samples per second through 12-bit analog-to-digital conversion, of which only the upper 8 bits are utilized. This approach helps to minimize the impact of minor EMG fluctuations due to unwanted voluntary contractions, allowing the focus to remain on the EMG signals generated by involuntary muscle contractions in response to electrical stimulation (SMCS). Details of hardware specifications of EMG sensors are provided in Table 1. Healthy individual and sarcopenia patient SMCS samples are provided in eFig. 3 in Online Resource 1. After processing, the signal gets transmitted to the user application. The device is powered by a lithium-ion polymer battery with a voltage of 3.7 V and a capacity of 250 mAh. The battery is charged at a DC voltage of 4.2 V with a charging current of 450 mA.
The hydrogel electrodes for collecting SMCS were StiMus Electrode developed by HUREV Corp (Wonju, Gangwon-do, Republic of Korea). Each electrode features a hydrogel contact surface component, measured 145 mm wide and 65 mm long, exhibiting a resistance of 50 Ω per 20 mm.
2.5 Proposed Sarcopenia diagnosis system
Figure 2 presents an overview of the proposed sarcopenia diagnosis system, which encompasses three main phases: data preprocessing, feature extraction, and binary classification model training. During the data preprocessing phase (Fig. 2a), SMCS data is segmented by each electrical stimulation frequency ranging from 5 Hz to 30 Hz. The raw sEMG signals captured by the wearable device were first amplified 1100 times using an amplifier configured with a 3.3 V single power supply, and a bias was applied before feeding the signal into the analog-to-digital converter. This step enabled the capture of motor unit responses with a potential difference of -1.5 mV to 1.5 mV. In this study, the 8-bit digitized data, with a resolution of 12 µV, was further normalized to a range of -1 to 1 for analysis, ensuring the baseline set to 0. This standardization ensures that subsequent analyses are conducted on data with consistent baselines and amplitudes, which is crucial for reliable feature extraction.
In the feature extraction phase (Fig. 2b), Muscle Contraction Pattern (MCP) features are systematically extracted from each segmented SMCS [46, 50]. This involves converting SMCS data into spectrograms using the Short Time Fourier Transform (STFT), with a window size of 64. Each electrical stimulation phase lasts for 8 s, and with a sampling rate of 1000 samples/sec, this results in a segment length of 8000 samples. Applying the STFT with the aforementioned parameters yields a spectrogram of size \(\:32\times\:125\), composed of 32 frequency bins. To capture the essential dynamics of muscle activity, two types of envelope signals are computed for each frequency bin by summing the positive peaks with their adjacent negative peaks and interpolating the gaps [50]. A bias elimination method is then applied to one type of the envelope signals to enhance the accuracy of the features. Autocorrelation is performed on these envelopes to derive the final MCP features, which effectively capture the repetitive patterns of muscle activation and are crucial for accurate sarcopenia diagnosis. Since this peak-based computation can shorten the envelope signal’s length to varying degrees, we selected a fixed length of 100 to ensure consistent operation across all collected data. Consequently, a \(\:32\times\:100\) autocorrelation features and \(\:32\times\:99\) slope features are created from each envelope signal. Given that there are two types of envelope for each electrical stimulation segment, combining across all 6 stimulation segments results in a total of 76,416 MCP features.
The model training phase (Fig. 2c) involves selecting features that demonstrate high relevance to the target, indicated by an AUC greater than 0.7. To reduce redundancy and enhance the model’s predictive power, the Minimum Redundancy Maximum Relevance (mRMR) algorithm is applied to these selected features [51]. A grid search is conducted to determine the optimal number of selected features, which was set at 64 from options of 32, 64, and 128 [52]. The refined features serve as inputs for three different models: a Multi-Layer Perceptron (MLP), a Support Vector Machine (SVM), and a Random Forest (RF).
To rigorously evaluate the performance of each classification model for \(\:\text\text}_\text\text}\), \(\:\text}_\text\text}\), and \(\:\text\text\text}_\text\text}\), a nested 3 × 2 cross-validation method is implemented [53, 54]. This method ensures that each fold of the SMCS dataset is utilized as training, validation, and test sets in rotation, promoting an even distribution across references. The models are trained using the training set, with the validation set employed for early stopping, and the test set providing the final verification. Performance metrics such as the AUC, accuracy, precision, sensitivity, specificity, and F1 score are calculated to assess the efficacy of the models across the different sarcopenia criteria. The final system’s sarcopenia diagnosis performance is evaluated using the outputs of these models, analyzing accuracy, precision, sensitivity, specificity, and F1 score.
Each MLP model, trained separately for each gender with specific diagnostic cutoffs for SMI and HG, comprises two hidden layers with 256 and 32 neurons respectively, and utilizes a dropout ratio of 0.5 to prevent overfitting [55]. The MLP models were trained using the Adam optimizer with a learning rate of 0.001, a batch size of 512, and up to 1500 epochs. Early stopping with a patience of 200 epochs was applied. The binary cross-entropy loss function was used for training, as it is well-suited for binary classification tasks. The activation function used in all hidden layers was Exponential Linear Unit (ELU).
For the SVM and RF models, the optimal parameter setting was selected based on those that empirically provided the best performance in our experiments. For each fold in the inner loop, SVM hyperparameters were selected from the following ranges: for regularization parameters, _\cdot\:_^),\:1/_\)}, for kernel coefficient, and for kernel type. \(\:_\) denotes number of selected features, and \(\:_^\) is the variance of selected features. For ‘poly’ kernels, the polynomial degree was chosen from . For RF, hyperparameters were selected from: maximum depth , minimum samples per leaf , minimum samples per split , and number of estimators . The selected optimal hyperparameters for each model are detailed in eTable 1 and eTable 2 in Online Resource 1.

Comments (0)