
Remember me
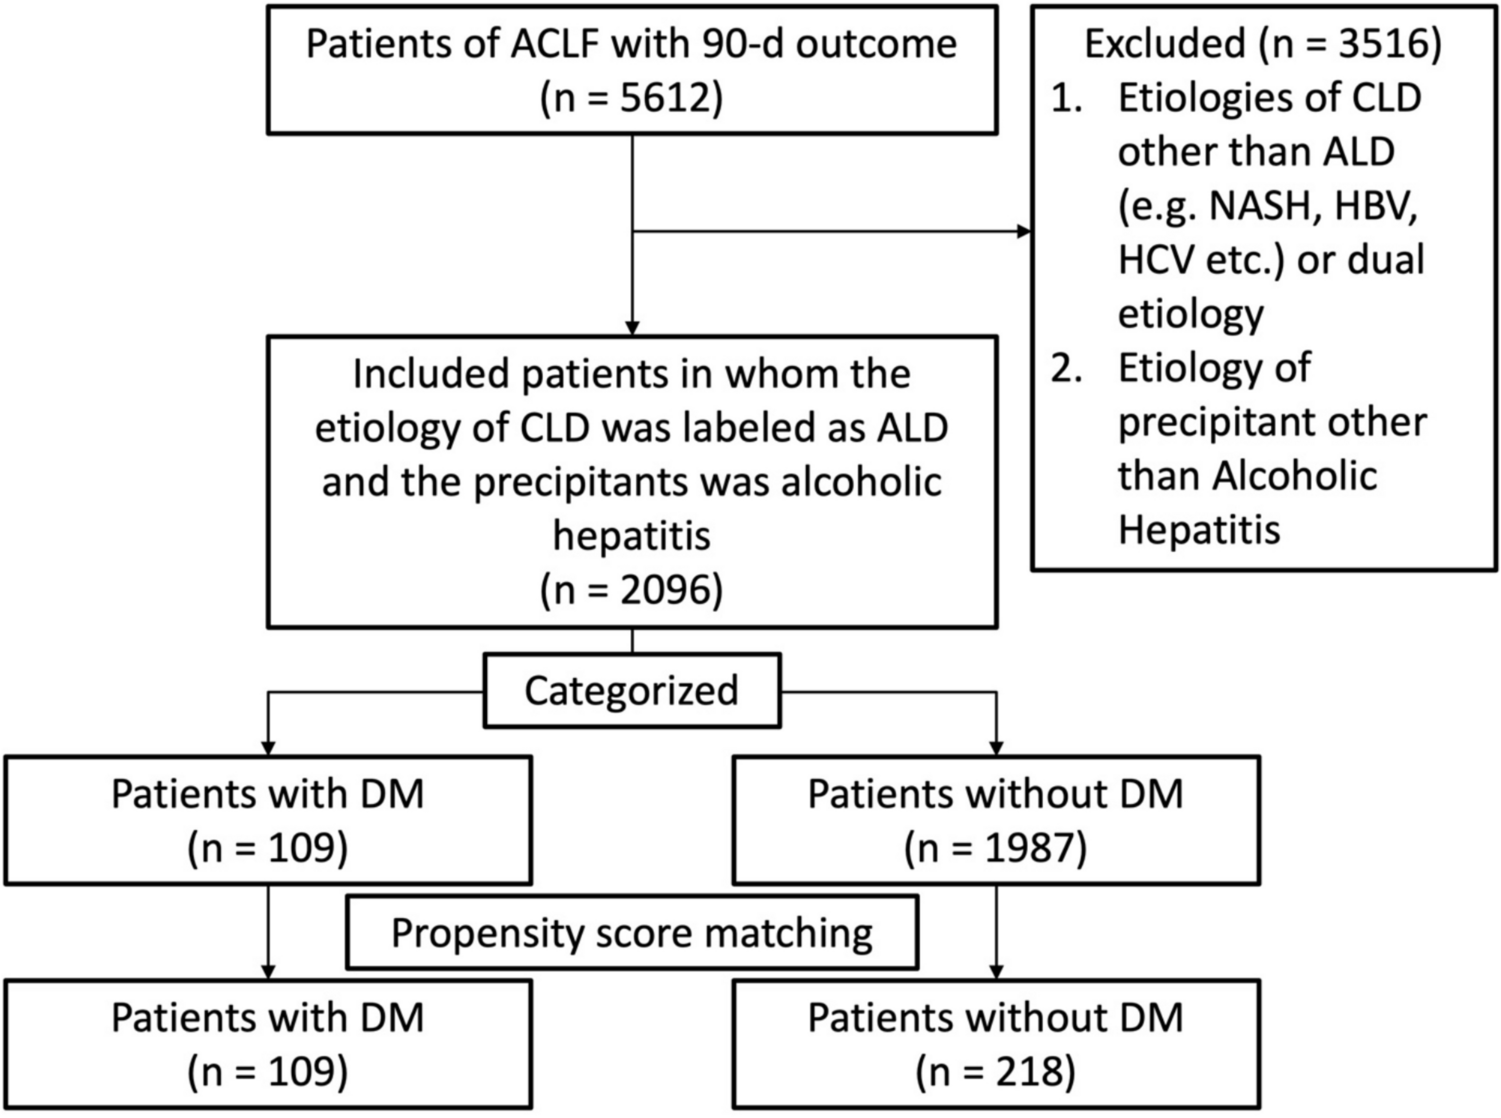
Online Resource 1, Table S1 presents the clinicopathological features of the SYSUCC cohort used to develop HDS, including the training cohort (n=360) and the validation cohort (n=90). There were no significant differences in baseline characteristics between the training and validation cohorts. Additionally, Online Resource 2, Table S2 provides the features of another 60 patients from SYSUCC, used for constructing a patch-level classification network. The patients in Table S2 have a similar distribution of clinicopathological features as those in Table S1. Furthermore, Online Resource 3, Table S3 details an external testing cohort of 341 patients from TCGA-LIHC. This cohort was not used during HDS development, allowing for an evaluation of HDS generalizability on unseen clinical data.
Model evaluation and survival analysisEnsuring the accurate classification of different tissue types by the patch-level classification network and the clinically meaningful localization of potential high-risk regions by ATAT are prerequisites for building an effective HDS. Online Resource 4, Fig. S1a shows that the average Area Under the Curve (AUC) across the six categories reached 0.98. Additionally, the confusion matrix in Fig. S1b further demonstrates the precision of the classification model in distinguishing between different tissue types. Further, ATAT has demonstrated a strong capability to distinguish between high- and low-risk patients (HR 2.77, 95% CI 2.04–3.74 in SYSUCC), as shown in Fig. S1c. It outperformed other state-of-the-art deep survival prediction models [14, 18, 25], achieving the c-index of 0.79 ± 0.035 (Fig. S1d). The series of findings related to high-risk patients in Fig. 1a are derived using ATAT. Since ATAT is a heuristic model and lacks clinical interpretability, we further designed a multi-view risk-scoring system and calculated HDS to enhance its clinical acceptability and applicability.
Fig. 2
The constructed independent risk factors and their combinations from the three individual perspectives included in HDS and their c-index for DFS in SYSUCC a and TCGA-LIHC b. The Kaplan–Meier survival curves of HDS for DFS c and OS d in training cohort and validation cohort e and f. MM microscopic morphological features, DG deep global features, CL co-localization features, HDS hybrid deep score, DFS disease-free survival, OS overall survival
Fig. 3
Kaplan–Meier curves for existing clinical staging systems and the refined stratification based on HDS in DFS and OS. a BCLC staging system, b HDS and c HDS-based refined stratification of BCLC stage 0-A of DFS in SYSUCC; d BCLC staging system, e HDS and f HDS-based refined stratification of BCLC stage 0-A of OS in SYSUCC; g TNM staging system, h HDS and i HDS-based refined stratification of TNM stage I&II of DFS in TCGA-LIHC; j TNM staging system, k HDS and l HDS-based refined stratification of TNM stage I&II of OS in TCGA-LIHC. BCLC Barcelona Clinic Liver Cancer, TNM American joint committee on cancer tumor node metastasis, HDS hybrid deep score, DFS disease-free survival, OS overall survival
In Fig. 2a, b, Online Resource 5 and 6 (Table S4a and S5a), we evaluated the c-indexes and 1-, 2-, and 5-year AUCs using single view or two of the three views of indicators (CL co-localization features, MM microscopic morphological features, DG deep global features & means concatenate two types of features) on SYSUCC and TCGA-LIHC. The experimental results demonstrate that combining any two types of features can further improve prognostic performance compared to using a single indicator alone. For instance, combining MM and DG resulted in a 20% increase in the c-index on SYSUCC compared to MM. Finally, integrating all three perspectives as HDS achieved more competitive performance (the AUCs of HDS for the 1-, 2-, and 5-year predictions and c-index of DFS were 0.682±0.183, 0.724±0.117 0.767±0.138 and 0.751±0.082 in SYSUCC and 0.678±0.238, 0.735±0.219, 0.723±0.130 and 0.729±0.196 in TCGA-LIHC). Furthermore, we have provided the results of the multivariable analysis of these three indicators of DFS on SYSUCC and TCGA-LIHC in Table S4b and Table S5b, and the multivariable analysis confirms that these three factors are independent prognostic risk factors (with multivariable \(p<\)0.001). Additionally, Table S4c and Table S5c present the pairwise \(\mathcal ^\) test results for these three indicators on the two datasets and the \(\mathcal ^\) \(p>\)0.05 indicate that the features from these three perspectives are mutually independent.
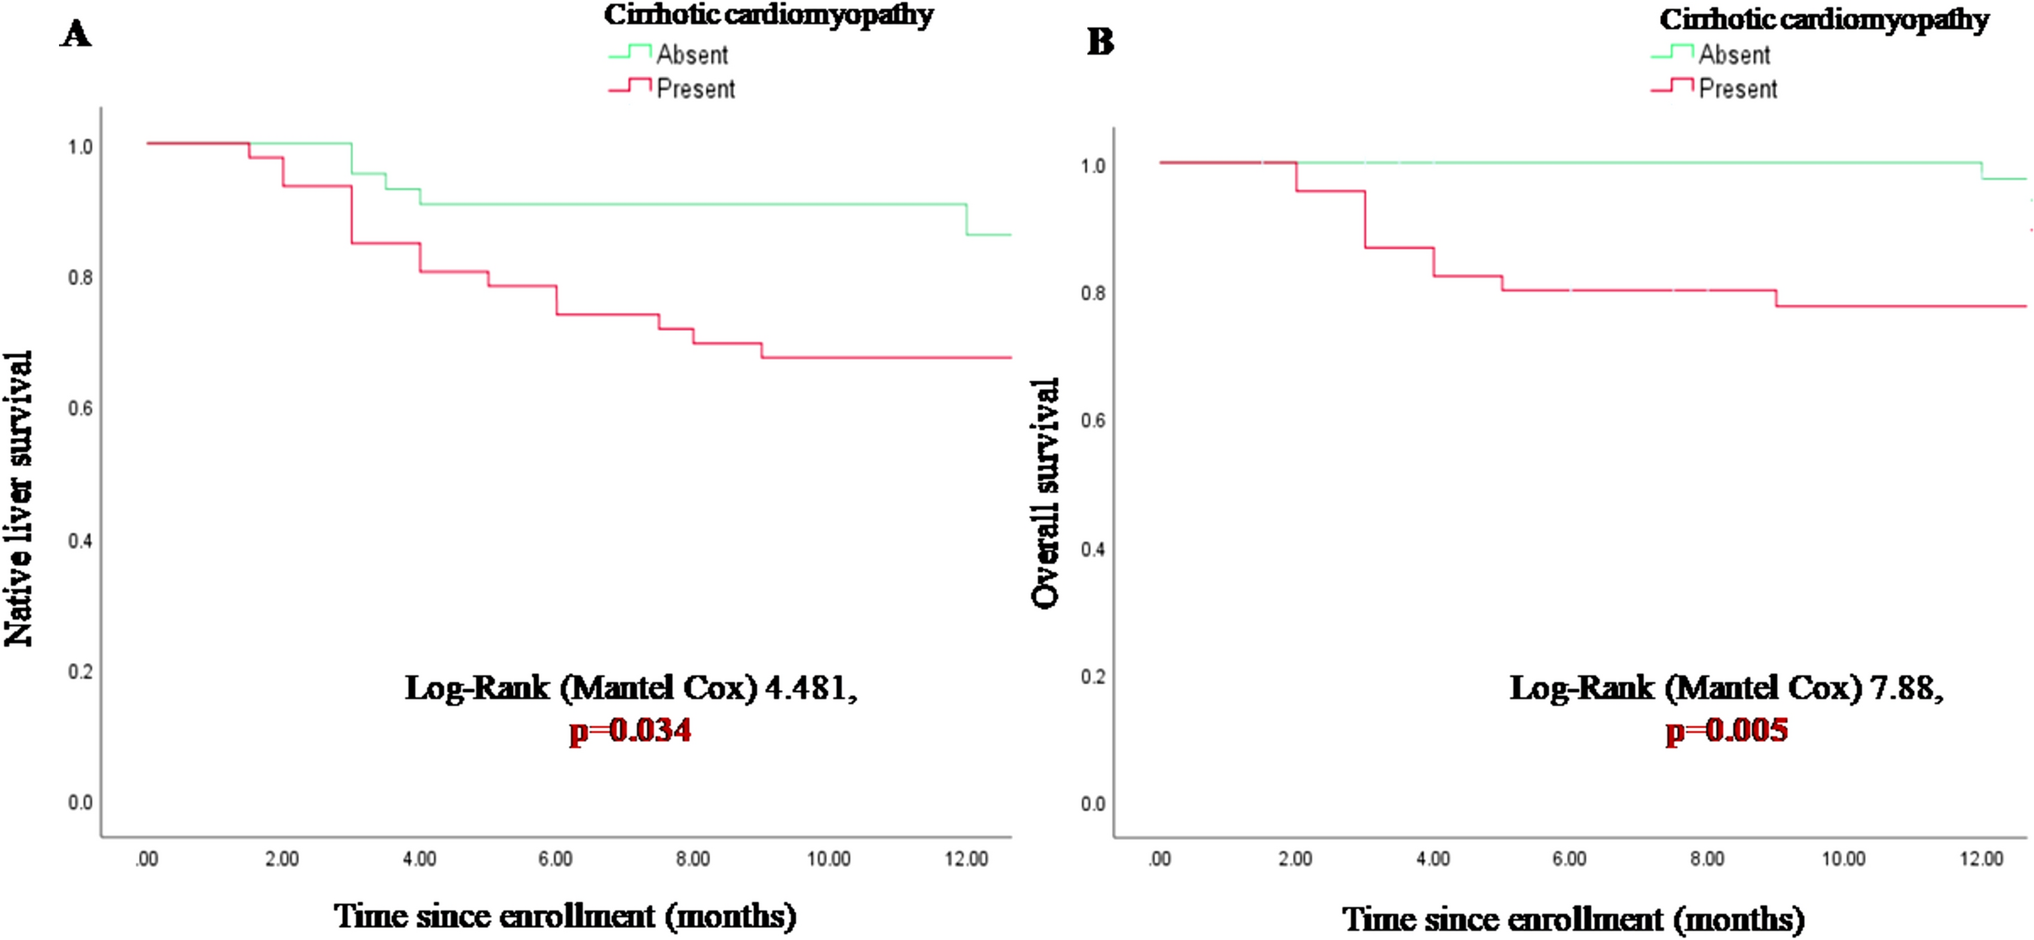
For HDS, the median value of the training cohort was taken as the cut-off value of high- and low-risk groups. Patients with a lower HDS experienced longer DFS and OS durations across both training and validation cohorts. Generally, as shown in Fig. 2c–f, the 2-year DFS rate in the high-risk group reached 26.79% in the training cohort and 16.22% in the validation cohort, compared to the low-risk group with DFS rates of 70.69% and 66.21% in the training and validation cohorts, respectively. Additionally, using OS as a secondary endpoint, HDS also effectively differentiated between high- and low-risk groups: the 2-year OS rate in the high-risk group was 69.24% in the training cohort and 60.31% in the validation cohort, compared to 87.21% and 86.49% in the low-risk group. In long-term (5-year) DFS and OS, HDS also demonstrated similarly superior risk stratification capabilities as seen in the short-term (1-/2-year) analysis.
Kaplan–Meier curves were constructed in Fig. 3 to illustrate the role of HDS in survival risk stratification. Building upon the existing BCLC and TNM staging systems, we further stratified the low-risk subgroups based on HDS. As shown in Fig. 3c, f, i, l, the p values between low-risk group with high HDS v.s. the low-risk group with low HDS were all less than 0.001 for both DFS and OS. This indicates that HDS can effectively identify potential high-risk patients within the low-risk groups, enabling clinicians to provide enhanced monitoring for these patients.
Additionally, in Online Resource 7, Table S6, we evaluated the prognostic performance of combining the existing clinical staging systems with HDS (use the linear combination of HDS and clinical staging as input for the Cox model). The results demonstrated that the combination of BCLC/TNM staging systems with HDS consistently achieved the best performance across both datasets (c-index: 0.783±0.110 in SYSUCC, 0.747±0.091 in TCGA-LIHC; 1-year AUC: 0.701±0.045 in SYSUCC, 0.681±0.060 in TCGA-LIHC; 2-year AUC: 0.739±0.213 in SYSUCC, 0.741±0.073 in TCGA-LIHC and 5-year AUC: 0.772±0.224 in SYSUCC, 0.740±0.208 in TCGA-LIHC). This further highlights the complementary role of HDS in improving the prognostic accuracy of existing clinical staging systems.
Prognostic risk factors of HDSCox proportional hazards regression analysis was conducted to identify independent predictors for DFS in SYSUCC (Online Resource 8, Table S7) and TCGA-LIHC (Online Resource 9, Table S8). Since the known clinicopathological factors differed between the two cohorts, each was considered separately in the univariate Cox analysis. Subsequently, multivariable analysis revealed that tumor size (HR 3.275, 95% CI 2.053–5.219), tumor number (HR 1.541, 95% CI 1.326–4.358), and HDS (HR 3.852, 95% CI 2.333–5.319) were independent risk factors for DFS in SYSUCC, while in TCGA-LIHC, depth of invasion (HR 2.214, 95% CI 1.6–3.064) and HDS (HR 2.449, 95% CI 1.797–5.312) were identified as independent risk factors for DFS.
Fig. 4
a Nomogram of independent clinical risk factors and HDS for DFS in SYSUCC. b C-indexes of independent CF, BCLC stage, HDS, and BCLC/HDS combined CF in SYSUCC. c C-indexes of independent CF, TNM stage, HDS, and TNM/HDS combined CF in TCGA-LIHC. CF clinical risk factors, BCLC Barcelona Clinic Liver Cancer, TNM American joint committee on cancer tumor node metastasis, HDS hybrid deep score, DFS disease-free survival
To incorporate these independent clinical risk factors (“Number of lesions" and “diameter of tumor") from the multivariable analysis, the nomogram was constructed for DFS in the SYSUCC cohort (Fig. 4a). Additionally, Fig. 4b presents the c-indexes for approaches considering only these clinical features, BCLC staging, and HDS. Notably, HDS achieved competitive performance (0.747, 0.711–0.783), and the integration of HDS with clinical features led to the improvement in predictive performance (with a 4.1% increase). In Fig. 4c, the combination of HDS with clinical features also demonstrated enhanced performance in TCGA-LIHC (showing a 2.87% increase). These results present the complementarity of HDS with clinical factors, offering valuable insights for augmenting and refining survival prediction methods based on existing clinical features.
Fig. 5
Forest plot of HDS for DFS in SYSUCC. AFP alpha-fetoprotein, DFS disease-free survival
The forest plot in Fig. 5 demonstrates that after stratifying the SYSUCC into different subgroups based on clinical characteristics, HDS remained an effective predictor for DFS with p < 0.05 in each subgroup. Similarly, the forest plot in Online Resource 10, Fig. S2 for the TCGA-LIHC cohort confirmed that HDS serves as a prognostic factor across all clinical subgroups.
Comments (0)