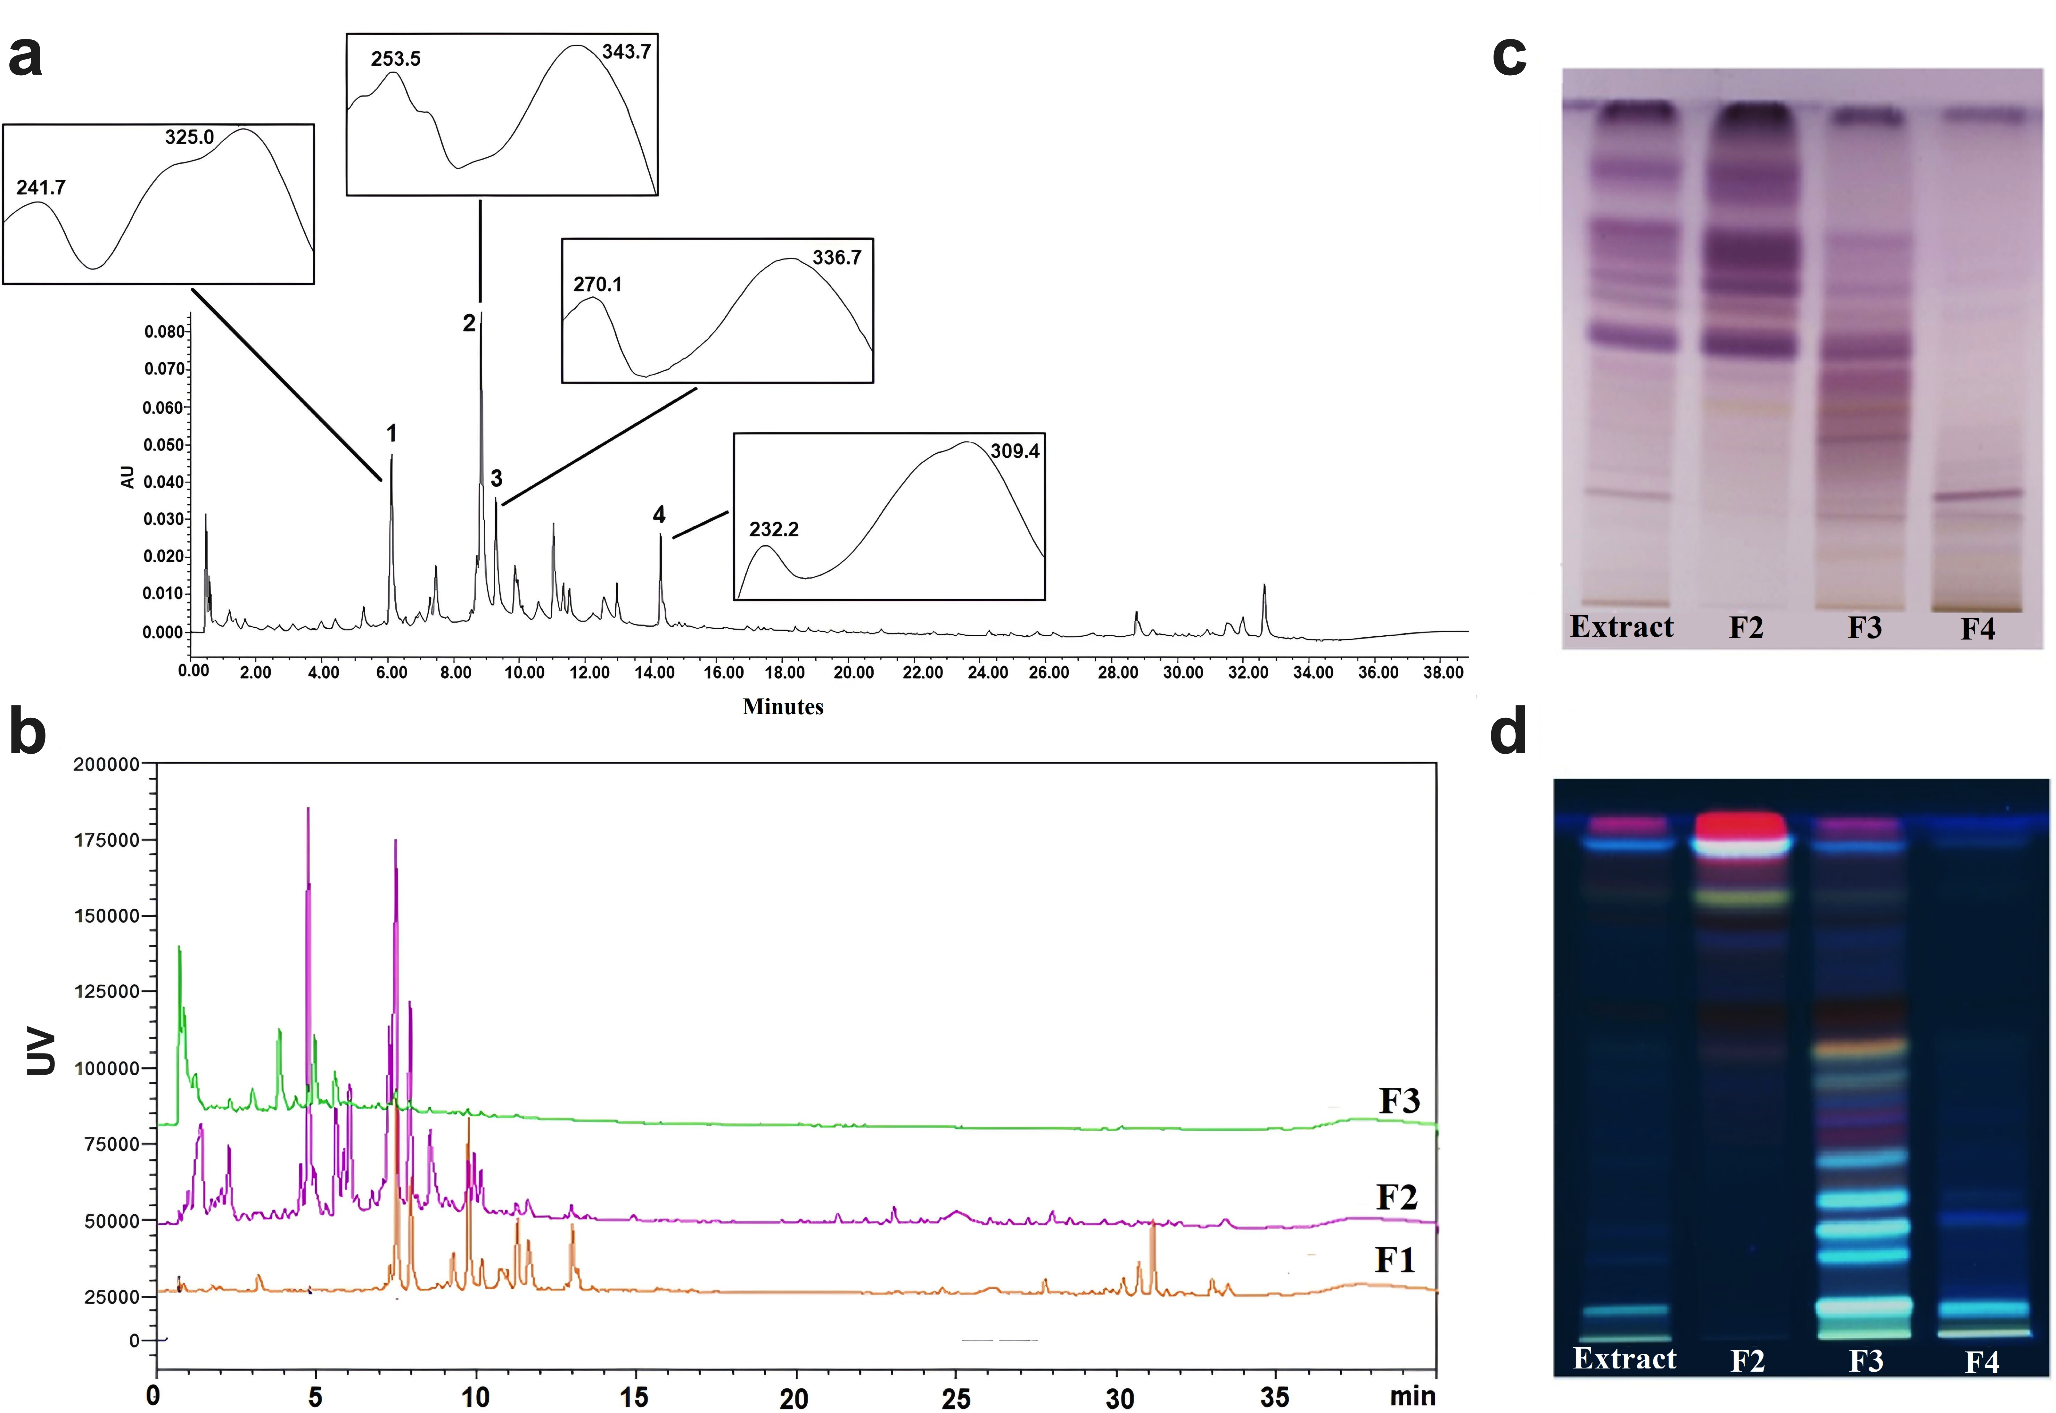
Preparation of plant material and compound
Roots of Ononis spinosa L. were purchased from Caesar and Loretz Hilden, Germany. The powdered root material (250 g) was extracted in a Soxhelt apparatus for 4 h with 2 L of dichloromethane. The dichloromethane extract of 10.0 g was dissolved in petroleum ether, and activated charcoal was added and filtered. The filtrate yielded crystals after evaporation. Approximately 5 mg of crystals were obtained and the identification of alpha-onocerin in these crystals was achieved by GC-MS analysis.
Chemicals and drugs
Sodium chloride (0.9%) manufactured by Atlantic Life Science, artesunate (30 mg Combi Pack) manufactured by India Bharat Parental Ltd., aspirin (250 mg), indomethacin (500 mg), paracetamol (500 mg), and methanol (1 L) were obtained from Ernest Chemist Limited, Santasi Roundabout, Kumasi. Immersion oils (500 ml), microscope slides (frosted), vacuum tubes (1–5 ml), Syringes (1–5 ml), acetic acid (100 ml) and 10% Giemsa stain were obtained from Diacon Medical Laboratory Diagnostics, Bantama-Kumasi.
Experimental animals
ICR mice (18–29 g) of both sexes were used for the experiment. These animals were obtained from the Animal House of the Department of Pharmacology, KNUST. The animals were allowed to acclimatize for a week before every experiment and were given free access to feed and water ad libitum. All experimental animals were housed in aluminium laboratory cages (34 × 47 × 18 cm) with wood shaving as bedding and maintained under standard laboratory conditions of 12 h light/dark cycles, a mean temperature of 22 ± 2 °C and 41 ± 4% humidity. All procedures and techniques in the care of these animals were in line with National Institute of Health Guidelines for the Care and Use of Laboratory Animals (1985).
Rodent parasite
Fresh frozen parasitized erythrocytes containing Plasmodium berghei (ANKA) strains were purchased from the Noguchi Memorial Institute for Medical Research, University of Ghana, Legon and kept in the research laboratory of the Department of Pharmacology, Kwame Nkrumah University of Science and Technology (KNUST), Kumasi, Ghana.
Acute toxicity
Twenty (20) ICR mice (18–25 g) were randomized into four groups (n = 5). One group served as control and received 1 ml of normal saline and the remaining three groups received 30, 100, and 300 mg/kg of alpha-onocerin. The mice were placed in their respective motor activity cages. The motor activities of these mice were monitored and scored at 15-, 30-, 50- and 90-min intervals except for the analgesic activities. The analgesic effects were also monitored using the tail pinch method. Animals were kept and monitored for signs of toxicity after 24 h (Baah et al. 2020).
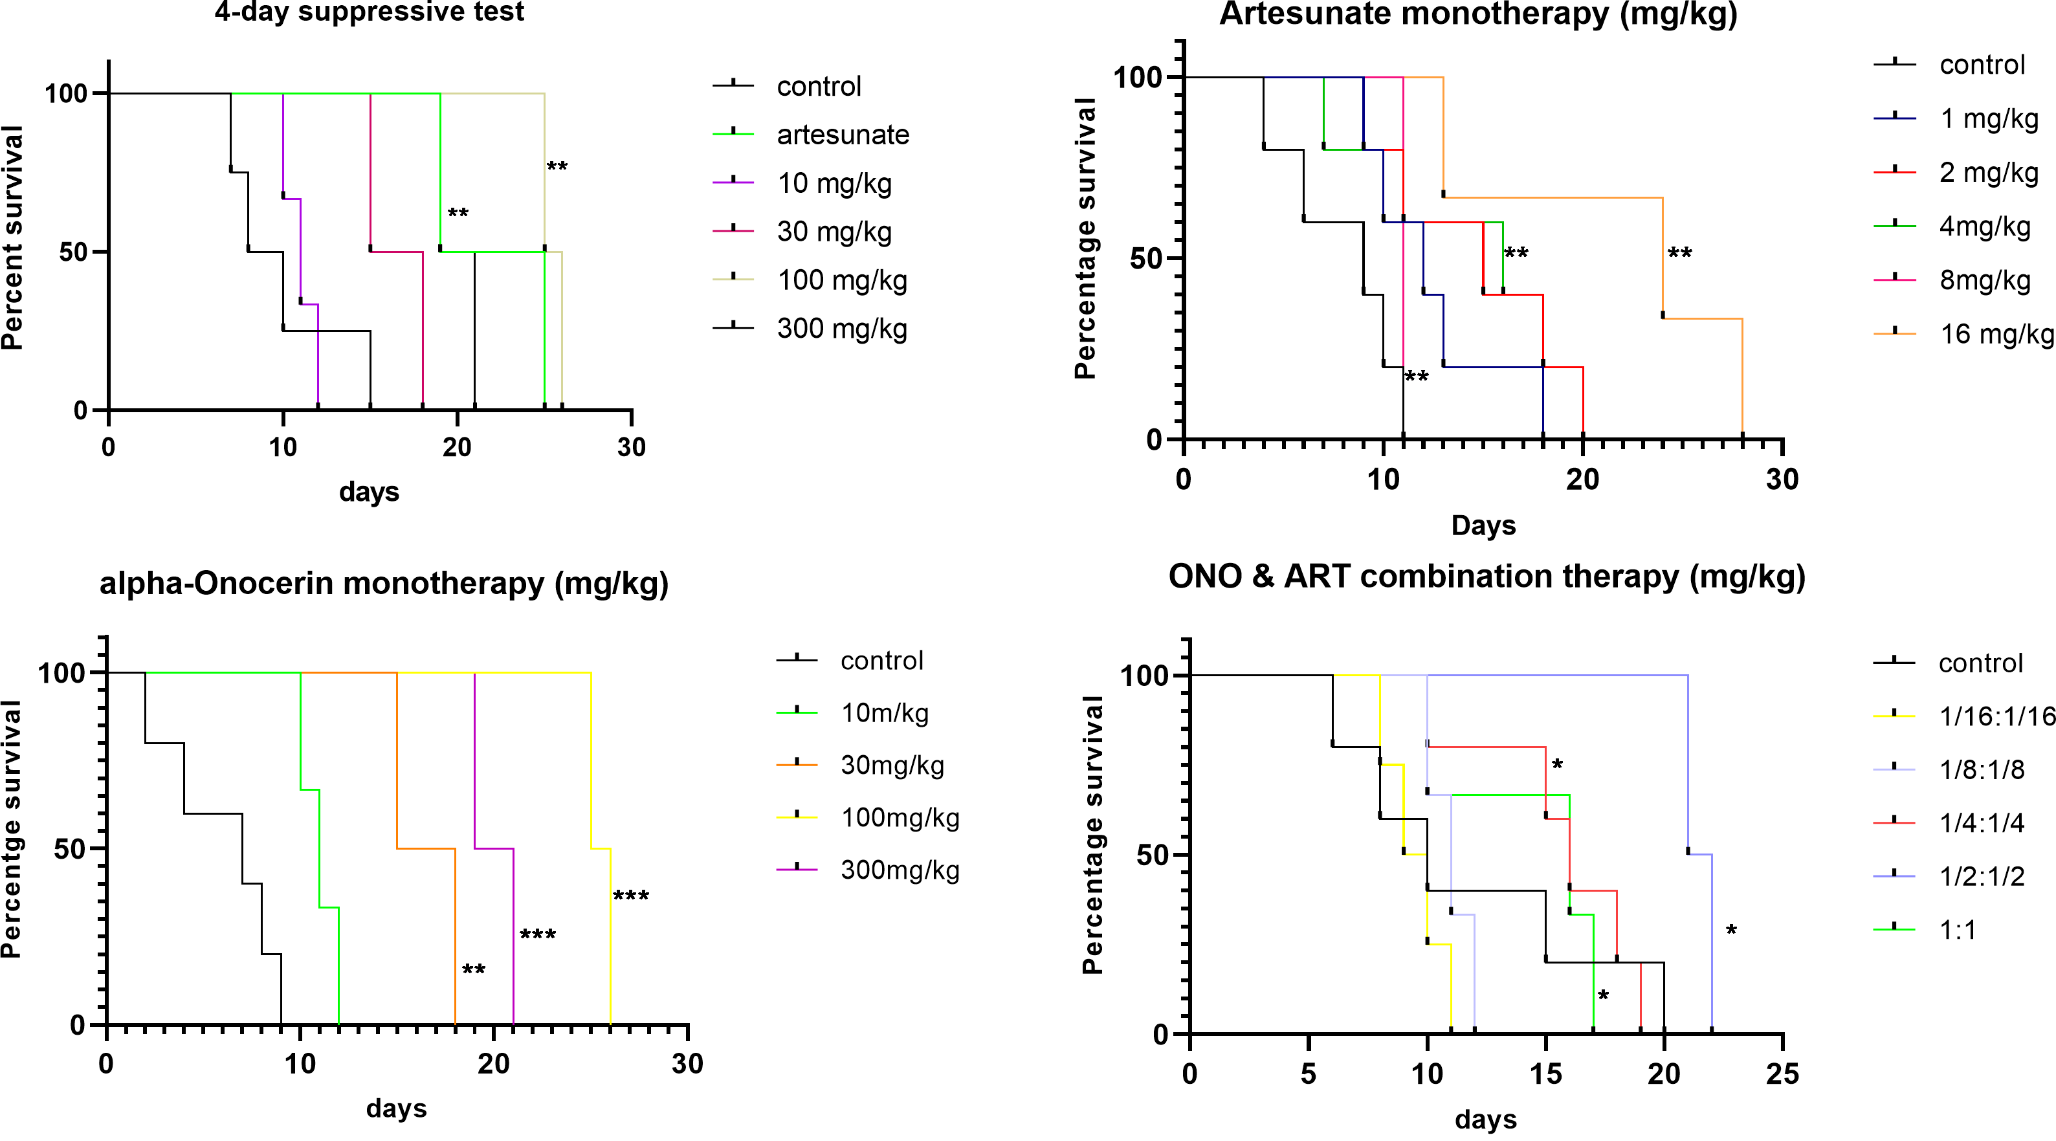
Four-day suppressive test
The in vivo antimalarial activity of alpha-onocerin was assessed using the 4-day suppressive test as described previously (Belay et al. 2018). Thirty (30) ICR mice of both sexes (18–29 g) were divided into six groups (n = 5) and injected intraperitoneally (i.p.) with 0.2 ml of saline suspension of parasitized erythrocytes. Three hours after inoculation with parasitized erythrocytes, the mice in their groups were treated as follows:
Group I: received 1 ml of 0.9% sodium chloride solution (negative control, i.p.) for 4 days,
Group II: received artesunate (2 mg/kg, i.p.) for 4 days,
Group III: received 10 mg/kg of alpha-onocerin (i.p.) for 4 days,
Group IV received 30 mg/kg of alpha-onocerin (i.p.) for 4 days,
Group V: received 100 mg/kg of alpha-onocerin (i.p.) for 4 days and.
Group VI: received 300 mg/kg of alpha-onocerin (i.p.) for 4 days.
On the fifth day, 24 h after the last doses were administered, thin blood smears were made from the tail of each mouse, fixed with methanol and stained with 10% Giemsa stain. The parasitemia level was determined by counting the number of parasitized erythrocytes out of 100 erythrocytes in 8 random fields of microscopic view.
Anti-plasmodial curative test
This test evaluated the schizontocidal activity of alpha-onocerin and artesunate (as a reference drug) in an established malaria infection. The test procedure was carried out according to the methods of Okokon et al. (2017). A volume of 0.2 ml of parasitized erythrocytes, which contained 1 × 10⁷ cell/mm3 of Plasmodium berghei (ANKA) strains, were intraperitoneally infected into thirty (30) ICR mice with weights between 18 g and 25 g on the first day. Three days infecting with P. berghei parasites, the mice were randomly divided into six groups (n = 5) as follows:
Group I: received 10 ml/kg (i.p.) of phosphate buffered normal saline (negative control) once daily for 7 days,
Group II: received 5 mg/kg (i.p.) artesunate (positive control) for 7 days,
Group III: received 10 mg/kg of alpha-onocerin (i.p.) for 7 days,
Group IV received 30 mg/kg of alpha-onocerin (i.p.) for 7 days,
Group V: received 100 mg/kg of alpha-onocerin (i.p.) for 7 days and.
Group VI: received 300 mg/kg of alpha-onocerin (i.p.) for 7 days.
Giemsa-stained thin smears were prepared using the tail blood collected on microscopic slides for analysis. These blood samples were collected each day of treatment in order to monitor the parasitemia levels (Okokon et al. 2017).
Prophylactic anti-plasmodial test
The repository activity of the compound (alpha-onocerin) and artesunate was assessed using the methods described previously (Belay et al. 2018; Okokon et al. 2017). Thirty (30) ICR mice weighing 18–25 g were randomly divided into six groups (n = 5) and treated as follows:
Group I: received 10 ml/kg (i.p.) of phosphate buffered normal saline (negative control) once daily for 3 days,
Group II: received 5 mg/kg (i.p.) artesunate (positive control) for 3 days,
Group III: received 10 mg/kg of alpha-onocerin (i.p.) for 3 days,
Group IV received 30 mg/kg of alpha-onocerin (i.p.) for 3 days,
Group V: received 100 mg/kg of alpha-onocerin (i.p.) for 3 days and.
Group VI: received 300 mg/kg of alpha-onocerin (i.p.) for 3 days.
On the fourth day, the mice were all inoculated with 0.2 ml of parasitized RBCs which contained 1 × 10⁷ cells/mm3 of Plasmodium berghei (ANKA) strains. The parasitemia level of each mouse was assessed by taking a tail blood smear on a microscope slide. Thin films of blood smears were prepared and stained with 10% Giemsa. The slides were prepared 72 h post-Plasmodium berghei infection and viewed under the microscope. Parasitemia was evaluated as follows, using the equation:
$$\% Parasitemia = \frac}}\,x\,100$$
Average chemosuppression was calculated as:
$$\% Mean}parasitemia = \left[ }} \right]\,x\,100,$$
Where A is the average percentage parasitemia in the negative control and B is the average percentage parasites.
Packed cell volume and body weight measurements
As described previously (Osei et al. 2021) the packed cell volume (PCV) was measured to predict the effectiveness of the test compound in preventing hemolysis resulting from increased parasitemia. Heparinized capillary tubes were used to collect blood from the tail of each mouse. The capillary tubes were filled with blood up to 3/4th of their volume and sealed at the dry end with sealing clay. The tubes were then placed in a micro-hematocrit centrifuge with the sealed end outwards and centrifuged at 12,000 rpm for 5 min. The tubes were then taken out of the centrifuge and PCV was determined using a standard micro-hematocrit reader. Measurement of PCV was carried out before inoculating the parasite and after treatment. PCV which is a measure of the proportion of RBCs to plasma was calculated using the following relationship:
$$PCV = \frac}in}a}given}volume}of}blood}}}blood}volume}}$$
The body temperature of each mouse was determined before infection on day 0 and after treatment on day 4 (in the 4-day suppressive test), using a digital thermometer to assess changes in temperature due to the infection. The body weights of mice were also taken before the start of each experiment and at the end of some experiments, as described. The weights were taken using a top-pan balance (Baah et al. 2020).
10 Mean Survival Time
In both suppressive and curative assay models, mortality was monitored and the number of days from the time of inoculation of the parasite up to death was recorded for each mouse in the treatment and control groups for 30 days (Fentahun et al. 2017). The mean survival time (MST) for each group was then calculated as follows:
$$\:MST = \frac \right)}}}$$
In vivo anti-plasmodial interaction assay
The ED50 of both artesunate and alpha-onocerin was estimated using the model described previously (Tallarida 2011). Briefly, 0.2 ml of prepared parasitized erythrocytes were inoculated into 50 mice. These 50 mice were randomly assigned to one of 10 groups (n = 5). These groups were the negative control group (normal saline), the positive control groups (1, 2, 4, 8, 16 mg/kg of artesunate) and the test groups (10, 30, 100 and 300 of alpha-onocerin). After 72 h post-parasite inoculation, all 50 mice were given their various drug doses as described above for five consecutive days. On each day of treatment, blood smears were collected and monitored for parasitemia levels under the microscope. To obtain the combination potency of co-administered alpha-onocerin and artesunate drug samples, the two drugs were assayed for their anti-malarial activity with methods (Osei et al. 2021). The ED50s of both alpha-onocerin and artesunate were combined in fixed ratios of 1:1, 1/2: 1/2, 1/4: 1/4, 1/8: 1/8 and 1/16: 1/16. The ED50s from the combination fractions (Zexp) were determined. Furthermore, the type of interaction existing between the co-administered substances was determined by drawing an isobologram consisting of alpha-onocerin (ED50s) on the x-axis and artesunate (ED50s) on the y-axis. Thus, the Zexp was plotted and compared to the Zadd to determine the kind of interaction between artesunate and alpha-onocerin.
Antipyretic effect of alpha-onocerin
The antipyretic effect of alpha-onocerin was evaluated using procedures as described by Baah et al. (2020). Thirty (30) mice were randomly assigned into six groups (n = 5). The mice were denied feed but allowed free access to water. The baseline rectal temperatures were taken before the administration of yeast solution (20% w/v) at 10 mg/kg i.p. The anal temperatures of each animal in their respective groups were measured 3 h post-pyrexia induction and mice showing a rise in temperature at least 1 °F (0.6 °C) above the baseline were used for the study. The animals were then kept in six groups (n = 5) and treated with four doses of alpha-onocerin (10, 30, 100 and 300), paracetamol (200 mg/kg), or normal saline (10 ml/kg) orally. Rectal temperatures were recorded every hour for up to 3 h after the various drug administrations (Baah et al. 2020).
Statistical analysis
The data generated were analyzed using GraphPad Prism 8.4.2, and the results were expressed as mean ± standard error of mean (SEM). Each sample was run in triplicate. An analysis of variance (ANOVA) followed by Tukey’s multiple comparisons test was used to compare treated groups with the control group. Values were considered significant at p < 0.05. A two-way ANOVA, followed by Bonferroni’s multiple comparison tests for suppressive and curative tests, was employed. An isobologram, which consists of the ED50 of alpha-onocerin on the x-axis and the ED50 of artesunate on the y-axis, joined with a line of additivity, was constructed. The ED50s of the drugs were determined using linear regression analysis of the log dose-response curves. A t-test comparison of Zexp to the theoretical additive ED50, i.e., Zadd was computed. The Zadd was computed with the formula:
$$} = }}\left( f \right)ED50}of\,ART + \left( \right)}ED50}of\,alpha - onocerin$$
Where f is the fraction of each component in the mixture while Var (variance of Zadd) was also computed as: Var (Zadd) = f2 (VarED50 of alpha-onocerin) + (1-f) VarED50 of ART).


Comments (0)