
Remember me
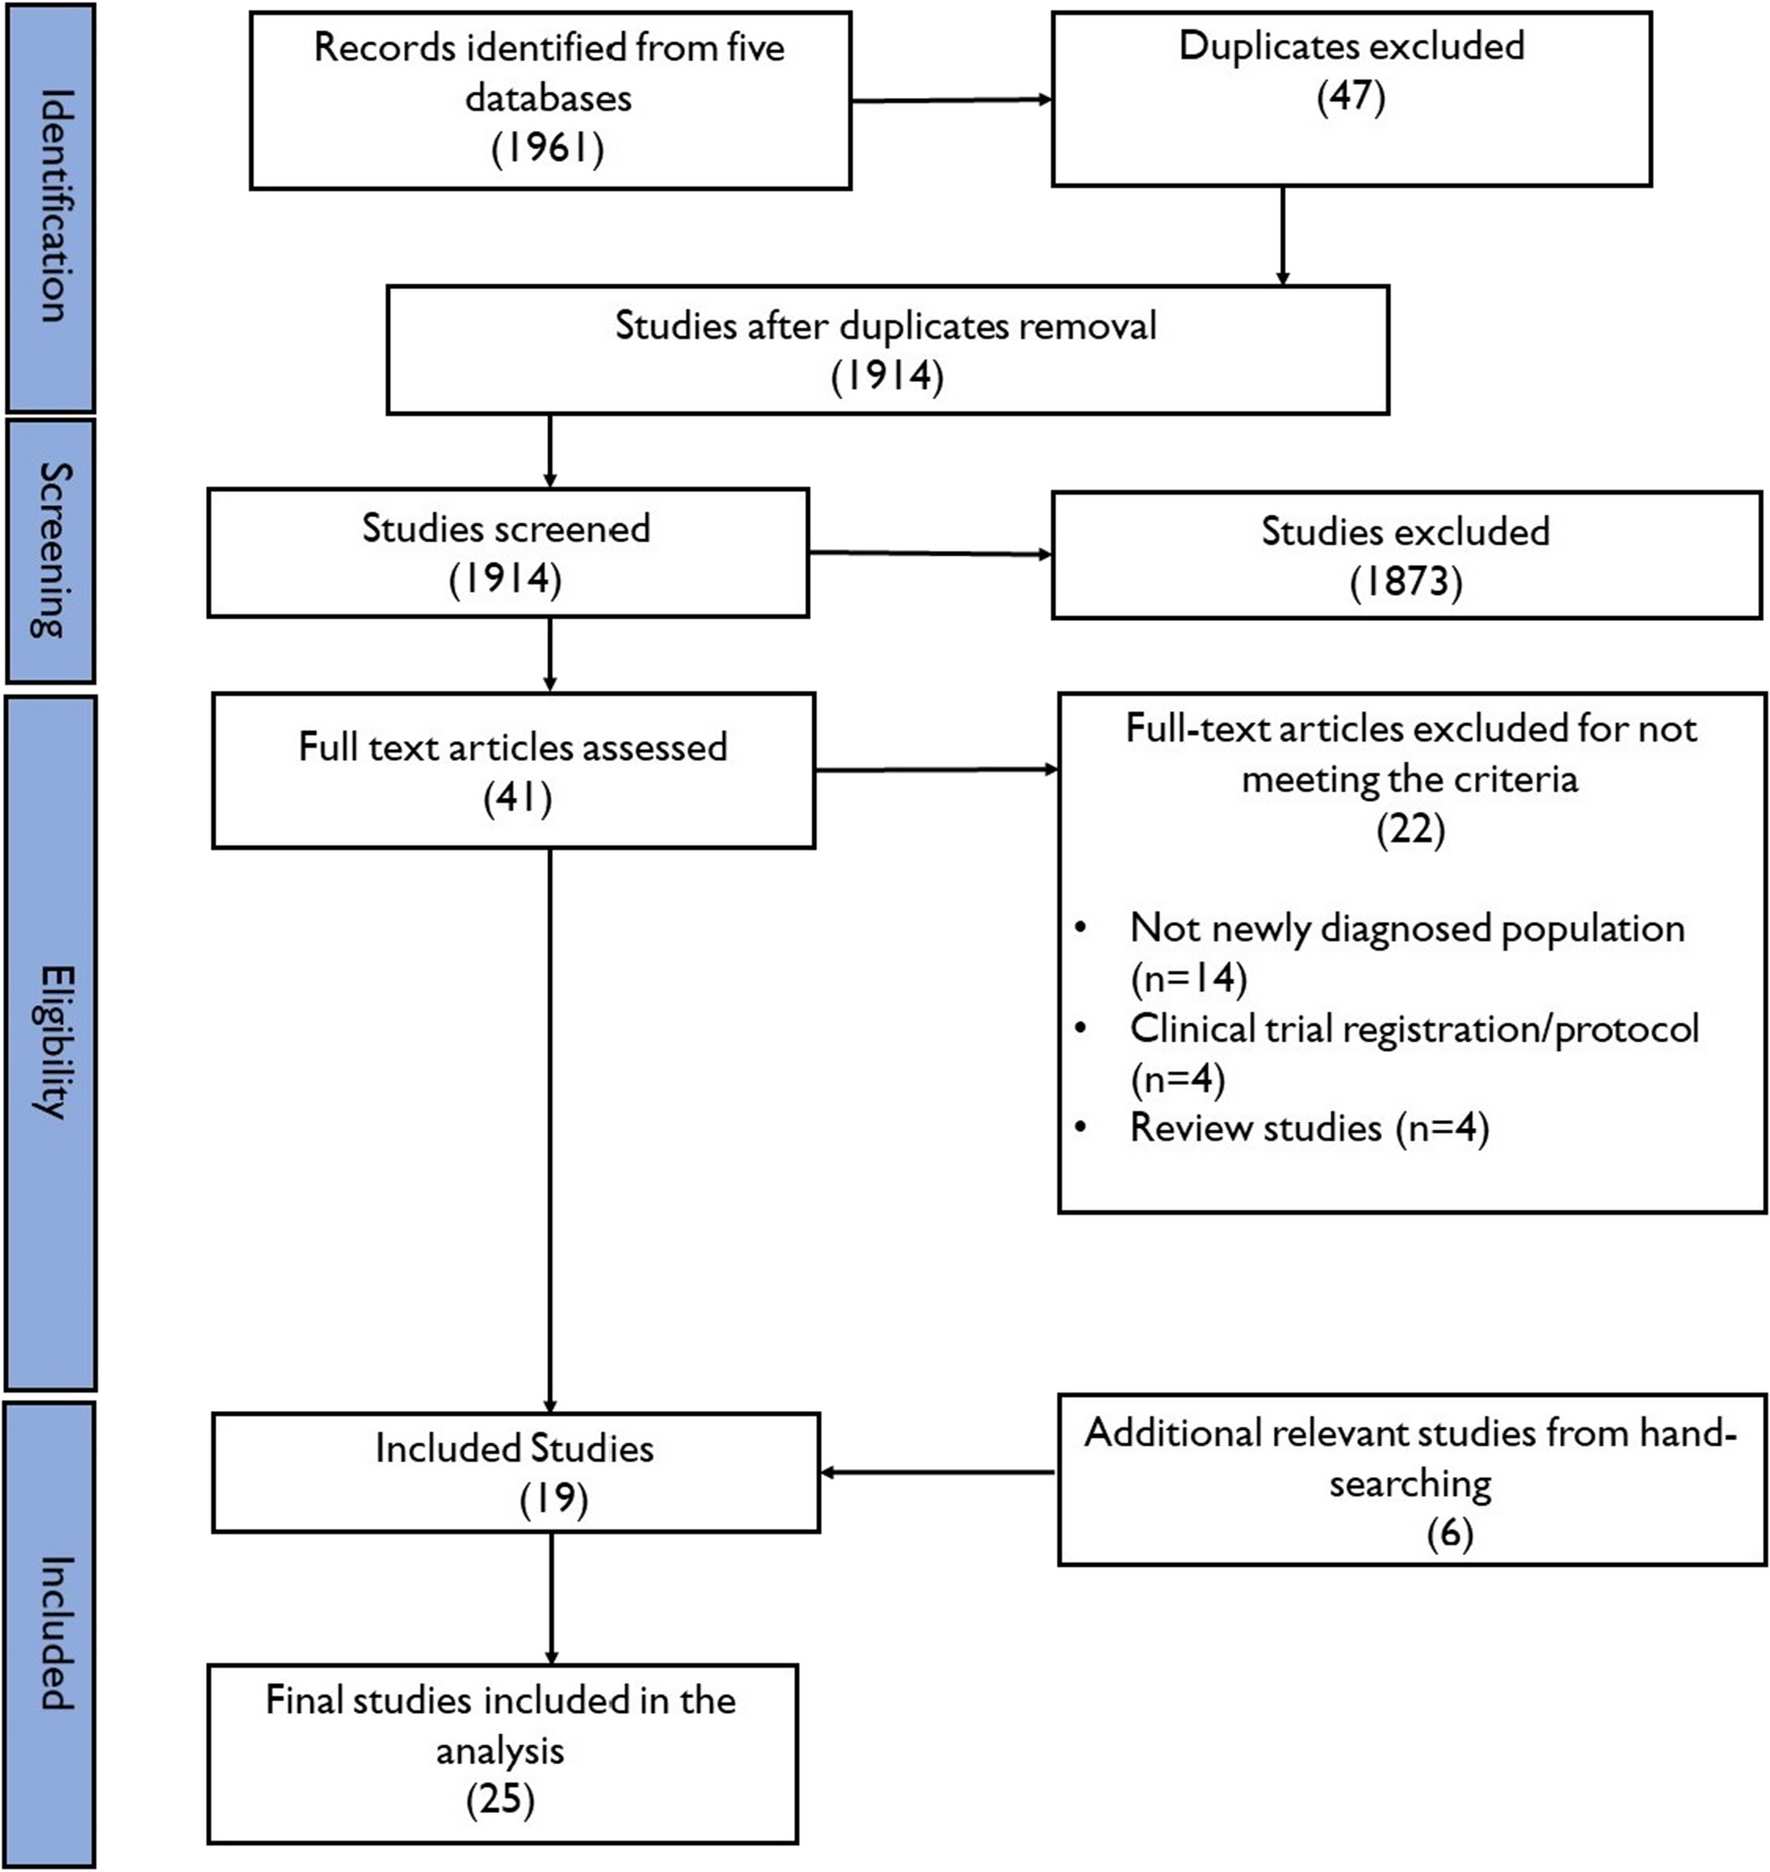

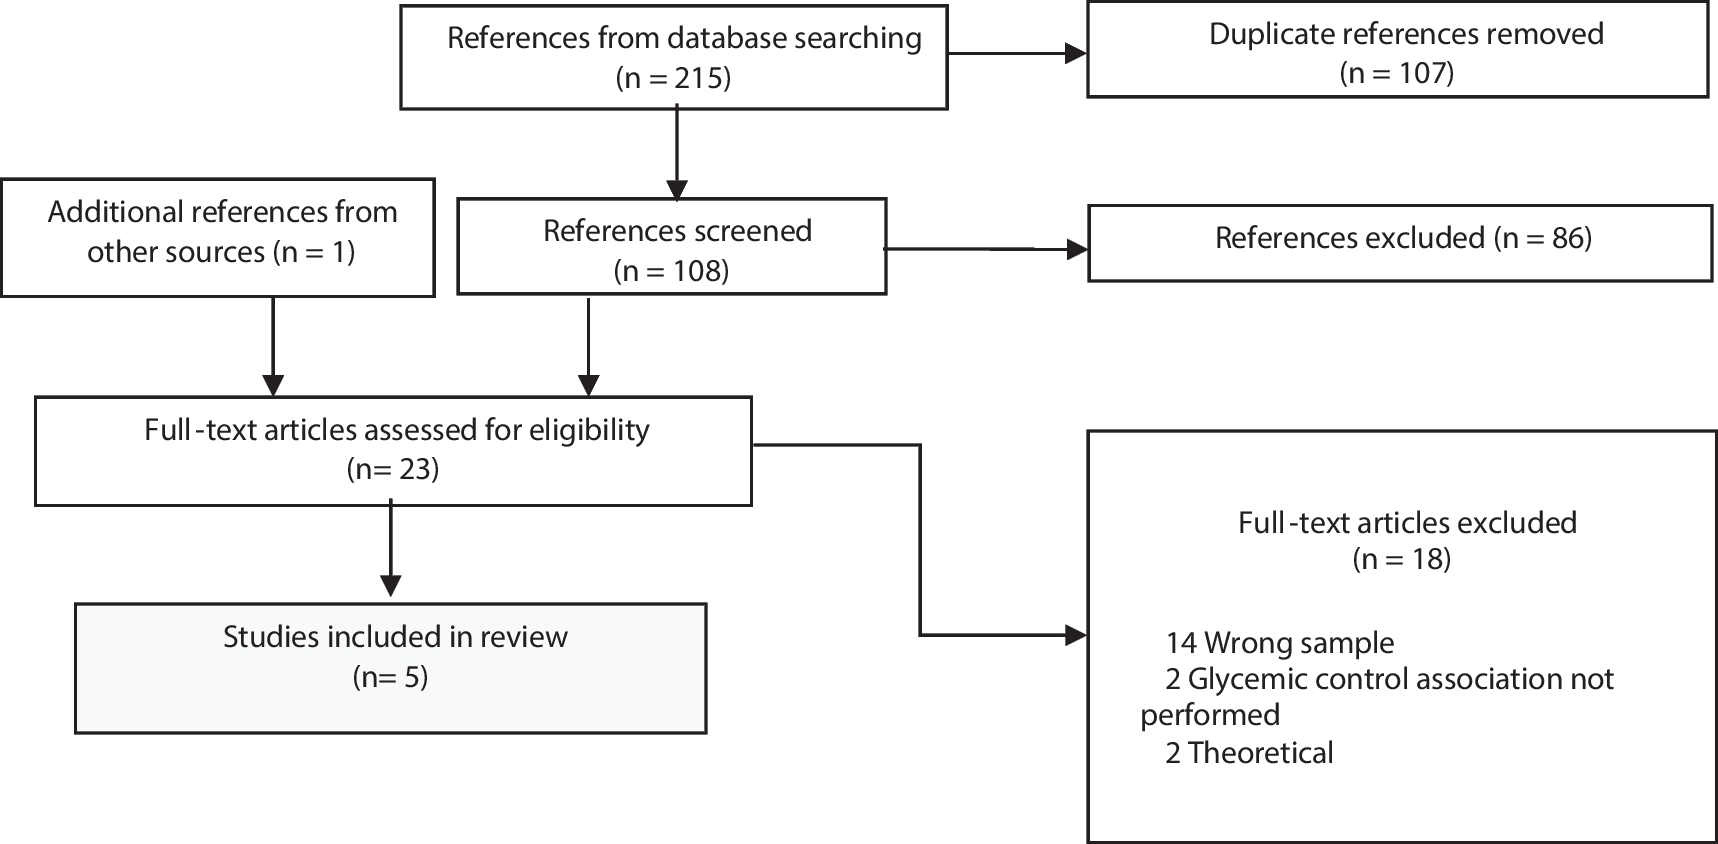


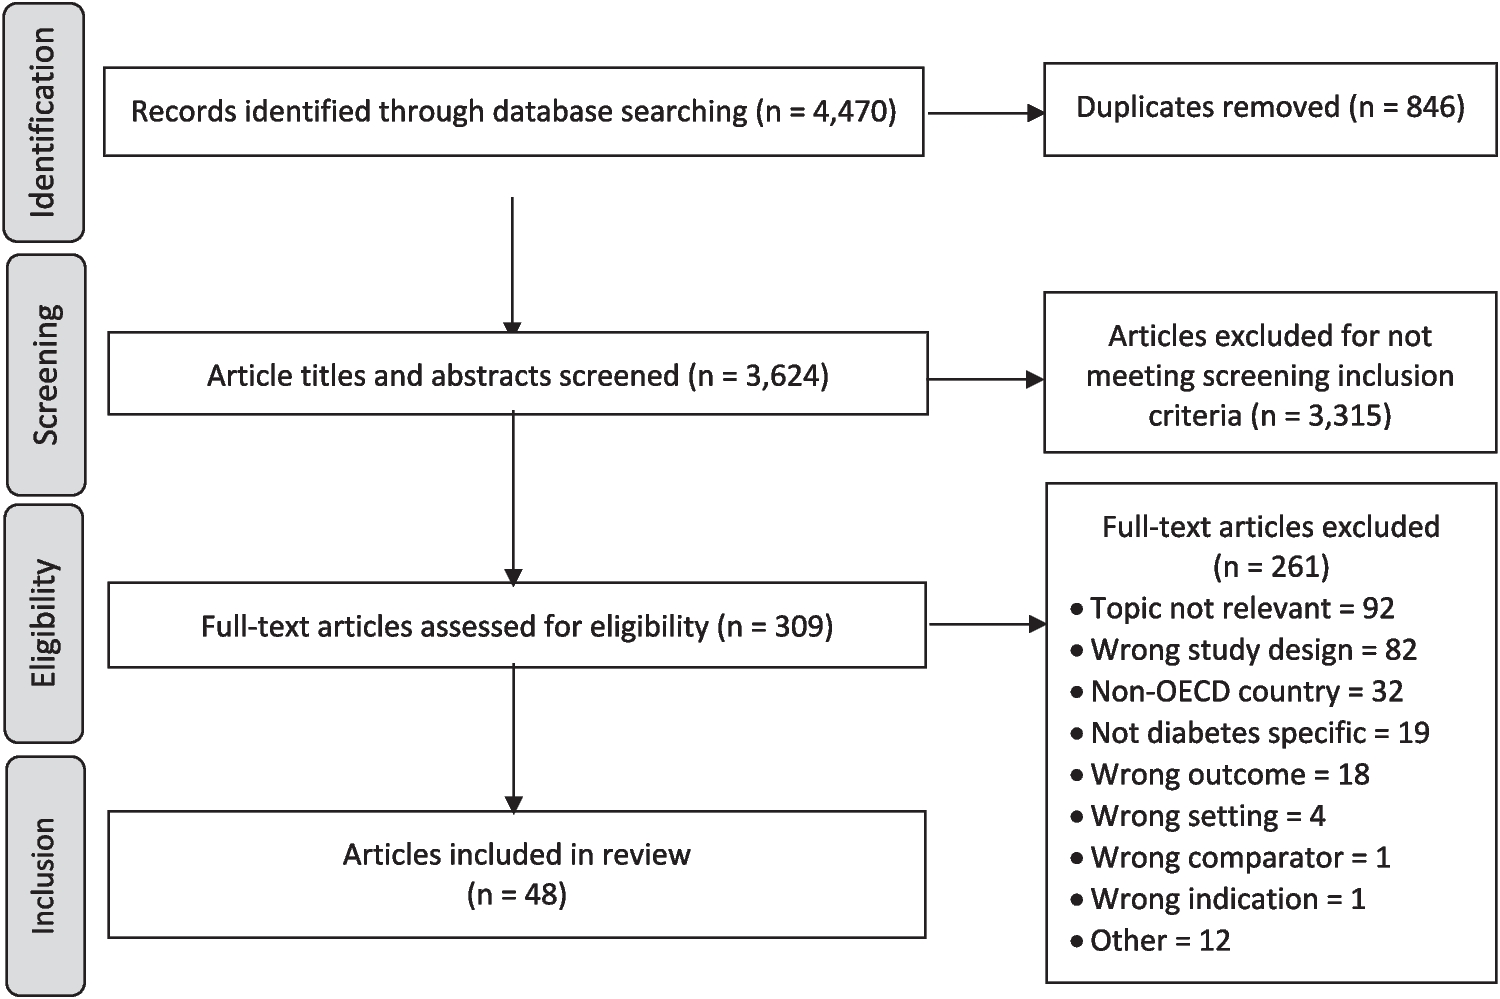
After de-duplication, the search yielded 3,624 articles. A total of 309 were retained for full-text review and 48 were included in this overview (Fig. 1). Characteristics of included reviews are available in Table 2.
Fig. 1
PRISMA flow diagram of articles included in review
Table 2 Overview of included reviewsQuality AssessmentSystematic reviews and meta-analyses (n = 26) were evaluated with the AMSTAR 2 tool. Almost all (n = 18) were assessed as critically low quality, five as low quality and three as moderate quality. Narrative reviews or reviews with no clear methods (n = 22) were evaluated using the SANRA tool. Five ranked as high quality, ten as moderate and seven as low quality. Quality assessment of included reviews are available in Table 2.
Summary of FindingsKey contextual factors identified in the literature included income, employment, education, immigration, race/ethnicity, geography, rural/urban status, built environment, environmental pollution, as well as food security/environment.
A summary of findings by contextual factor of interest is included in Table 3.
Table 3 Summary of findings from included reviewsSocioeconomic StatusSocioeconomic status, measured via income, employment, or education, was consistently associated with increased risk of T2D. Agardh et al. [16] reported an overall increased risk of T2D in low socioeconomic groups whether measured by income (40%), education level (41%), or occupation (31%). Although there is considerable overlap between income, employment, and education, results are presented separately as much as possible.
Income (n = 13)Borchers et al. [17] reported that rates of T1D vary considerably but incidence is lowest in areas of highest material deprivation. High population density and household crowding provided a better predictive model than global measures of socioeconomic deprivation. Incidence of T1D correlates most strongly with indicators of national prosperity such as gross domestic product and low infant mortality, although these results may be at least partially influenced by differences between urban and rural areas which may only serve as proxies for environmental and lifestyle factors.
Results from reviews focused on T2D suggest an increased risk of diabetes in the lower income groups. At the regional level, Rathmann and colleagues [18] reported that the unemployment rate and the regional economic climate of the governing body was associated with T2D prevalence. Using an Index of Multiple Deprivation, the DIAB-CORE consortium confirmed that diabetes is more prevalent in economically weaker regions and increases with unemployment and poorly built environment [18]. Castro et al. [19] suggests that environmental factors such as impoverished neighborhoods are an important modifiable risk factor for T2D. Maier et al. [20] found that the risk of T2D was greater in lowest income groups compared to highest (OR 2.08, 95% CI 1.63–2.65), and in most deprived groups, compared to the least deprived (OR 2.43, 95% CI 1.47–4.04). In sub-group analysis by income level of high-income countries, low education level and low-income occupation level were associated with a 45% and a 31% increased risk of T2D, respectively [16]. Poverty or low socioeconomic status was found to increase the risk of incident T2D and related complications [21]. Data from a Canadian study illustrated a 14% higher incidence of T2D in Ontario in the lowest income quintile relative to the highest (8.26 per 1,000 vs. 7.25 per 1,000), with consistent findings across all ages and sexes [22]. Some populations are overrepresented in lower paying job sectors (e.g., immigrants, ethnic minorities) and are at greater risk of deprivation, food insecurity, diabetes incidence, sub-optimal diabetes management, and poor glycemic control [23, 24].
Employment (n = 4)Ferrie et al. [25] reported that high job insecurity at baseline was associated with an increased risk of T2D in the age- and sex-adjusted analysis compared with low job insecurity (OR 1.19, 95% CI 1.09–1.30). This also remained significant after adjusting for socioeconomic status, obesity, physical activity, smoking, and alcohol use (OR 1.12, 95% CI 1.01–1.24). Oldroyd et al. [26] reported higher age- and sex-standardized mortality rates for T1D and T2D in manual workers than in non-manual workers, independently of socioeconomic position. Based on income level of occupation, the lowest earning employment groups showed highest risk of T2D compared to the highest earning employment groups (RR 1.31, 95% CI 1.09–1.57) [16]. Martinez-Carsodo et al. [23] also reported that immigrants account for 30% of the uninsured population and tend to work in sectors without healthcare access. Thus, they are less likely to use healthcare, and are at increased risk of having undiagnosed (OR 3.74, 95% CI 2.29–6.08) or uncontrolled diabetes (OR 1.94, 95 CI 1.31–2.88), compared to non-immigrant populations.
Education (n = 6)All included reviews reported a significant inverse relationship between education and risk of diabetes [16, 20,21,22,23, 27]. For example, among Hispanics living in the US, prevalence of diabetes was 15% for those with less than a high school diploma, compared to only 7% among those with a bachelor’s degree or higher [21]. Agardh et al. [26] showed that T2D risk was significantly higher in the lowest, compared to the highest education group (RR 1.41, 95% CI 1.28–1.51). Similarly, Maier et al. [20] reported an increased risk of diabetes for those with low compared to medium/high education levels (OR 1.99, 95% CI 1.71–2.32).
Immigration, Race and EthnicityIn many cases, it was difficult to disentangle discussion about immigration, race and ethnicity due to the inherent complexity of these terms and confounding variables. Often, all three concepts were used to calculate acculturation index, which are delineated in the next sections. These concepts were defined by the authors of each review to reflect the unique racial and ethnic composition of their study population, shaped by the region’s historical context, current sociopolitical landscape, and geographical characteristics.
Immigration (n = 10)In most reviews, immigration was defined as time since arrival, country of origin, parents’ country of origin, or ethnic background. Overall, it appeared that time since arrival was correlated with prevalence of diabetes. Adhikari et al. [28] reported a higher prevalence of diabetes among immigrants living in Canada for 15 years or more (male OR 1.52; female OR 1.40) compared to residents of 5 to 9 years. In Denmark, Finland, Iceland, and Norway, prevalence of T2D was highest among immigrants of non-OECD countries, followed by immigrants of OECD countries; non-immigrants had the lowest rates of diabetes [29]. Results were similar from other reviews with higher reports of diabetes prevalence and incidence rates among non-European migrants compared to European born people [30,31,32]. Length of residence in the US was positively correlated with prevalence of T2D, suggesting that immigrants’ health worsens with time spent in the US [23, 33].
Acculturation, or the level to which immigrants adopt attitudes, values, customs, beliefs, and behaviours of a new culture, may also help to explain disease risk [34]. Acculturation is often calculated as an index based on proxy indicators such as birthplace, language use, and number of years spent in a new country. Low levels of acculturation were associated with better health, including lower rates of T2D among Latinos in the US [34]. Based on results from the National Health and Nutrition Examination Study in the US, Aguayo-Mazzucato et al. [21] reported increased risk of T2D corresponding to the level of acculturation with scores ranging from 0 (lowest) to 3 (highest). After adjusting for socio-demographic factors, the study found an increased risk of T2D for acculturation scores of 1 (OR 1.71, 95% CI 1.31–2.23), of 2 (OR 1.63, 95% CI 1.11–2.39) and of 3 (OR 2.05, 95% CI 1.27–3.29) compared to those with a score of 0. Also, Castro et al. [19] reported that T2D prevalence was significantly associated with acculturation in non-Mexican Latinos, but not in Mexican-origin Latinos nor in people of Chinese origin. Finally, English proficiency among Indian and Bangladeshi UK migrants was associated with a lower prevalence of diagnosed and undiagnosed diabetes [35].
Race and Ethnicity (n = 17)Although sometimes used interchangeably, race categorizes people solely based on their physical characteristics, while ethnicity is a multi-dimensional concept that categorizes people based on their culture, religion, language, nationality, geographic origin, etc [36]. Highest rates of T1D were found in Nordic countries and lowest rates were found in Asian, Caribbean, and southern European countries [37]. Outside of Nordic countries, prevalence of T1D seems to be highest among non-Hispanic whites compared to other ethnic groups. This may be due to European ancestry of this group in the US, Canada, Australia, and New Zealand [17].
On the other hand, T2D prevalence was two to three times higher among minority ethnic groups in the UK, compared to the white British population [32]. Moreover, several reviews have shown rates of T2D to be lowest in non-Hispanic whites and highest among South Asians [22, 26, 28, 33, 38,39,40,41]. For example, in a pooled analysis, Meeks et al. [38] reported that compared to people of European descent, South Asians had the highest risk of T2D (OR 3.7, 95% CI 2.7–5.1), followed by people of Middle Eastern and North African, Sub-Saharan African, Western Pacific, and South and Central American descent. According to Agyemang et al. [40], migrants living in Europe have an increased risk of T2D compared to the general population: South Asia (OR 3.7, CI 95% 2.7–5.1); Middle East (OR 2.7, CI 95%1.8–3.9); North Africa, Sub-Saharan Africa (OR 2.6, CI 95% 2.0–3.5) and South and Central America (OR 1.3, CI 95% 1.1–1.6). The prevalence of type 2 diabetes was also higher among Indigenous people in Canada [22, 28], in the United-States [42] and in Australia [43] compared to other ethnic groups. Multiple and complex contextual factors have been contributing to the increased risk of diabetes in the indigenous population in Canada, including the impact of centuries of colonization and marginalization, and other environmental, sociocultural, socioeconomic, and biological/genetic factors [44]. Durazo et al. [45] examined the neighbourhood concentration of race and ethnic minority groups and although results were mixed, some studies indicated that residents of ethnic enclaves exhibit better health than those living outside.
EnvironmentGeography (n = 4)The burden of T2D was found to increase generally in countries with a growth and ageing population. Most adults living with T2D were from China and India (40%), USA and Russia (10%), and Indonesia, Japan, and Mexico (12%) [46]. Most youth living with T2D were from the Western Pacific Region (30%) and from the World Bank upper-middle-income countries (40%). Countries with highest incidence of T2D in youth were China, India, and United States [47]. T1D rates were found to be highest in countries furthest from the equator such as Northern Europe Australia, New Zealand, Northern America and Northern Africa [48, 49].
Rural and Urban Status (n = 9)Borchers et al. [17] found that T1D prevalence was highest in areas with lower population density, such as rural areas. For T2D, evidence shows that rural areas tend to have higher rates compared to urban areas, although this may be related partially to socioeconomic status and the presence of risk factors for diabetes, like obesity [31, 37, 50]. A few authors [22, 31] suggest that economic development and rapid urbanization in low to middle-income countries have contributed to increasing rates of diabetes. Within Canada, they reported geographic variation, with the lowest rates in Western Canada (British Columbia, 5.5%) and the highest rates in Newfoundland (9.0%). Minges et al. [43] reported, based on all three studies they included, diabetes prevalence in indigenous Australian populations living in remote area was approximately twice that in the urban populations. Finally, after stratifying by country-level income, a meta-analysis of 19 studies [51] showed that the risk of T2D in urban versus rural areas was not significantly different (OR 1.15, 95% CI 0.70–1.89), however, highly walkable neighbourhoods were associated with a decreased in risk (OR 0.79, 95% CI 0.71–0.87).
Built Environment (n = 5)Limited evidence from four narrative reviews suggested that an environment promoting walkability, access to greenspaces and safe and connected streets is associated with lower levels of obesity and higher levels of physical activity, which in turn impact rates of T2D [19, 23, 45, 52]. Neighbourhood characteristics like density of healthy food outlets or fast-food outlets, crime, perceived safety, walkability and access to parks/green space was found to impact insulin resistance and diabetes through their influence on physical activity and diet [45]. A meta-analysis of 13 studies concluded that green residential environment was associated with a decrease in T2D prevalence (OR 0.88, 95% CI 0.86–0.89) and mortality (HR 0.92, 95% CI 0.90–0.93) [53].
Environmental Pollution (n = 10)Limited evidence shows that environmental pollutants in food sources may be associated with an increased risk of diabetes. High intake of nitrites and n-nitroso compounds were associated with T1D in children [37]. Kuo et al. [54] also noted a causal association between T2D and the presence of arsenic, mercury, cadmium, persistent organic pollutants (POP), phthalates, and bisphenol A (BPA) in foods. Consuming contaminated water and foods can result in the bioaccumulation of environmental toxins in the food chain like arsenic, mercury, diocin-like compounds, phalates, and BPA [55]. These contaminants can interfere with pancreas function and disrupt the endocrine system leading to obesity, a known risk factor for diabetes. Indigenous people in Canada experience 3–5 times higher rates of diabetes compared to the general population; this disparity may be partially explained by the bioaccumulation of toxins in traditional diet (wild game and fish) [55].
In general, there were limited details on measurement of environmental pollutants, but many studies included satellite images of pollution level in combination with health administrative data sources. Air-borne pollutants result from many [56] mitigatable contextual sources, including but not limited to forest fires, road traffic, manufacturing industries, and in home settings. For example, Thibault et al.’s [27] systematic review focusing on Canadian population found that nitrogen dioxide (NO2), particulate matter (PM), POP, and non-persistent pesticides could partially explain recent increase in T2D prevalence. Also, prolonged exposure to NO2, PM2.5, and PM10 has been associated with increased risk of T2D [27, 57, 58]. Stratified analysis indicated that PM2.5 exposure was associated with an increase in T2D incidence in American countries, but not in European countries [58]. Di Ciaula and colleagues [57] found that T1D incidence among youth aged 0–15 years was greater in European countries with greater emissions of PM10, NO, and volatile organic compounds (VOCs).Wang et al. [56] found that noise pollution may also increase the odds of developing diabetes (OR 1.08; 95% CI 1.03–1.12).
Food Security/Environment (n = 11)Upstream contextual factors contributing to poor diet includes food insecurity, and poor food environment characterised by limited access to healthy foods or access to an abundance of unhealthy foods. In general, an inverse relationship between diet quality and rates of T2D was observed. Poor diet was generally defined as energy dense and nutrient poor.
After contr
Comments (0)