
Remember me
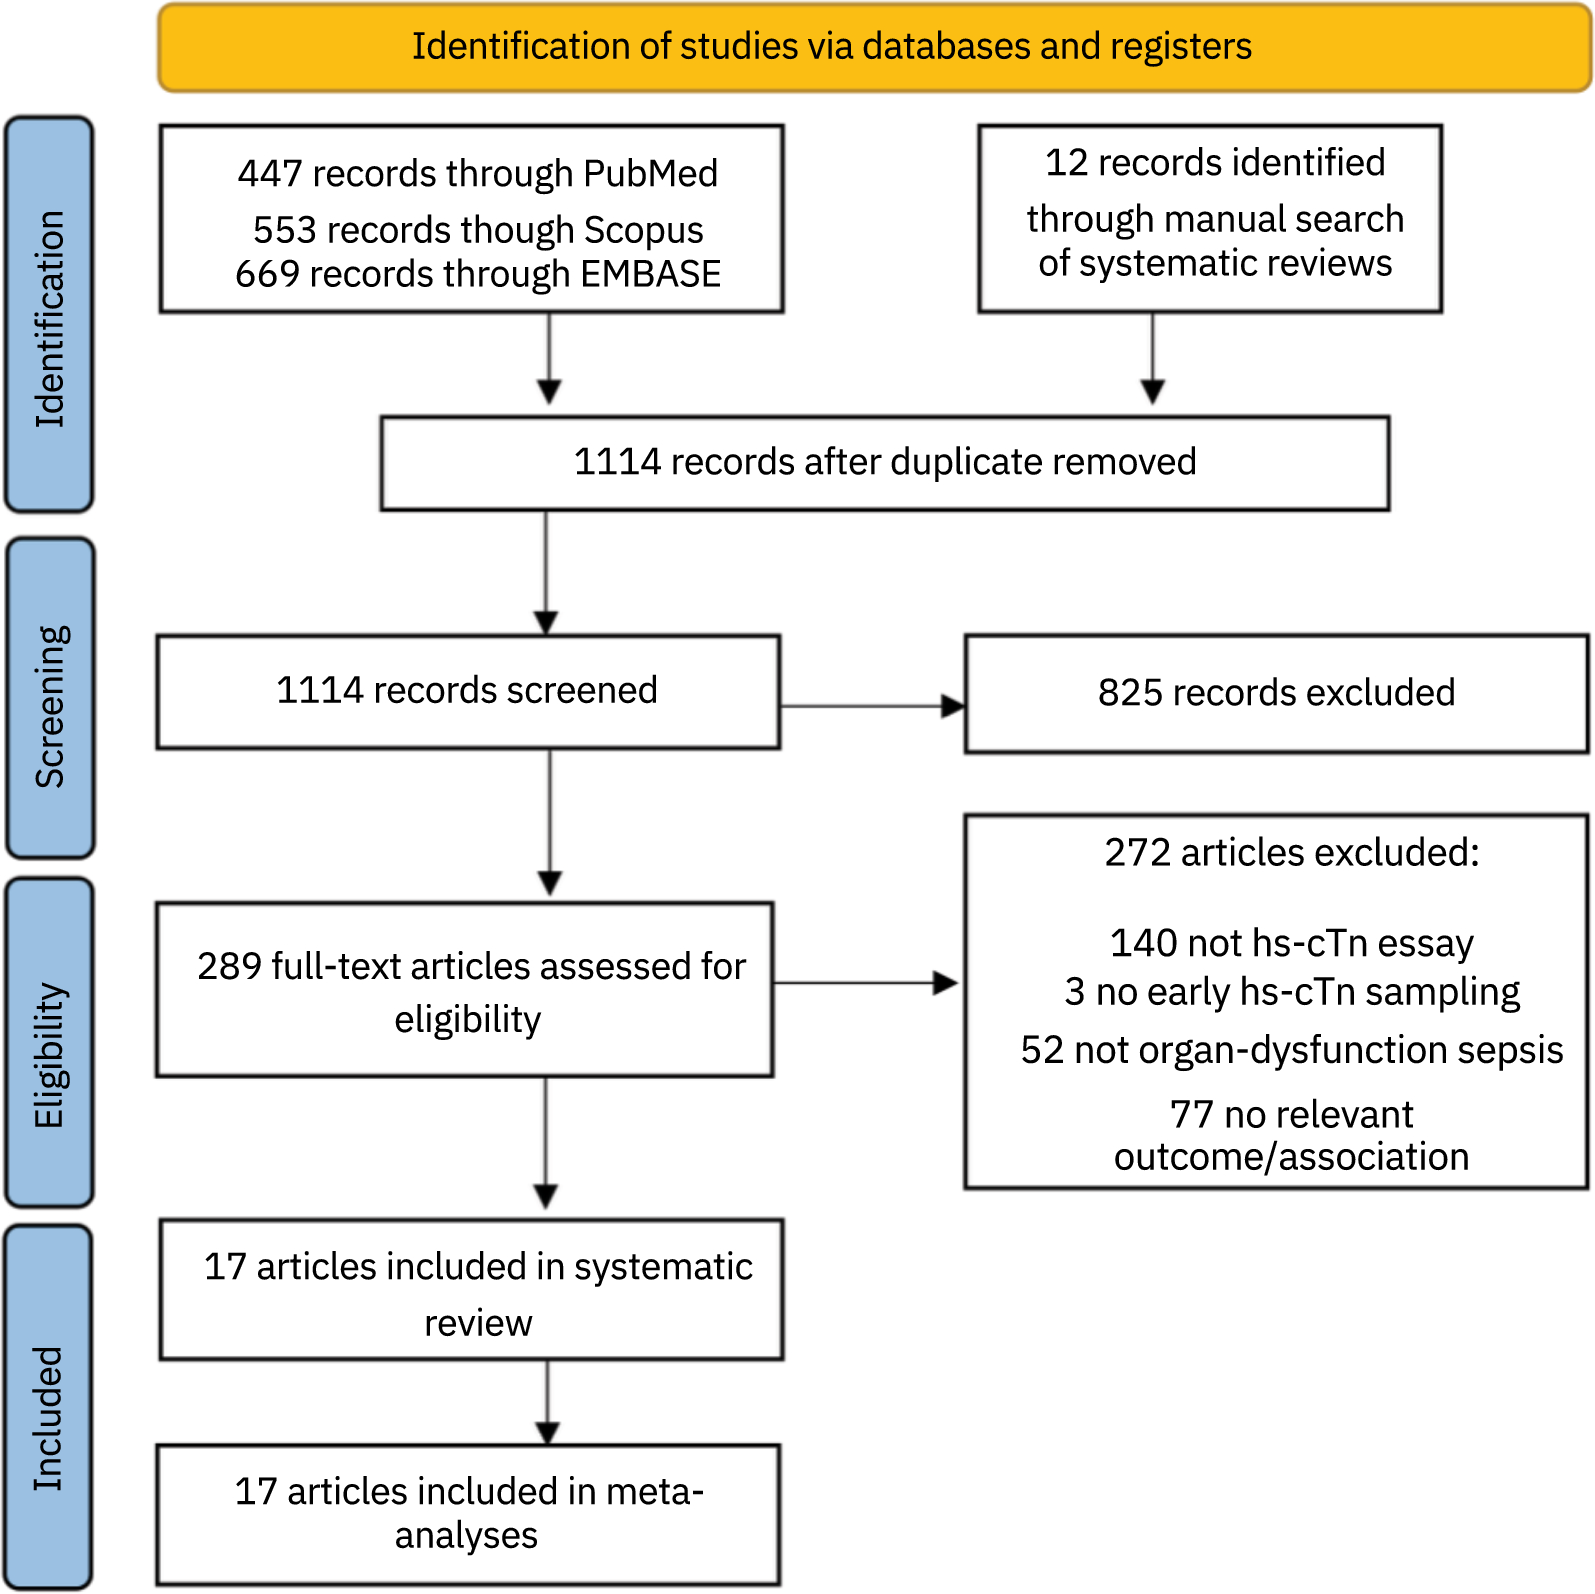


After discarding duplicates, we obtained 1114 references, of which 289 passed the primary screening, and 17 were finally included [7, 21,22,23,24,25,26,27,28,29,30, 34,35,36, 39,40,41], encompassing 6242 patients (Fig. 1). Patients’ mean age ranged between 57 and 73.3. The male percentage was between 52 and 70%. Regarding the type of hs-cTn, 12 studies used cTnT [7, 24, 25, 27, 28, 30, 34,35,36, 39,40,41], and five used cTnI [21,22,23, 26, 29]; none included both.
Fig. 1
Flowchart of study selection process. hs-cTn: High-sensitivity cardiac troponin
Mortality follow-up was 28 to 30 days in 10 studies [21,22,23, 26,27,28,29, 34, 39, 40], up to ICU discharge in two studies [25, 30], and in-hospital in five studies [7, 24, 35, 36, 41]. The short-mortality rate spanned between 16,9% and 53,8%. The sampling time of troponin was described as during the first day in three studies [7, 35, 41], and at-admission in the rest. Three studies were multi-center and 14 single-center. Concerning the study type, 11 studies were prospective cohorts [7, 21, 22, 26, 28, 34,35,36, 39,40,41], four historical cohorts [24, 25, 27, 29], and two randomized clinical trials [23, 30] (Table 1).
Table 1 Included studiesRisk of biasIn the adjusted mortality risk assessment, overall RoB was low in all but two studies included in the model [28, 29]. The study confounding domain was the most problematic since these studies did not adjust for core factors [28, 29]. Other risks were deemed minor and did not justify of downgrading the overall judgment of the study as predefined in the protocol [14]. The RoB assessment of unadjusted OR and SMD models can be accessed in the Additional File 1.
Meta-analysisIn the mortality odds unadjusted model, a total of 1064 individuals died amongst 3935 patients, constituting a mortality rate of 27%. The pooled OR for elevated hs-cTn was 1.78 (95% confidence interval (CI): 1.41–2.25), which suggests that individuals in the elevated troponin group had 78% higher odds of death (Fig. 2). The adjusted model included 1216 events out of 4336 total patients, with a mortality rate of 28%. The adjusted model showed no significant association between elevated hs-cTn and mortality (OR = 1.06, 95% CI 0.99–1.13). We omitted one study [41] from the latter model because it reported an OR that was thousands of orders of magnitude greater than the others (Fig. 3.). Disease severity scores (SOFA, APACHE-II, and SAPS-II), comorbidities, age, and cardiac function parameters, among others, were common confounding factors used to adjust the effect estimates (Table 1). The certainty of the evidence was assessed using the adjusted analysis and was deemed to be moderate (Table 2).
Fig. 2
Meta-analysis of unadjusted association between elevated high-sentivity cardiac troponin and sepsis mortality
Fig. 3
Meta-analysis of the adjusted association between elevated high-sentivity cardiac troponin and sepsis mortality
Table 2 Summary of FindingsIn the SMD model, the incidence of events was 31% (775 out of 2489 patients). This unadjusted estimate revealed an increase of 0.84 SMD (95% CI 0.16–1.52) of serum hs-cTn levels among the deceased patients (Fig. 4.). Using a representative standard deviation [27], this effect size would translate to a mean difference of 105.6 ng/L (95% CI: 20.4 to 190.8 ng/L) between both groups.
Fig. 4
Meta-analysis of standardized mean difference of serum high-sensitivity cardiac troponin between survivors and non-survivors
Heterogeneity and sensitivity analysisWe assessed inconsistency primarily by visual inspection and then taking into consideration I [2] statistics (where I2 > 50% and p-value < 0.10 is usually considered relevant heterogeneity) [20]. The unadjusted mortality odds model barely showed any heterogeneity at all. In the adjusted odds model, we attributed the high I2 statistic to the large sample size and small CIs of the two main studies [27, 29]. Indeed, by removing any of the studies, the I2 statistic dropped to 44.5% and 0%, respectively. Ultimately, we deemed heterogeneity irrelevant since their estimates were very close.
A sensitivity analysis of only with category-based adjusted effect measures [7, 22, 27, 28], presented an estimate reasonably similar to the model with all adjusted studies (OR 1.07, 95% CI: 1.03–1.13). Notably, this estimate also almost exclusively renders a low RoB sample. Therefore, no subgroup analyses were performed on these models.
The troponin SMD model revealed substantial heterogeneity by visual and statistical tests. Subgroup analysis for cohorts of patients with shock vs. without shock, and by troponin assay could not identify the root of the heterogeneity (p-values for subgroup differences were 0.87 and 0.73, respectively). When we removed the Landesberg et al. study [41] because its SMD and adjusted OR were far greater than the rest of the studies, the estimate decreased to 0.49, but I2 only reduced to 60%. The forest plots of subgroup analyses are accessible in the Additional File 1.
Publication biasDespite having few studies in each model, none of the funnels presented asymmetry. Considering the broad search, which included abstracts and conferences, we have no reason to think that any estimates have been systematically omitted (Fig. 5). We ran an Egger test for the SMD model, which has over ten studies, and was not statistically significant.
Fig. 5
Funnel plots for a unadjusted mortality risk model; b adjusted mortality risk model; c troponin SMD model
Comments (0)